Key highlights:
Bitcoin is still under pressure and in the last 24 hours, the BTC price fell by 1.63%, trading close to the $63,690 zone and moving almost in sync with the broader market.
The total crypto market cap is down 1.15%, and what stands out is how tightly Bitcoin is tracking traditional markets. With an 88% correlation to the S&P 500, this isn’t a crypto-specific event.
Renewed U.S. tariff tensions and continued institutional selling through spot Bitcoin ETFs are weighing on risk assets across the board. But beyond the macro noise, a bigger technical signal is starting to get attention.
A Bitcoin death cross that has history behind it
Ali Martinez recently pointed out that since 2014, a death cross between the 50 and 200 simple moving averages on the 3-day chart has consistently appeared before the final leg down of Bitcoin bear markets.
If you look at the chart, the pattern is hard to ignore. Every time the 50-period SMA falls below the 200-period SMA on the 3-day chart, the BTC price always seems to push lower in a final move before establishing a strong bottom. These pullbacks have historically been around 50% to 70%.
Since 2014, the death cross between the 50 and 200 simple moving averages on the 3-day chart has consistently preceded the final leg down of a Bitcoin $BTC bear market. https://t.co/9vGw5OdDVY pic.twitter.com/lSM8BRrxSw
— Ali Charts (@alicharts) February 23, 2026
What’s important here is timing. In past cycles, the death cross didn’t kick off the bear market. It showed up late, closer to the end, just before the final capitulation phase. That’s why traders are watching this one closely. If history repeats, the BTC price could still have one more aggressive flush before stabilizing.
Bitcoin on-chain data isn’t screaming panic
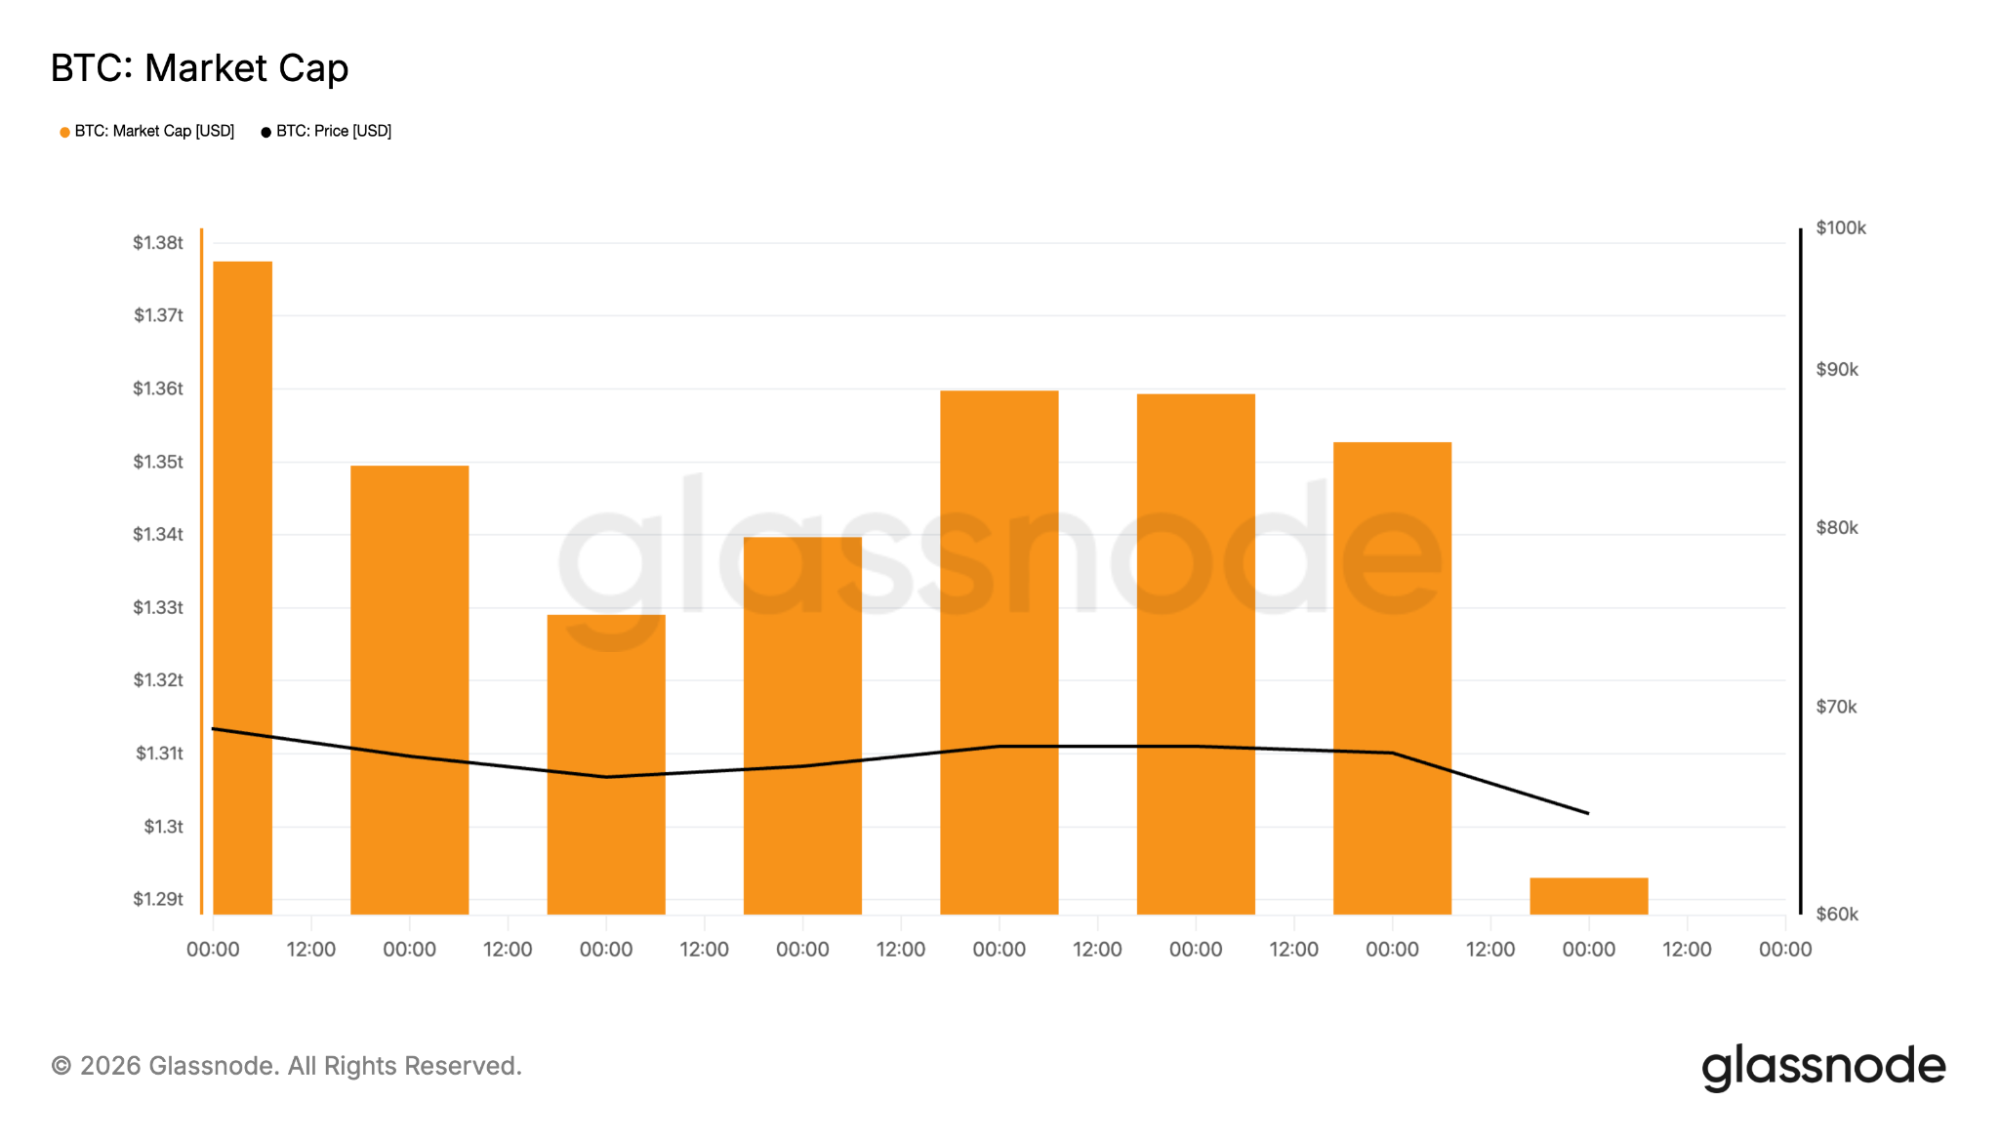
Looking at Glassnode data, things get more interesting. Market cap has declined along with price, but it hasn’t collapsed. The BTC price is under pressure, yet overall valuation remains far above previous cycle lows.
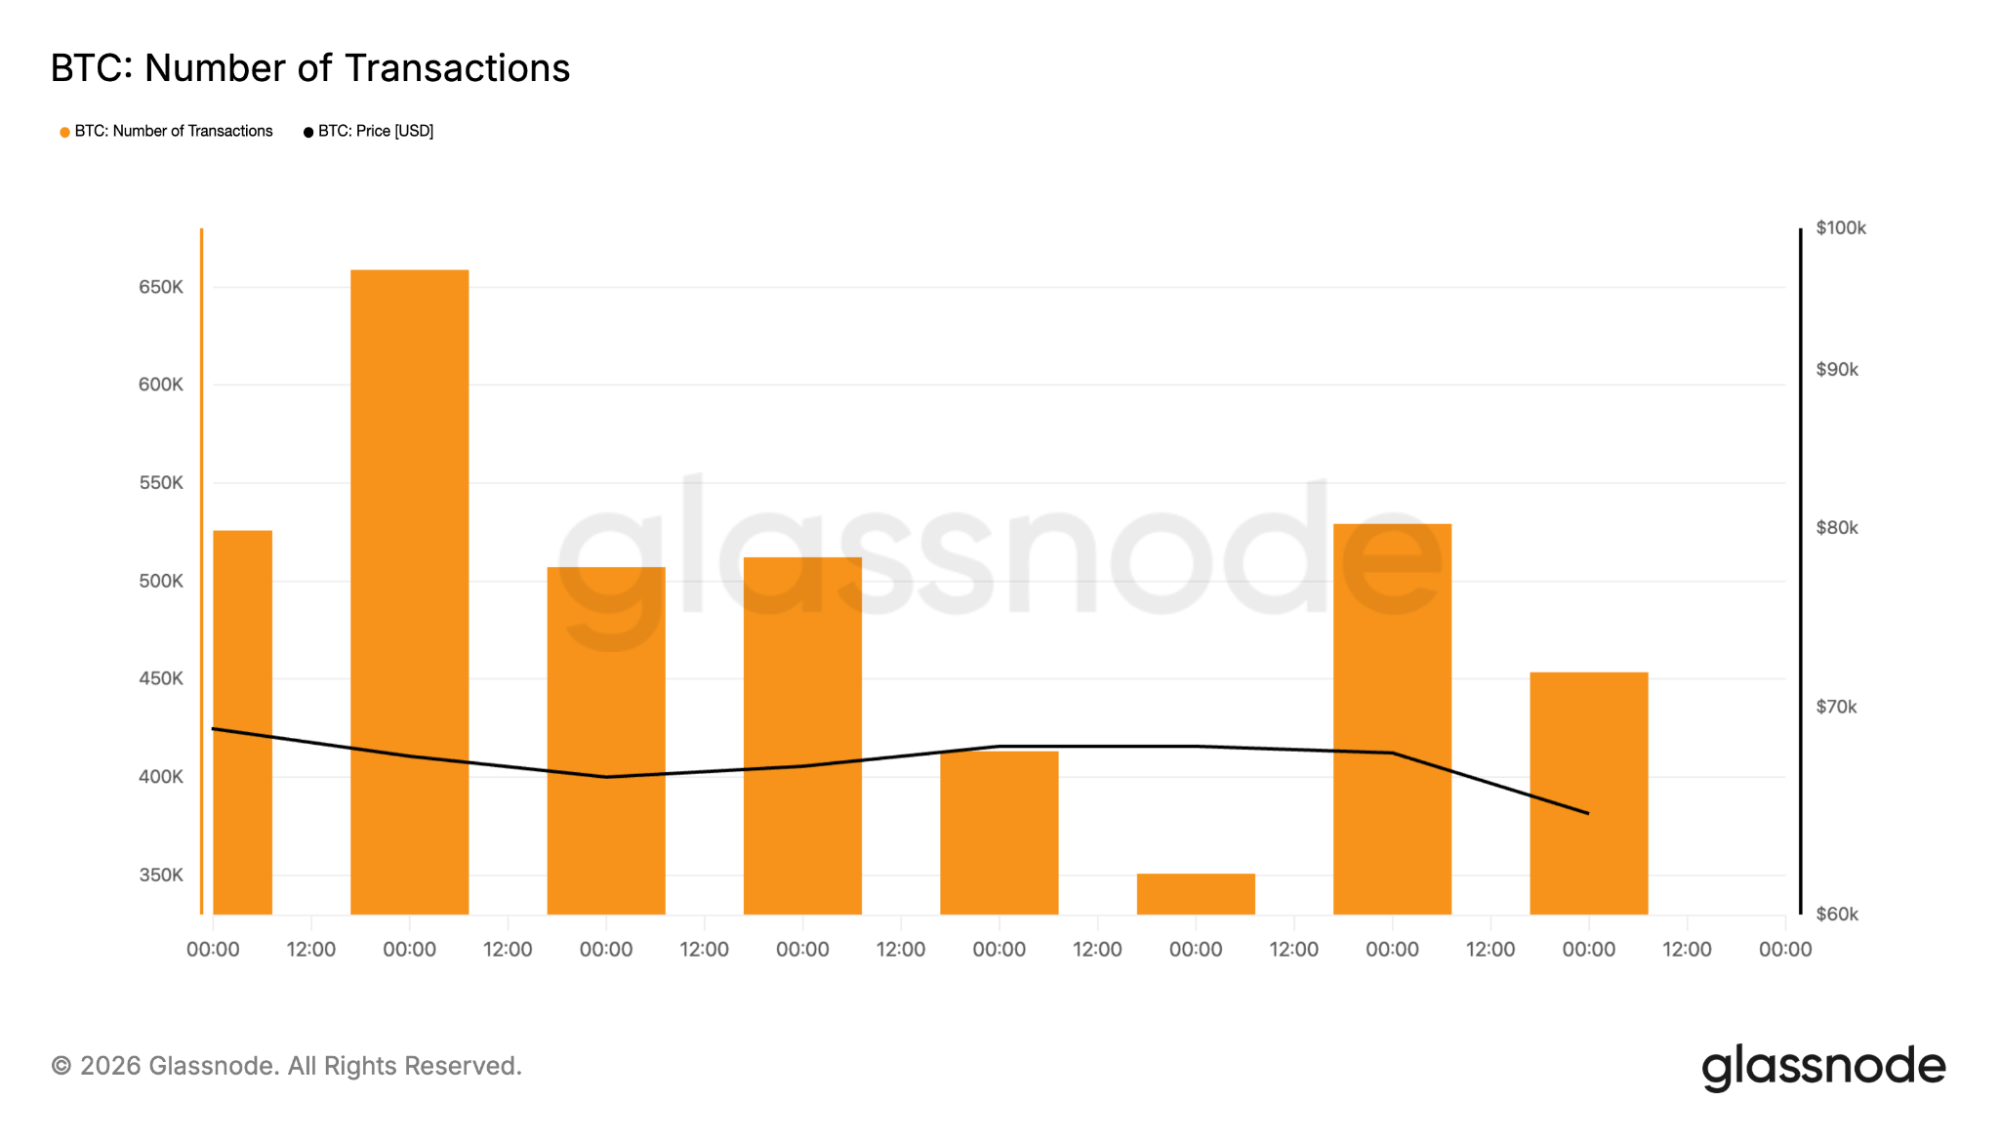
Active addresses aren’t exploding higher, and transaction counts look relatively stable. In past capitulation phases, you often see sharp spikes in network activity as forced selling and redistribution take place.
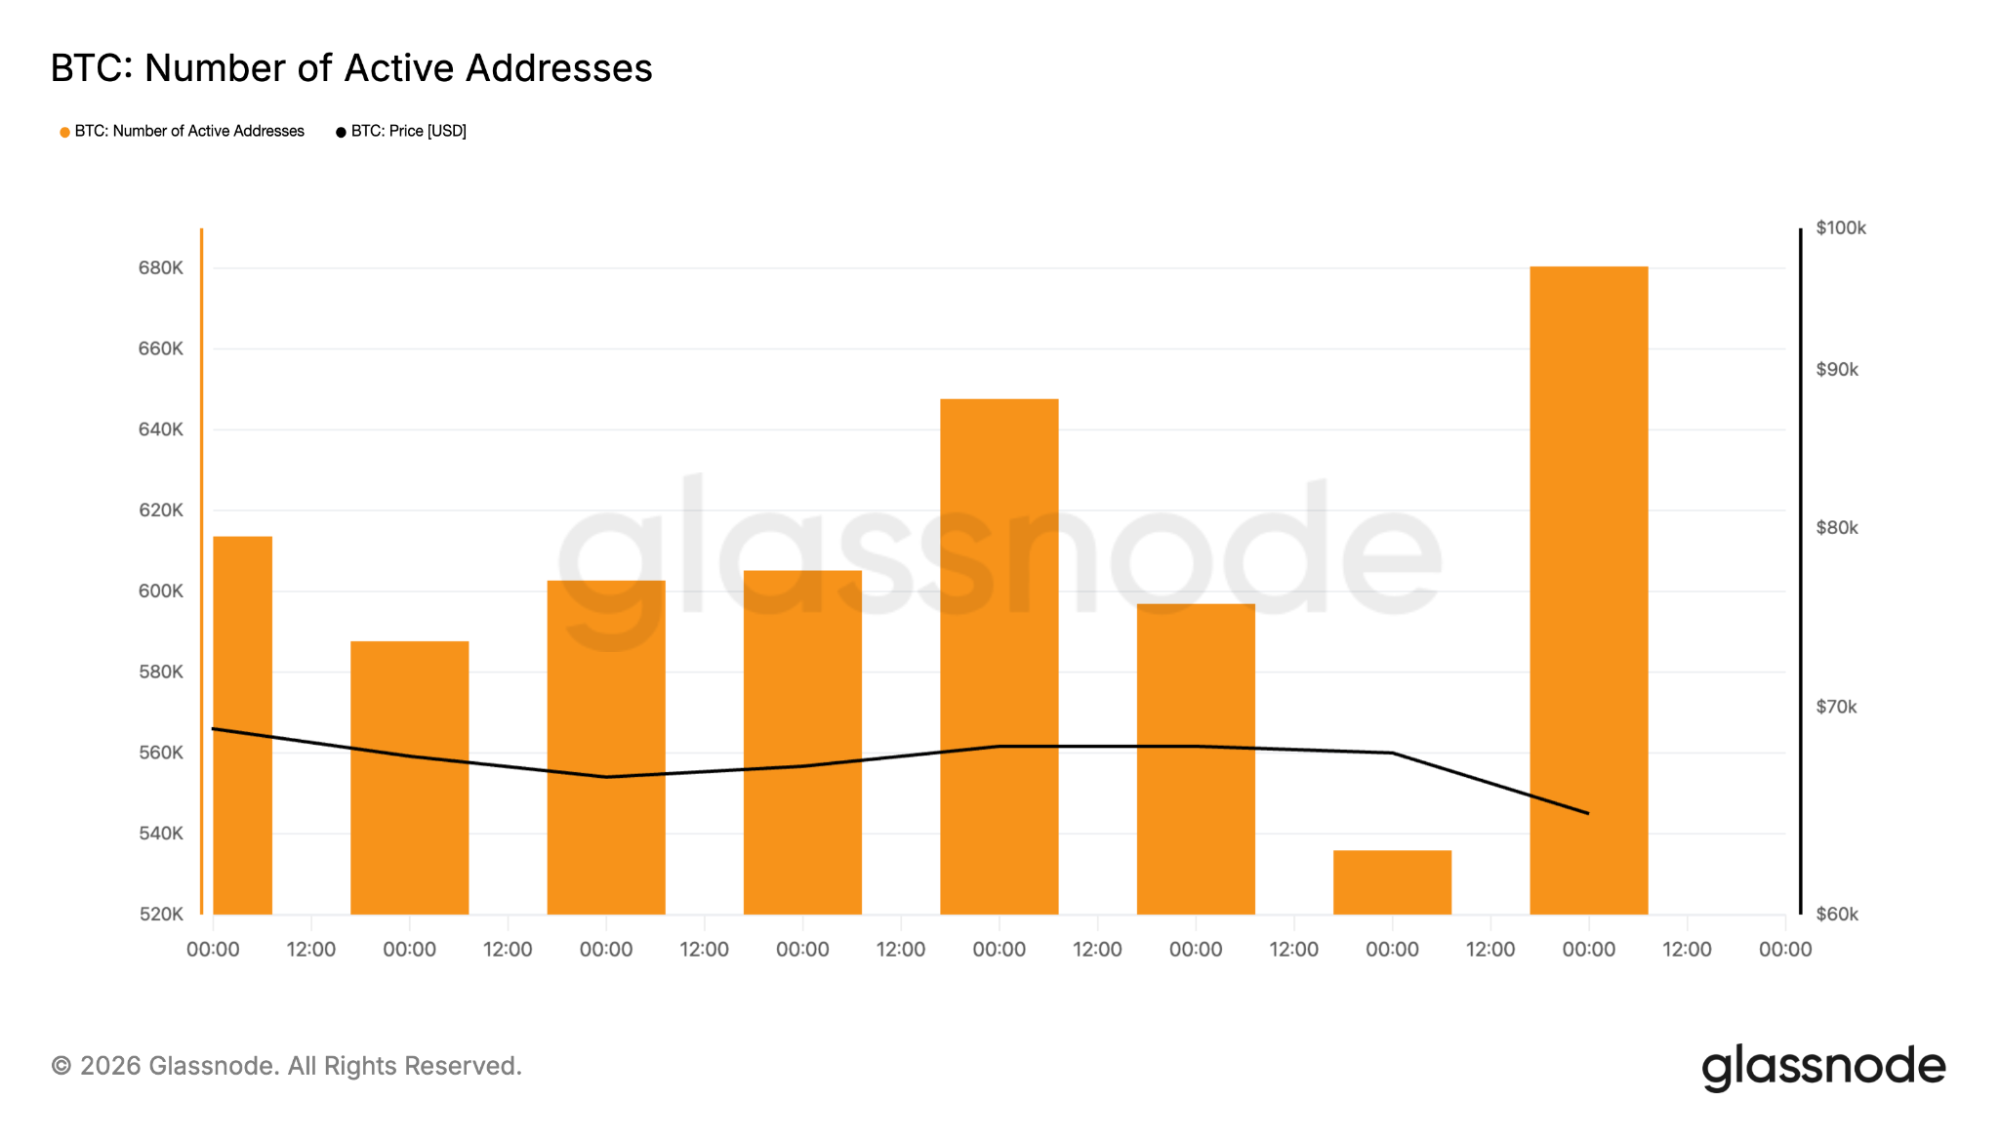
That kind of dramatic on-chain surge isn’t obvious right now. That indicates something important: this feels more like controlled selling and macro-driven pressure than full-blown panic.
The $60,000 level is the line in the sand for BTC
On the daily chart, the BTC price has already lost several key Fibonacci retracement levels. The 0.5, 0.618, and 0.786 levels from the previous major swing have all been broken to the downside. That tells you this correction has depth.
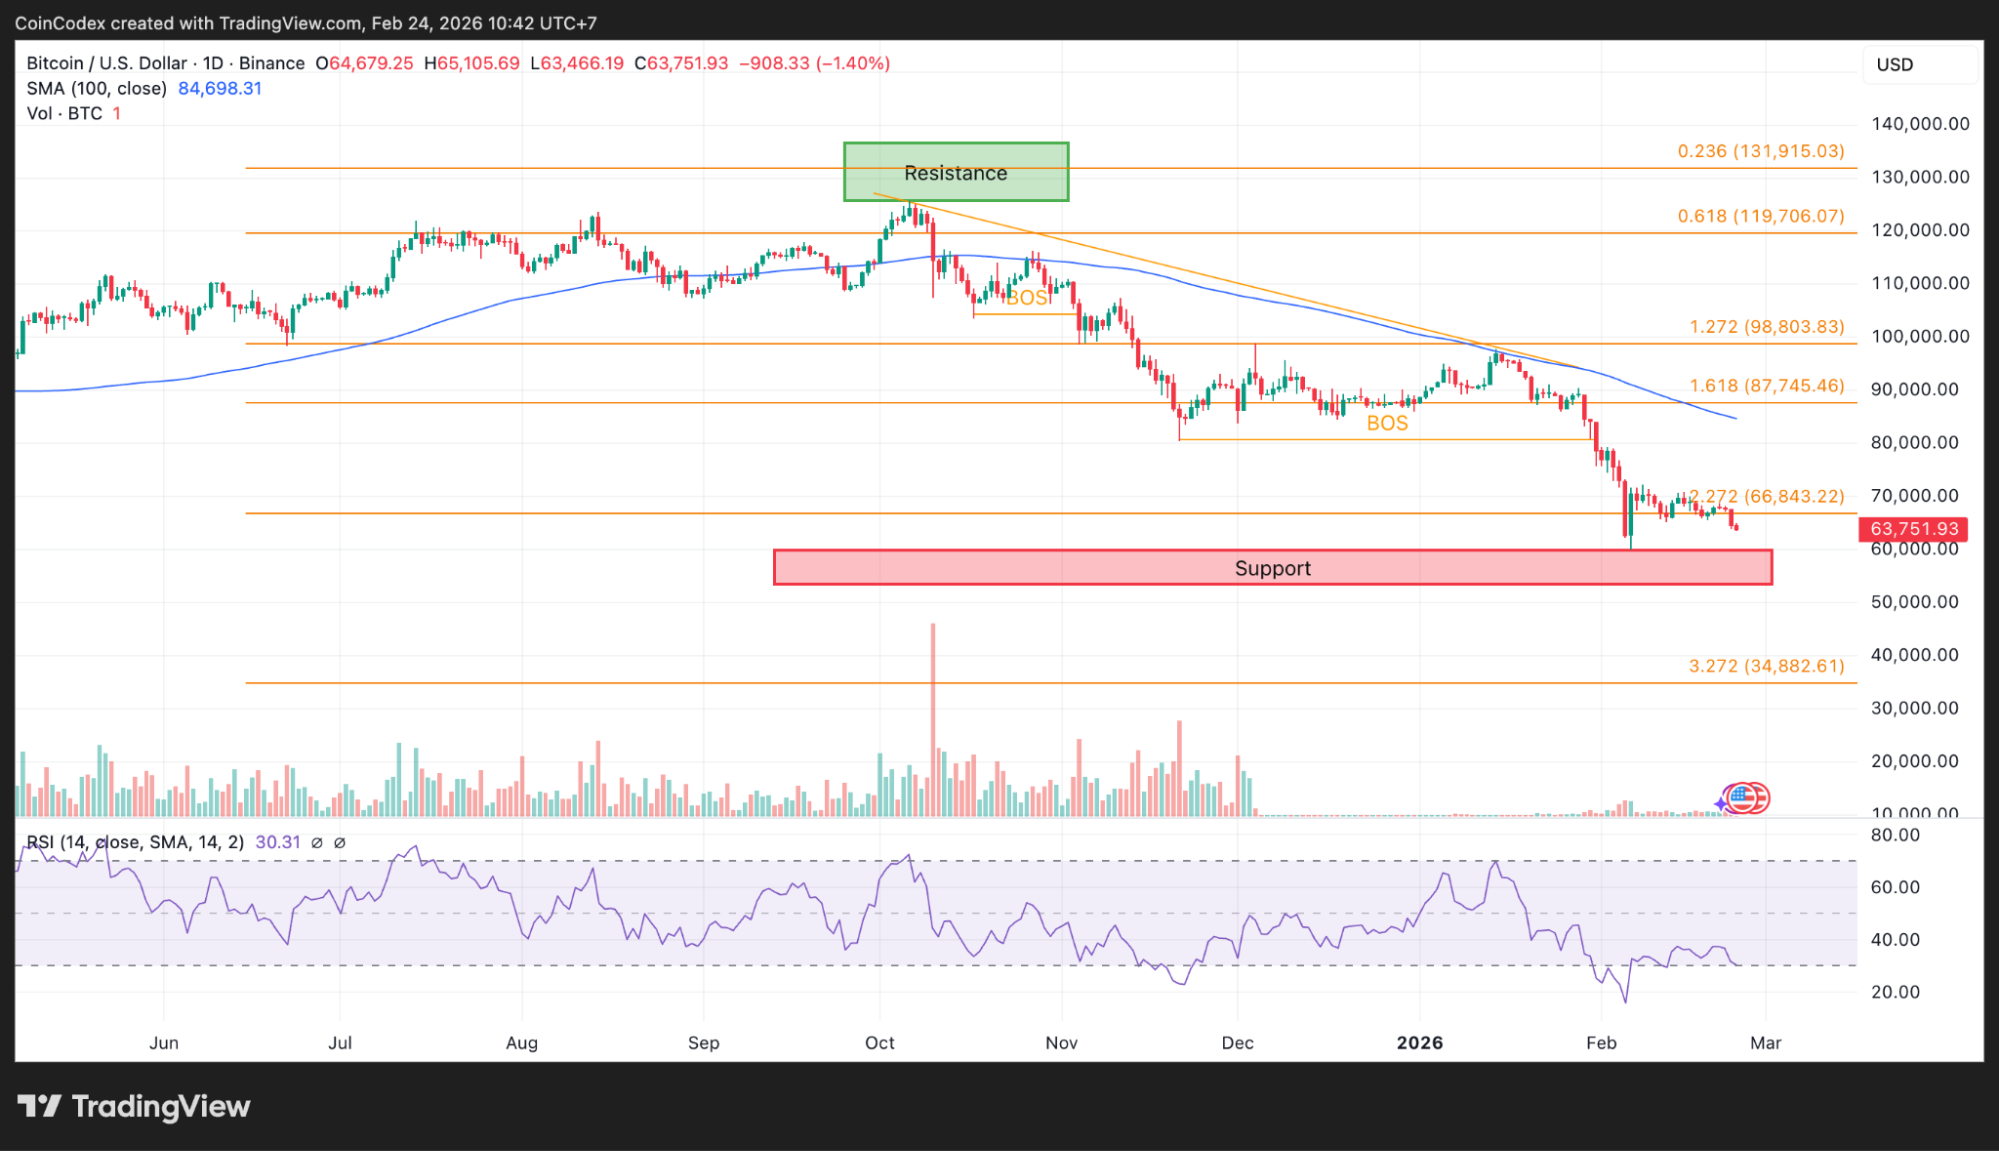
Daily BTC price chart analysis
Right now, the focus is on the support zone around $60,000 to $60,400. That area lines up with a major retracement level and has already produced one bounce. But the structure doesn’t look strong yet. If the BTC price breaks cleanly below $60,000, the next logical target sits much lower, near the mid-$40,000 region based on extension levels.
On the 4-hour chart, resistance is stacked above. Previous breakdown zones around $71,000 to $73,000 now act as supply. Even if we get a relief rally, the BTC price would need to reclaim that region to flip momentum back in favor of bulls.
RSI on the daily timeframe is hovering near 30. That’s oversold territory, and historically it can lead to short-term bounces. But oversold doesn’t automatically mean reversal. In strong downtrends, RSI can stay pinned for longer than most expect.
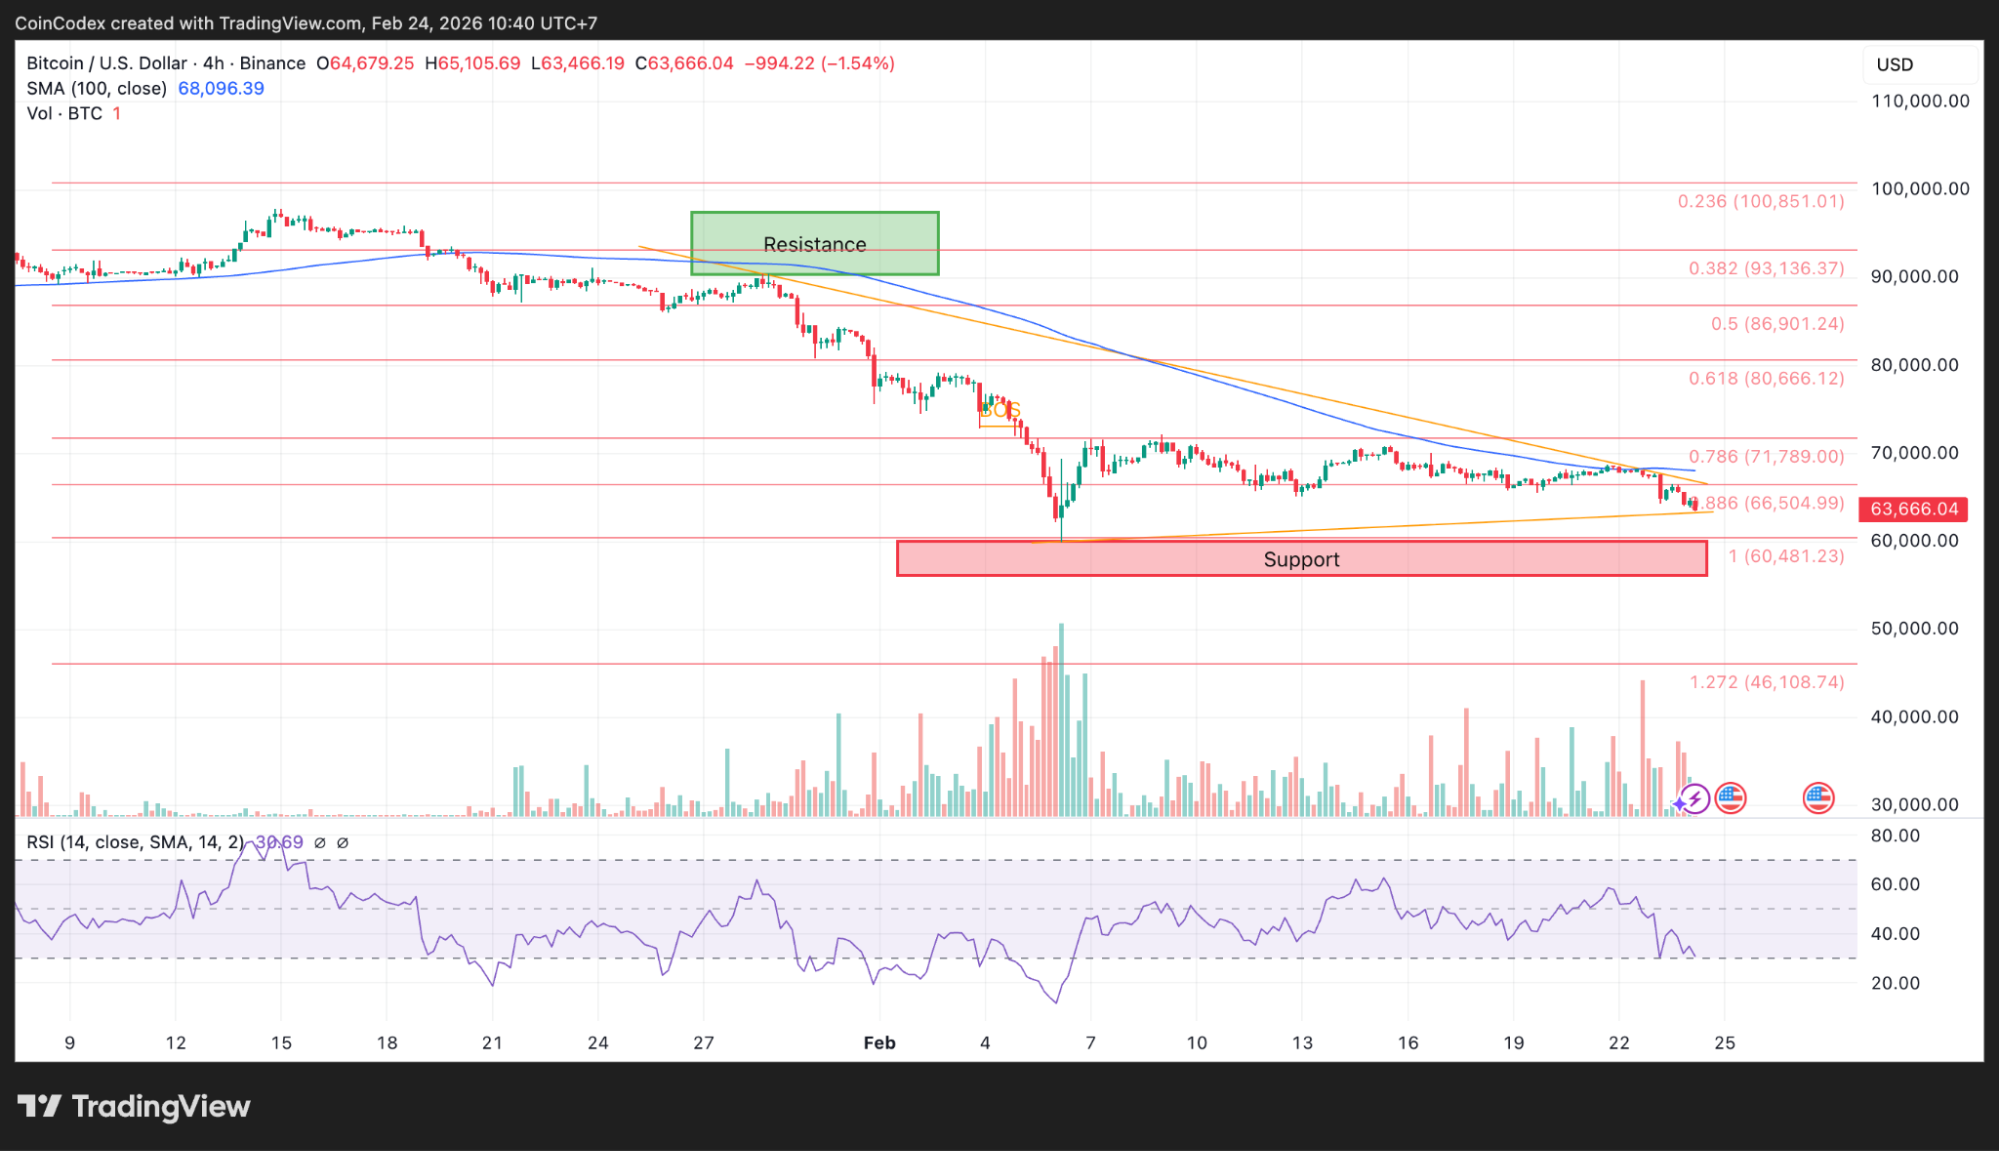
4-hour BTC price chart analysis
Right now, the BTC price is trading like a high-beta tech stock. The 88% correlation with the S&P 500 tells the story. Tariff headlines and ETF outflows are influencing price action more than crypto-native developments.
That means even strong technical levels can break if equities continue to slide. On the flip side, if traditional markets stabilize, Bitcoin could catch a bid quickly, especially with RSI in oversold territory.
So is this the final flush?
The big question is simple: is this the final leg down that historically follows a 3-day death cross, or is it just another correction inside a broader bull structure?
The BTC price is sitting at a critical decision point. The $60,000 zone is major support. The death cross warning is now on the chart. Momentum is weak, but not chaotic. On-chain data isn’t flashing full capitulation.
If $60,000 fails decisively, history indicates a deeper downside could come fast. If it holds and buyers step in aggressively, this could end up looking like a bear trap that resets sentiment before the next upward phase.
Either way, one thing is clear: the BTC price is not in a boring spot. The next move from here will likely define the next few months of market structure.
CoinCodex’s 1-month BTC price prediction places the price at around $74,186. This indicates that there may be a rebound from current levels, with price potentially rising to test the mid-range resistance level.
Kraken: Best crypto exchange for security & reliability
- Buy, sell, and trade 400+ cryptocurrencies with industry-leading security
- Spot, Futures & Margin trading – leverage up to 5x for advanced traders
- Earn rewards with staking on top cryptocurrencies
- 24/7 customer support and high liquidity for fast trades
- Regulated in the US with strong compliance and security measures
- 13+ million users worldwide
Disclaimer: This content is for informational purposes only and does not constitute financial, investment, or other advice. Nothing on this page is a recommendation or solicitation. Always seek independent professional advice before making investment decisions. Some links may earn us a commission at no extra cost to you.
Source:: Bitcoin (BTC) Price Prediction: Death Cross Flashes Again – History Points to One More Move