Key highlights:
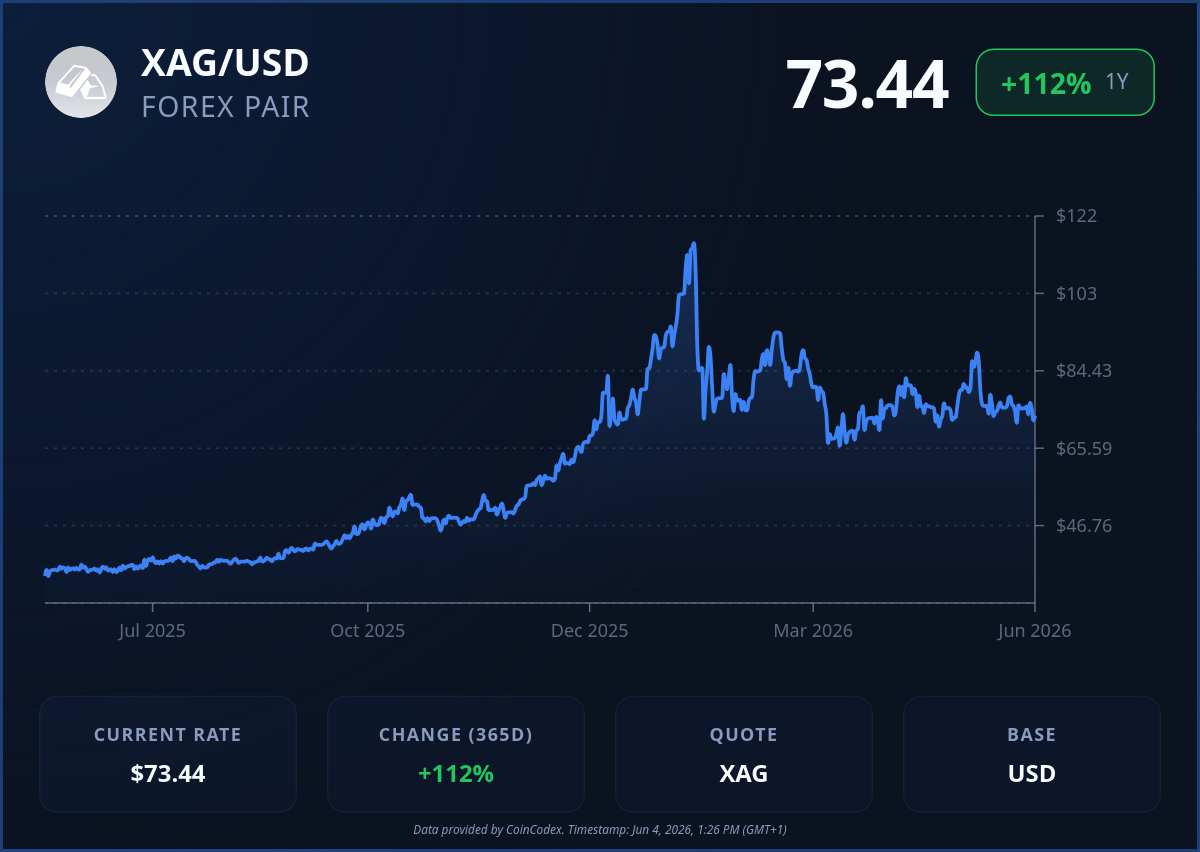
- Silver climbed from the mid-$40s to above $80 before pulling back, with traders watching if it’s just a pause or a deeper correction.
- Key levels to watch are $70–$72 support, with $52–$55 as the next major downside zone if pressure builds.
- Higher timeframe structure still leans bullish, but short-term momentum has weakened after recent highs.
, silver could move toward $63.05, which is below the current trading range and indicates limited upside in the near term.
What traders are watching next
The next move really comes down to whether the $70–$72 area holds or breaks. If buyers defend that zone, the silver price could stabilize and make another attempt back toward the $80–$82 highs. That would keep the larger bullish structure intact and reset the trend back toward continuation.
If that level breaks, though, attention shifts quickly toward the $52–$55 support zone. That would represent a much deeper correction and would change how traders view the current cycle.
Right now, silver is caught between two possibilities. Its long-term trend looks good, but short-term, it’s facing pressure. Whether this pullback stays small or gets big depends on the next moves in the market.
Source:: Silver Price Forecast: Daily Channel Breaks Down – Next Stop Mid-$50s If Support Fails