Key highlights:
AAVE is back at a level that has attracted buyers multiple times in the past, putting the market at an important crossroads. After a lengthy correction from its cycle highs, the AAVE price has fallen back into what many traders view as a major accumulation area.
That has sparked a familiar debate. Some investors see a chance to position before a larger recovery. Others point to ongoing risks in the DeFi sector and argue that AAVE still has plenty to prove before the trend can truly turn around.
AAVE is testing a level that has held before
We had a look at the chart shared by CryptoTheBossX, and the focus is clearly on the black support zone that has acted as a launchpad for previous rebounds.
🔷️ $AAVE has returned to one of the strongest long-term demand zones after a prolonged correction from its cycle highs. The current weekly structure shows buyers attempting to defend the black support area that has historically produced strong reversals. 👀
Over the past year,… pic.twitter.com/SVRSPK1NMB
— The Boss (@CryptoTheBossX) June 25, 2026
Over the past year, recovery attempts have repeatedly stalled at the yellow resistance levels shown on the chart. Buyers have stepped in near support, but none of those rallies have been strong enough to push through the key resistance areas overhead.
That leaves the AAVE price at a critical point. If support continues to hold, traders can make a case for a move back toward resistance. If buyers lose control of this area, the market could open the door to another leg lower.
The bigger picture shows how much ground AAVE is still trying to recover. The token remains about 81% below the major high near $426.32 visible on the daily chart. Even after rebounding from lows around $40, the recovery remains incomplete.
AAVE’s short-term momentum has improved
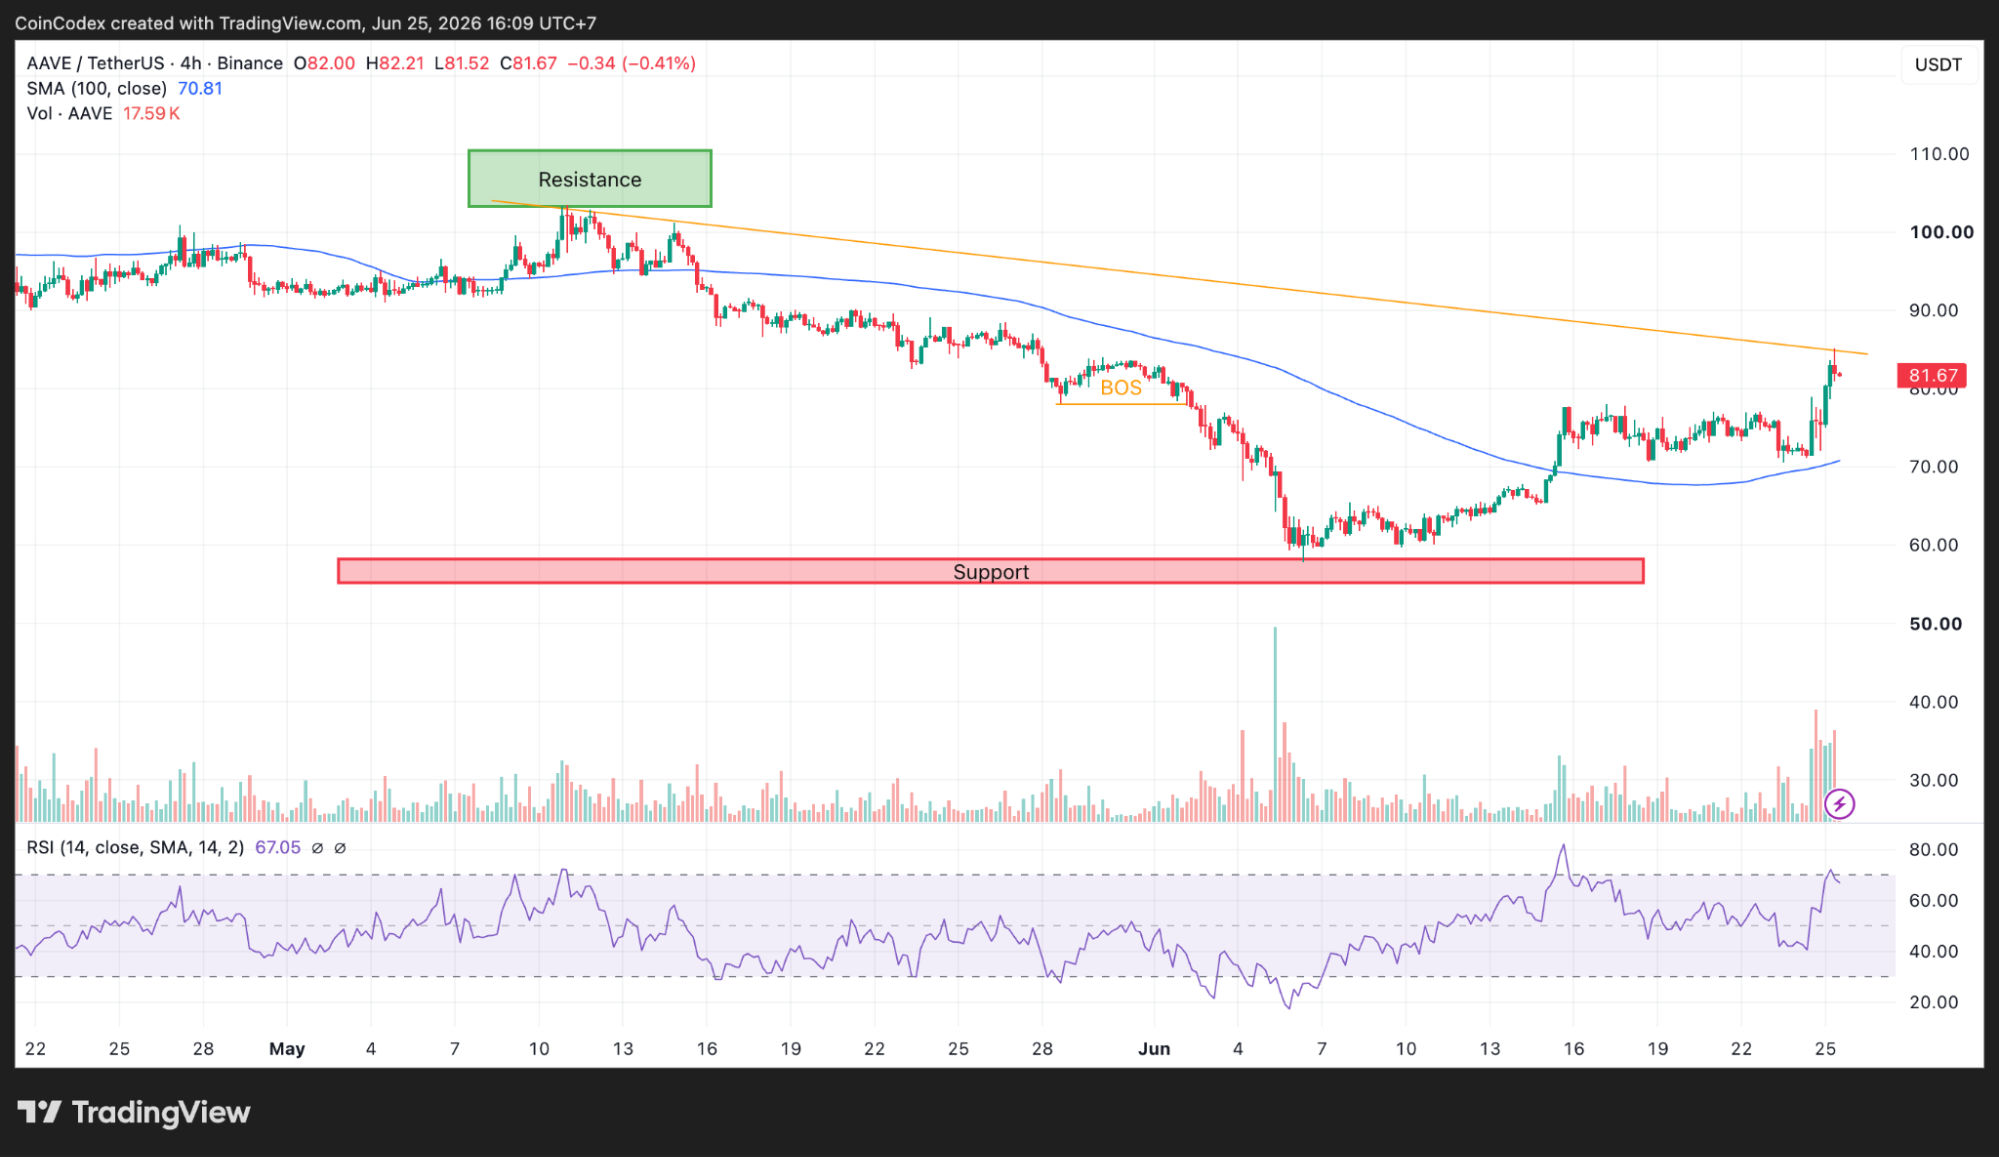
The 4-hour chart shows that the near-term trend has been heading in the right direction. AAVE’s price is at $81.67, significantly above the 100 period Simple Moving Average at $70.81. This means that the token is approximately 15% above one of its most critical trend indicators.
4-Hour AAVE chart analysis
The uptrend has been rather slow. In late April, the AAVE price stood at $50, increased to $60 in May, rose to the level of $70 in early June, and now is holding above $80. Technical indicators back the movement. On the 4-hour chart, the RSI indicator has a value of 67.05, meaning that it has bullish momentum but is not overbought yet.
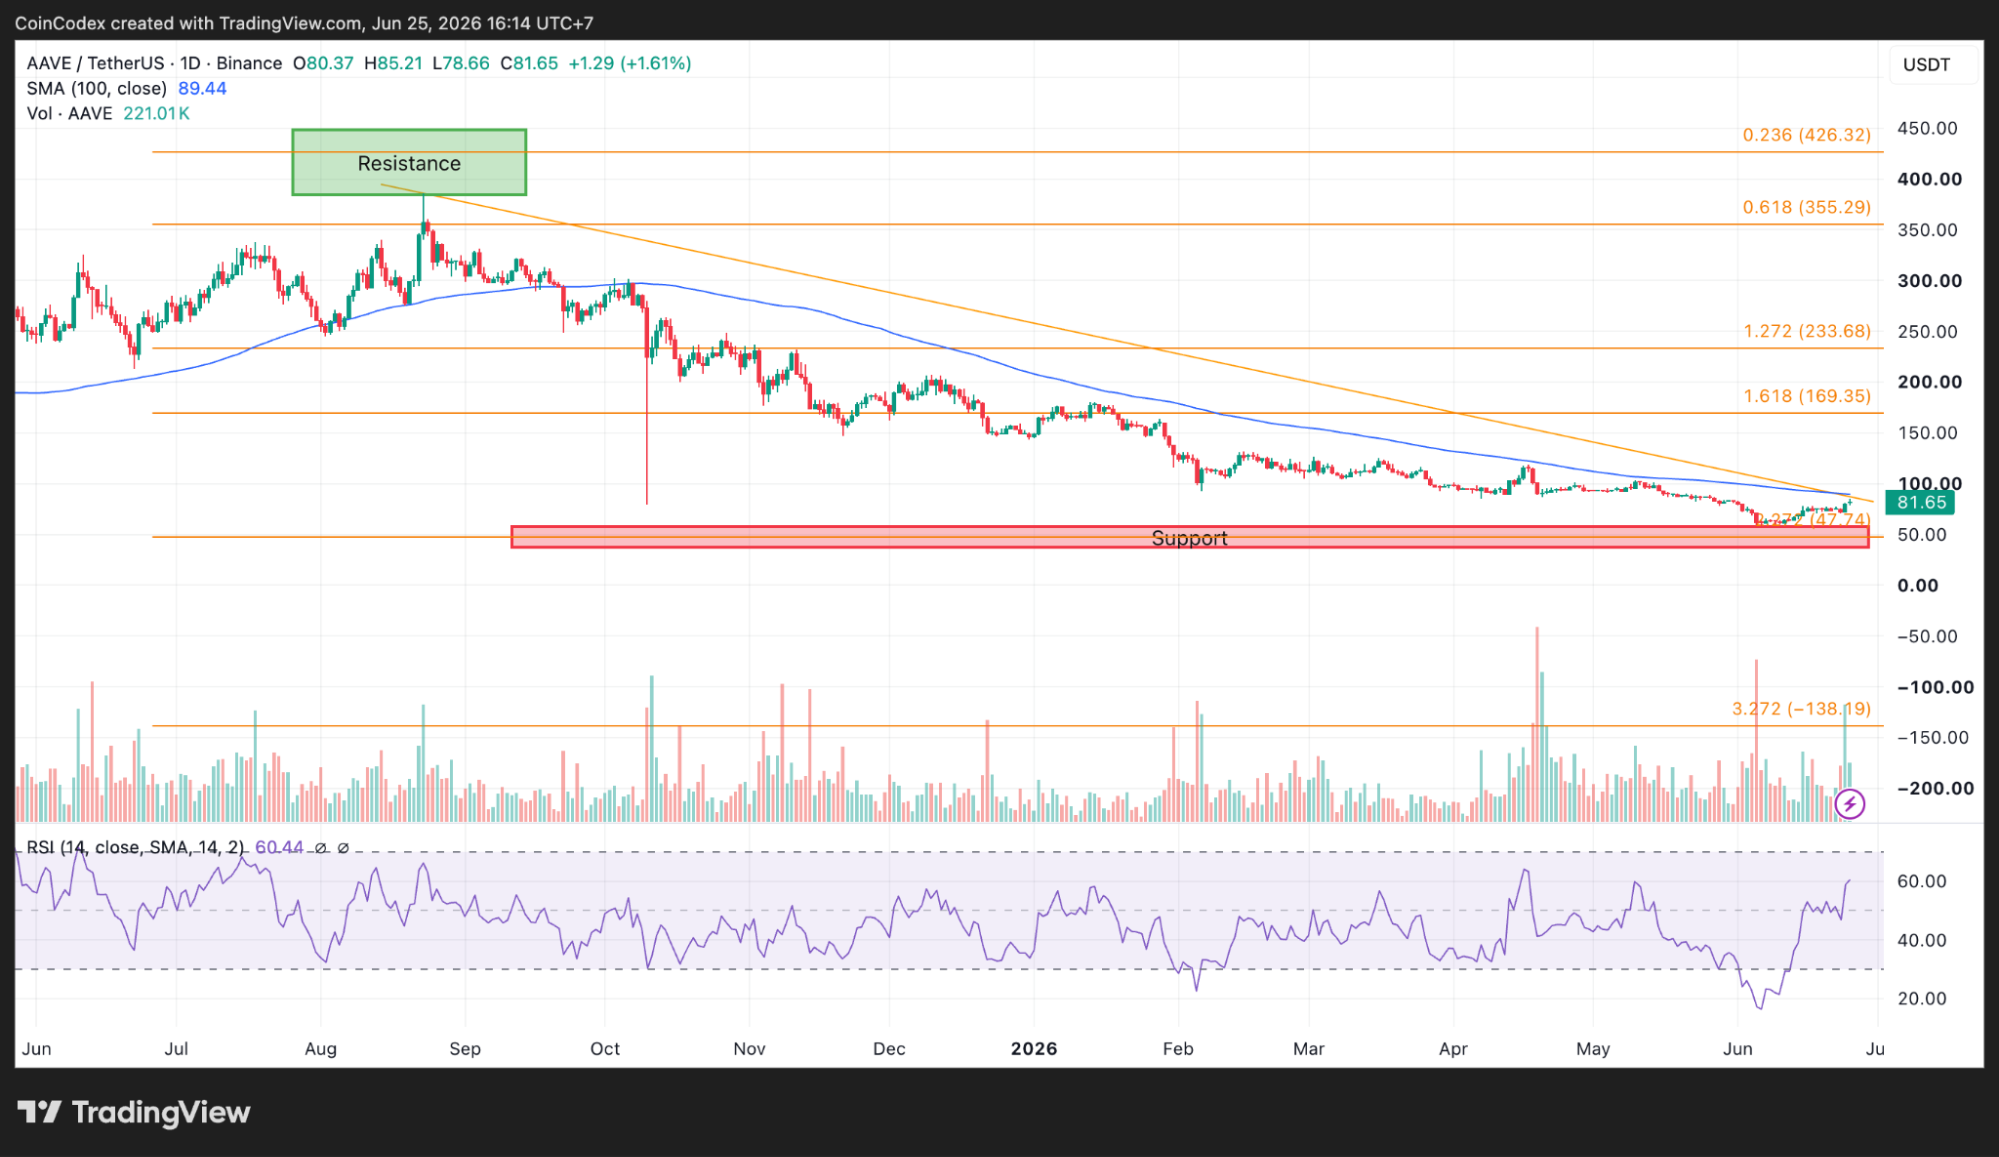
Daily AAVE chart analysis
However, on the daily chart, the picture looks a little bit more cautious. The AAVE price is still below the daily SMA 100 at $89.44, providing significant resistance in front of it. The value of daily RSI is 60.44 and shows positive momentum but does not confirm the uptrend yet. For many traders, the $89.44 level will be a decisive one for further recovery.
AAVE on-chain data leaves more questions than answers
We had a look at the available Glassnode data for Aave, but the numbers don’t provide a clear picture. The active address chart shows between 1 million and 1.06 million addresses, which would be unusually high for a DeFi lending protocol.
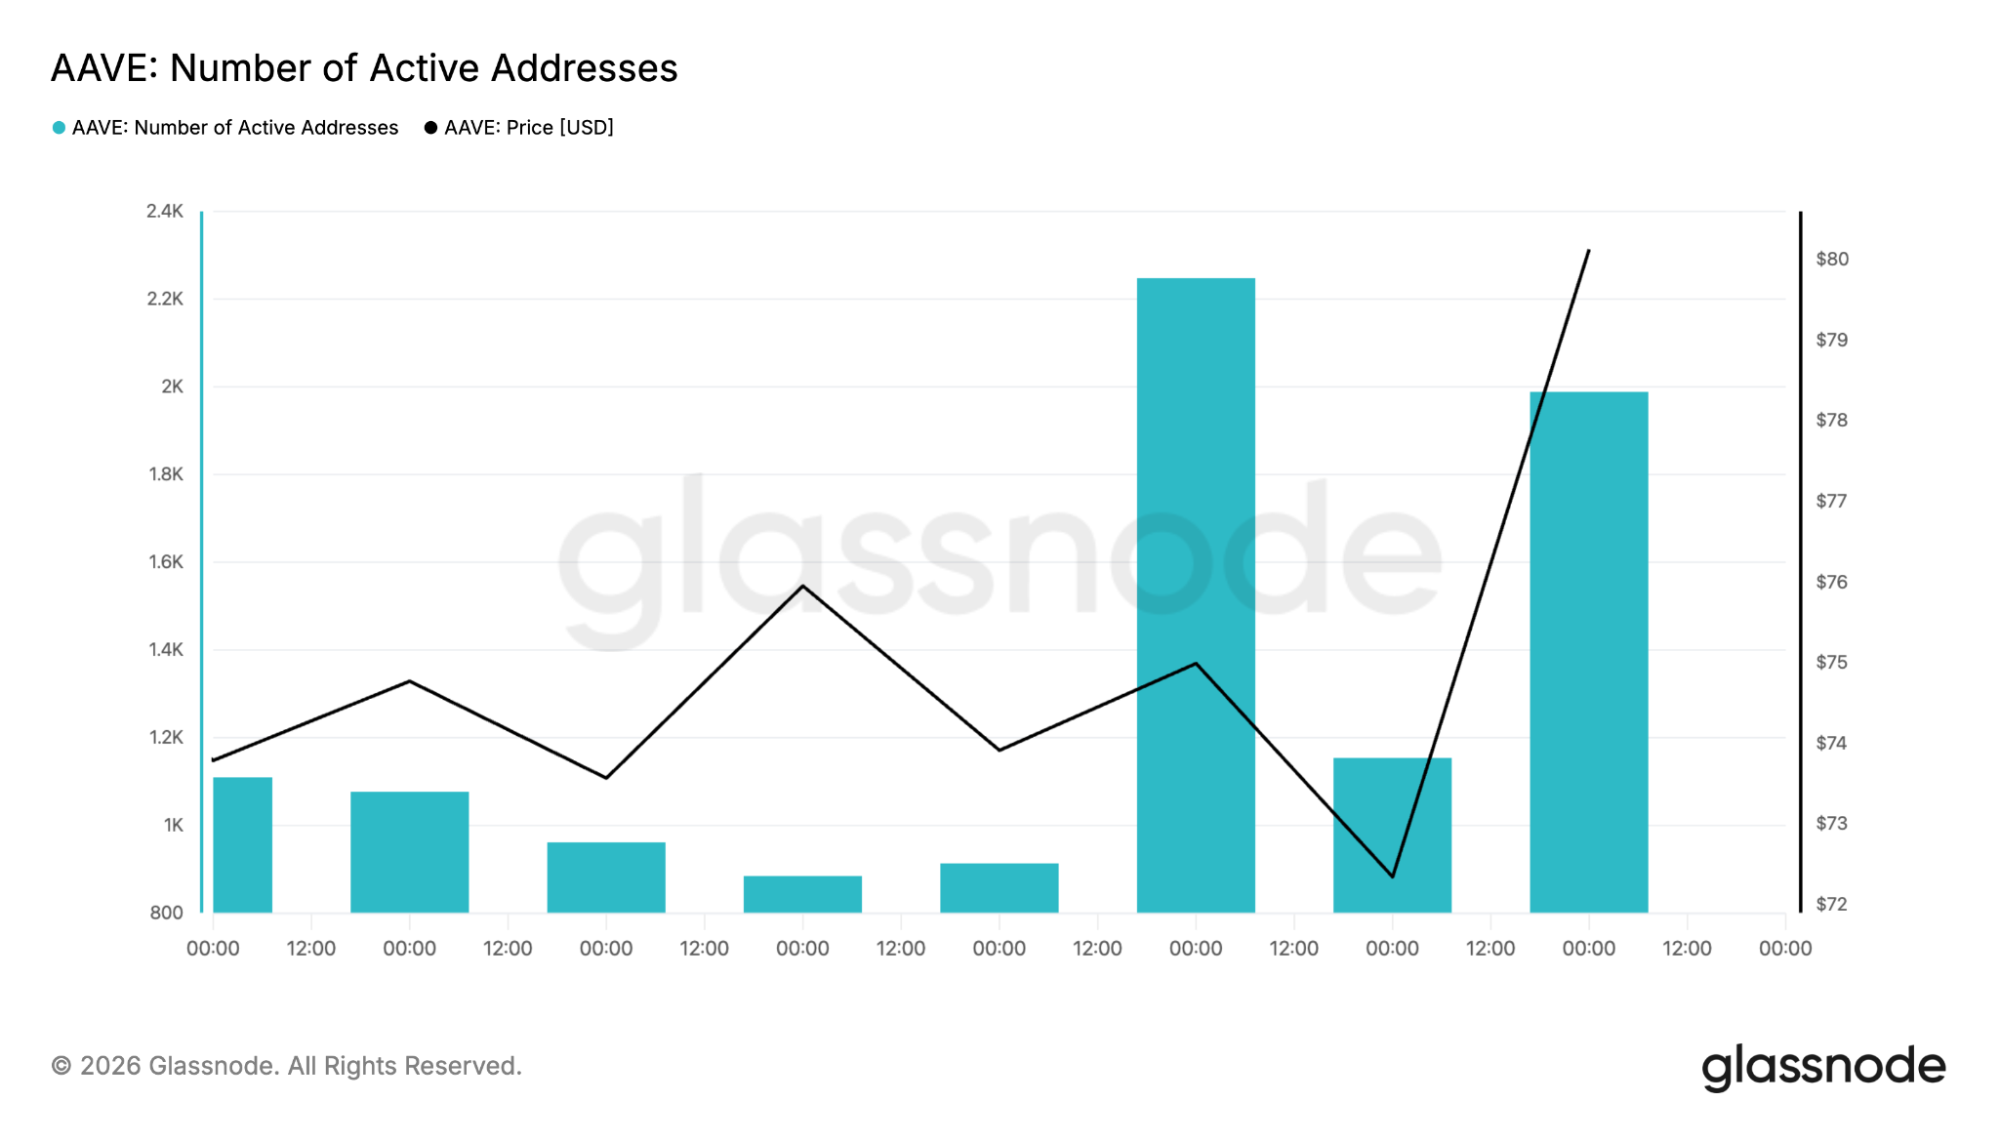
Aave has historically operated with activity measured in the thousands or tens of thousands of wallets, making these figures difficult to verify. The transfer data isn’t much clearer. The chart shows values between 7.5 and 8.5, but the units aren’t defined, making it impossible to determine the actual level of network activity.
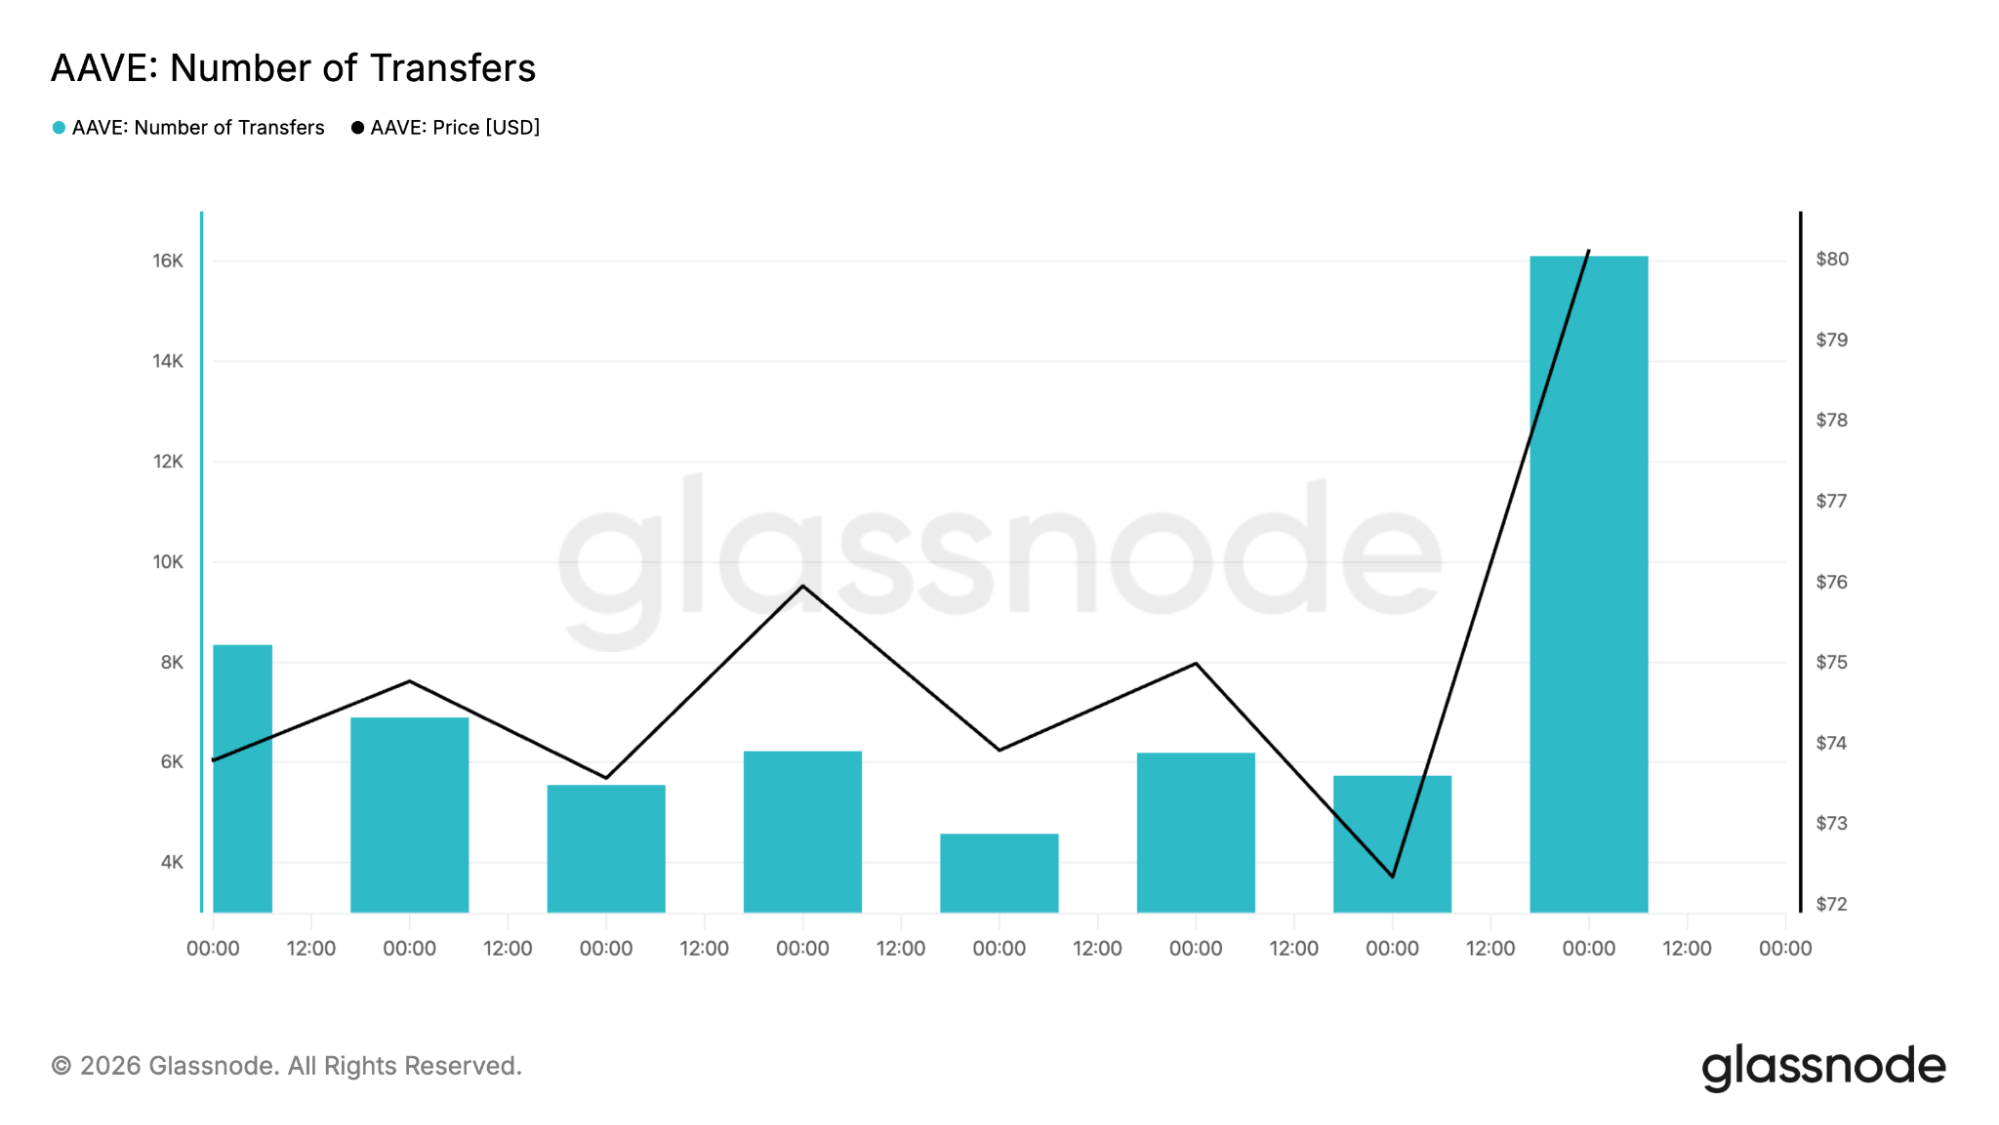
Because of these data issues, the on-chain metrics aren’t giving traders much to work with right now. Most of the attention remains on the AAVE price, protocol revenue growth, and the impact of upcoming upgrades like V4.
Institutions could become a bigger part of the AAVE story
One reason investors continue watching AAVE closely is its push into institutional finance. The protocol is developing Horizon, a permissioned platform focused on tokenized real-world asset lending.
Deposits on Horizon are already around $550 million, and supporters believe this market could become one of the largest growth opportunities in decentralized finance. That opportunity has attracted attention from traditional finance. Standard Chartered began coverage of Aave on June 24, 2026, and outlined a long-range price target of $3,500 by 2030.
That forecast depends heavily on the expansion of tokenized real-world assets and greater institutional participation across DeFi markets. Whether those expectations become reality will depend on adoption over the next several years.
Governance changes are giving investors more to watch
Aave is also entering a new phase from a protocol perspective. The community approved deployment of Aave V4, an upgrade designed to improve capital efficiency and strengthen risk management.
Another important development came through the “Aave Will Win” governance proposal approved in April 2026. Under that model, all revenue generated by Aave-branded products is directed to the DAO treasury.
For token holders, that creates a clearer relationship between protocol activity and value flowing back into the ecosystem. As protocol revenue grows, investors will likely pay closer attention to how those cash flows develop.
Even with those positive developments, risks remain. The KelpDAO exploit in April 2026 left approximately $196 million in bad debt across Aave markets. The broader exploit was valued at around $291 million.
The fallout was substantial. The figures above clearly indicate how fast confidence can shift following a major security incident, as deposits declined from approximately $44 billion to $23 billion while Aave’s market share of lending declined from 59% to 38%.
What could come next for AAVE?
The AAVE price seems to be caught up between strengthening technical performance and bigger issues concerning future growth. The near-term outlook still remains positive. The price is holding above important moving averages, the momentum is supportive, and buyers are holding on to an important support level.
The next challenge is resistance. The daily SMA 100 near $89.44 remains a major hurdle, followed by psychological levels around $100 and beyond. CoinCodex’s 1-month AAVE price prediction targets $107.89, indicating potential upside from current levels if AAVE can maintain support above key demand zones and break through resistance near its major moving averages.
Beyond the charts, investors are watching whether Horizon can attract institutional capital, whether V4 can improve protocol performance, and whether Aave can continue growing without facing another major security setback.
Source:: AAVE Price Prediction: Can Bulls Push AAVE Back Above $100?