Key highlights:
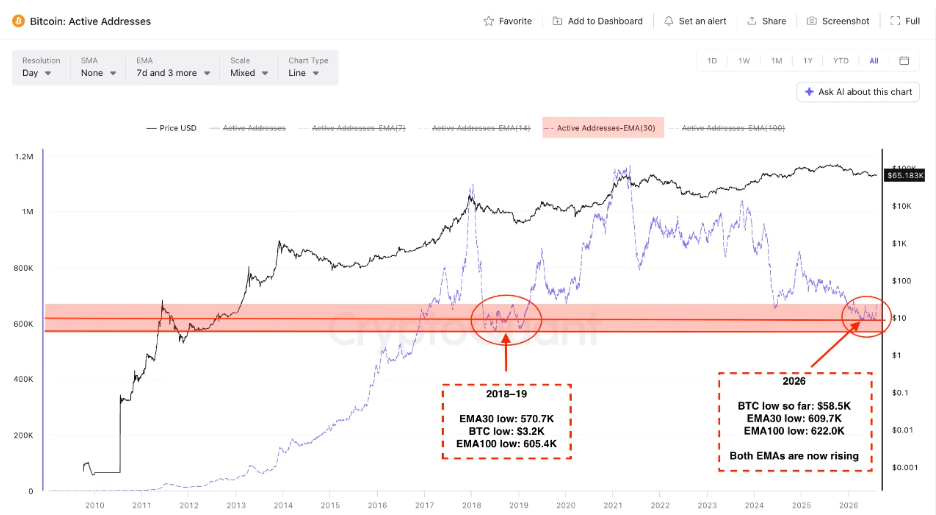
- Bitcoin’s 30-day active-address EMA fell to 609,688, approaching levels seen during the 2018-19 bear market
- Both the 30-day and 100-day activity averages have recovered from their July lows, while BTC remains above its $58,535 June low
- Bitcoin now faces a major supply zone between $65K and $67K, while declining Long-Term Holder balances continue to raise concerns over sustained accumulation
Bitcoin’s on-chain activity is showing signs of recovery after falling to levels last seen during the 2018-19 bear market, while BTC price action is simultaneously forming a potentially key bottoming structure.
The latest data shows that Bitcoin’s 30-day and 100-day active-address exponential moving averages (EMAs) have both recovered from their July lows.
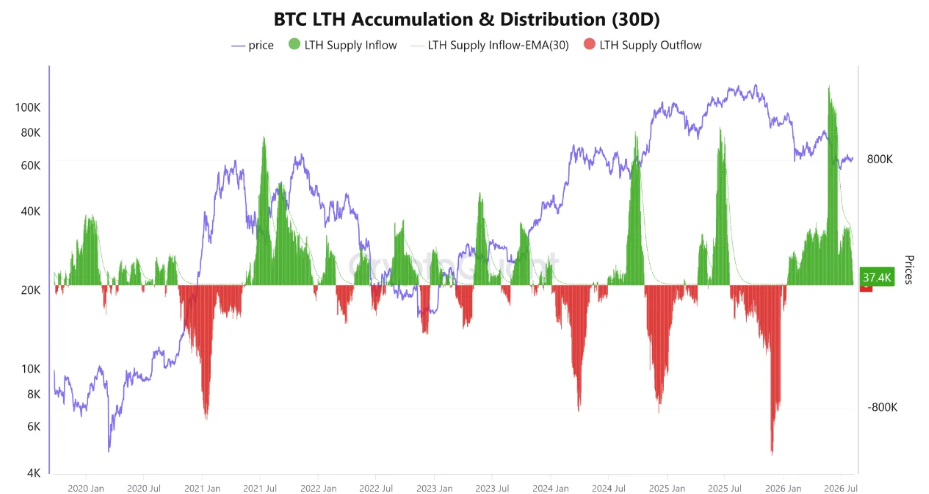
However, long-term holder balances continue to decline, suggesting that the network has not yet reached a clear accumulation phase.
At the same time, the Bitcoin price is now above $65K, with technical resistance between roughly $65K and $67K continuing to limit further bullish advancements..
Bitcoin activity rebounds from 2018-19 levels
Bitcoin’s active addresses have fallen dramatically compared with previous bull-market periods.
The 30-day active-address EMA dropped to 609,688 on July 19, compared with 570,710 in July 2018. The 100-day EMA fell to 621,957 on July 27, versus 605,433 in January 2019.
The comparison becomes more notable when Bitcoin’s 2018 bear-market bottom is considered.
When BTC reached its $3,206 cycle low on December 14, 2018, the 30-day and 100-day activity averages stood at 625,967 and 632,754, respectively.
However, these levels do not guarantee a price bottom. Similar activity readings also appeared during the 2016-17 bull-market advance.
The most important development is the recent recovery. Bitcoin’s price reached a 2026 low of $58,535 on June 30, while the 30-day and 100-day activity averages bottomed 19 and 27 days later.
By August 8, they had recovered to 664,764 and 640,603, respectively. That creates a potentially constructive setup: BTC remains above its June low while both activity measures remain above their July lows.
Long-term holders remain a major weakness
Despite the recovery in network activity, Bitcoin’s long-term holder balance has yet to confirm a strong accumulation cycle.
The LTH Balance continues to trend lower despite several spikes in LTH Supply Inflow. This indicates that coins entering the long-term holder cohort are still insufficient to offset the amount of BTC leaving it.
In practical terms, some long-term holders appear to be realizing profits or distributing coins into the market. That makes a sustained reversal in LTH Balance more important than isolated spikes in supply inflows.
BTC faces a major technical test at $65K
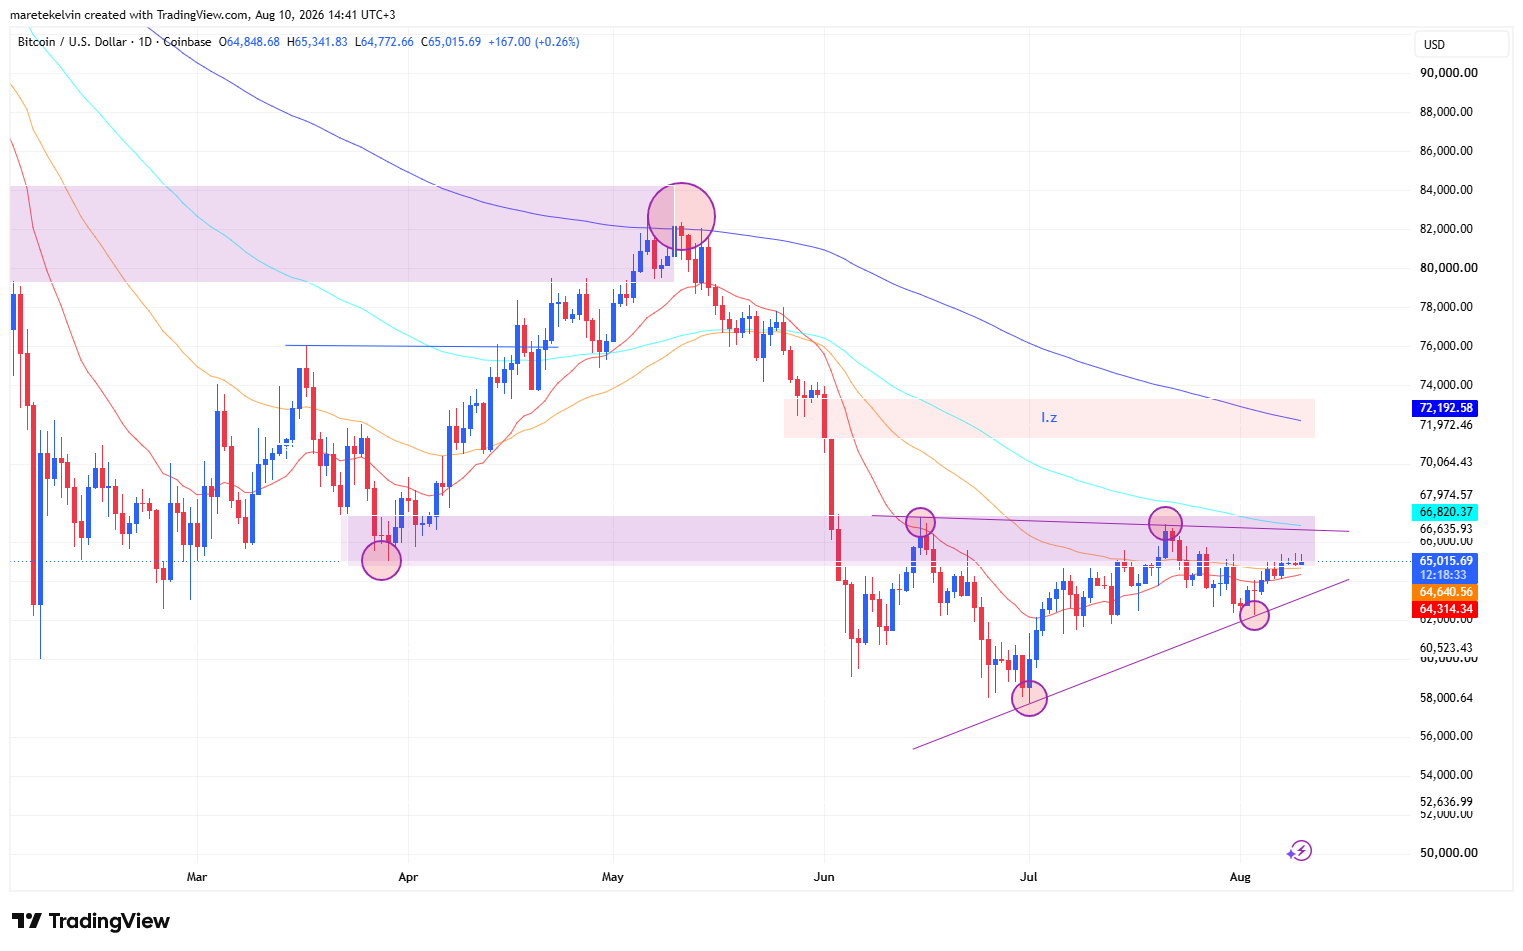
The technical structure is also becoming increasingly interesting. BTC is currently trading around $65,081 and has recovered above its short-term moving averages.
The daily chart shows price holding an ascending pennant trendline support that began around the June low near $58.5K. However, buyers continue to face a major supply zone between $65K and $67K.
The chart shows multiple rejection attempts around the supply zone, including recent tests that failed to produce a sustained breakout.
The broader structure also remains capped by higher moving averages, with the 100-day EMA near $66.8K and the 200-day EMA around $72.2K.
A decisive daily close above the $67K region would therefore strengthen the bullish case and expose the $72,000 area as the next major technical target.
Is Bitcoin building a bottom?
The data presents a mixed but increasingly constructive outlook.
Active addresses are recovering, exchange-deposit activity remains muted and BTC has held above its June low. Those developments support the possibility that the market is forming a bottom.
Yet declining LTH balances and persistent resistance between $65K and $67K prevent a confirmed bullish reversal.
For now, $609,688 and $621,957 remain important on-chain recovery thresholds, while $58.5K remains the critical price floor.
Bitcoin’s next decisive move could determine whether the current recovery develops into a broader trend reversal or another failed attempt to break the multi-month resistance zone.
Source:: Bitcoin Active Addresses Recover From 2018 Levels as BTC Reclaims $65K Again