Key highlights:
- The gold price is below key moving averages, with $4,200 now acting as a major support level
- Central banks bought an estimated 44 tonnes of gold in July, keeping physical demand elevated
- Gold could face $4,098 and $3,942 if $4,200 breaks, but oversold readings leave room for a rebound
Gold has entered the new week under pressure, and veteran chart analyst Aksel Kibar believes the technical picture has become more concerning. In a recent post, Kibar noted that the gold price has fallen back below its 200-day average, a level many traders use to gauge the long-term trend. He also pointed to $4,200 as the final major support zone that bulls need to defend.
At the same time, the broader backdrop for the gold price remains far from bearish. Data shared by The Kobeissi Letter shows that central banks continue buying gold at a pace well above historical norms. That creates an interesting situation where strong long-term demand is colliding with weak short-term price action.
The result is a market that appears divided between supportive fundamentals and bearish technical signals.
Central Banks continue to accumulate gold
One of the biggest talking points in the gold market right now is the scale of central bank buying. The Kobeissi Letter cited Goldman Sachs estimates showing that central banks purchased 44 tonnes of gold in July.
That figure is 158% above the pre-2022 average of 17 tonnes per month. The data also shows the three-month average of purchases climbing to roughly 91-95 tonnes, close to the strongest levels recorded since mid-2025.
The longer-term trend looks equally impressive. The 12-month moving average of central bank purchases stands near 58 tonnes, compared to a historical average of around 20 tonnes before 2022.
What makes this data even more interesting is the gap between official figures and estimated purchases. Official central bank buying totaled 23 tonnes in July, about 21 tonnes below Goldman Sachs’ estimate. That gap has fueled speculation that actual demand could be much stronger than publicly reported.
For the gold price, this steady flow of buying provides an important source of support. Central banks are not trading for short-term gains. They buy gold to diversify reserves and reduce reliance on traditional reserve assets.
Why gold is falling despite strong demand
If central banks are buying at such a strong pace, why is the gold price struggling? Part of the answer comes from the macroeconomic environment. Bloomberg reported that gold came under pressure after concerns surrounding the Strait of Hormuz kept energy prices elevated.
Higher energy costs can fuel inflation, which in turn increases the likelihood that the Federal Reserve keeps interest rates higher for longer. Higher rates tend to weigh on gold because the metal does not generate income. When bond yields and cash returns rise, investors often have more alternatives for parking capital. That pressure has been visible in the charts.
Gold technical signals remain bearish
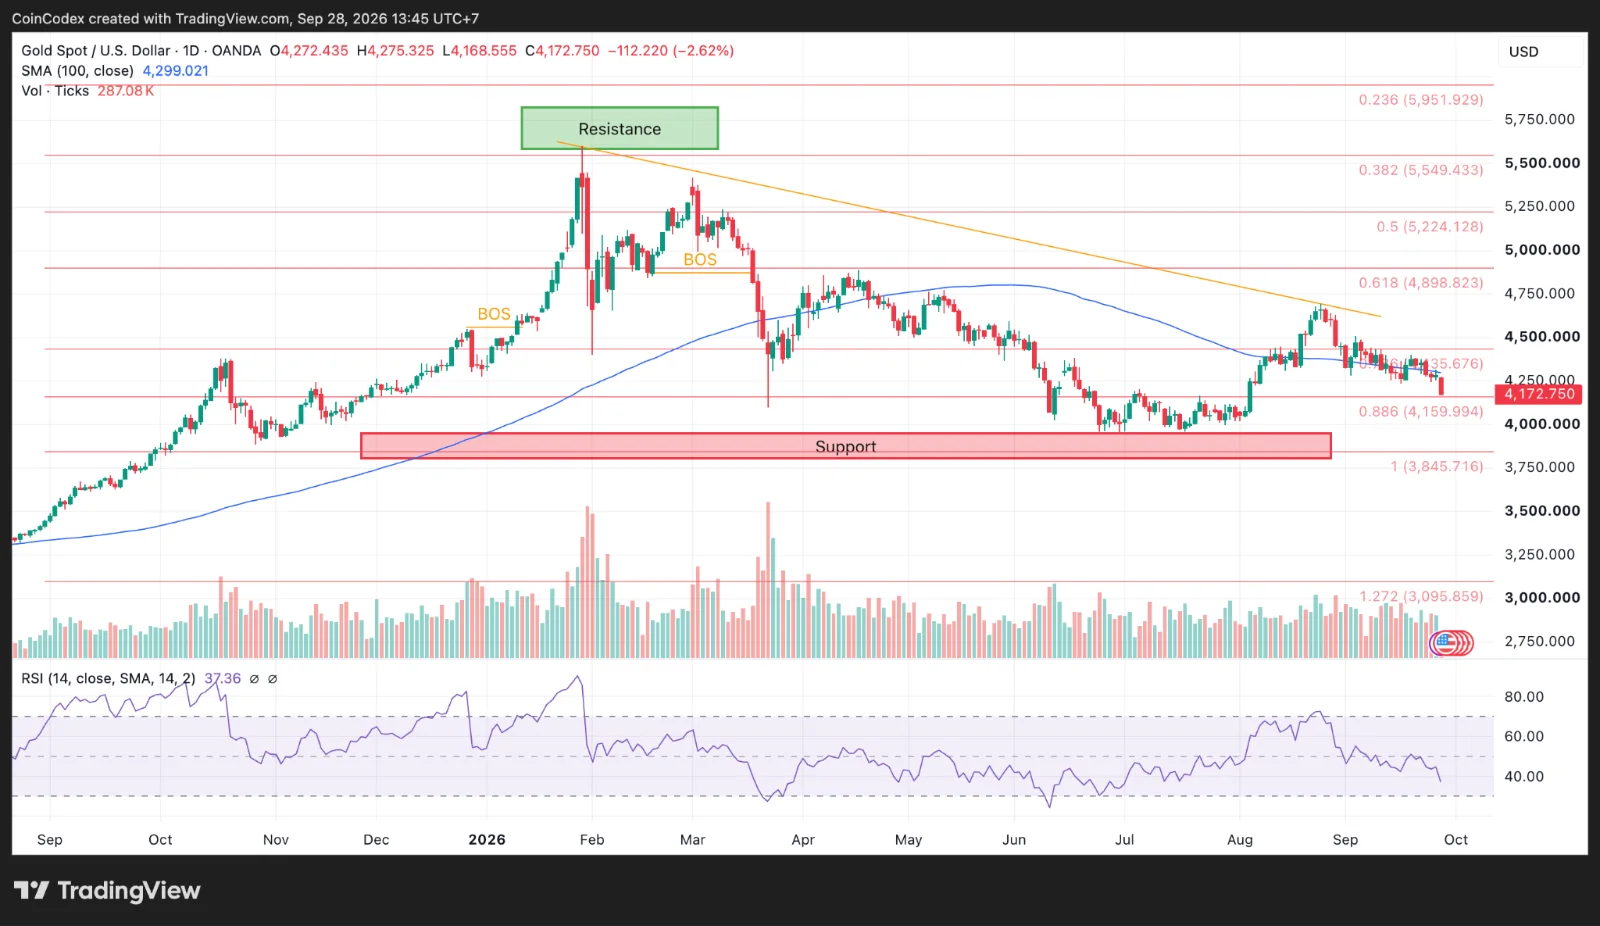
We had a look at the daily gold chart, and the trend remains under pressure. The gold price is trading near $4,313, below both the 200-day moving average and the important $4,380 resistance level. The market has also been printing lower highs and lower lows since peaking near $5,598 earlier in 2026.
Daily gold chart analysis
Those are classic characteristics of a downtrend. The next major support level sits at $4,200. If sellers push the gold price below that level, the next areas to watch are $4,098, $3,942, and $3,886.
For buyers to regain control, the gold price would need to reclaim $4,380 first. Beyond that, resistance levels stand at $4,510, $4,900, and eventually the previous high near $5,598. As long as the gold price remains below the major moving averages, technical traders are likely to stay cautious.
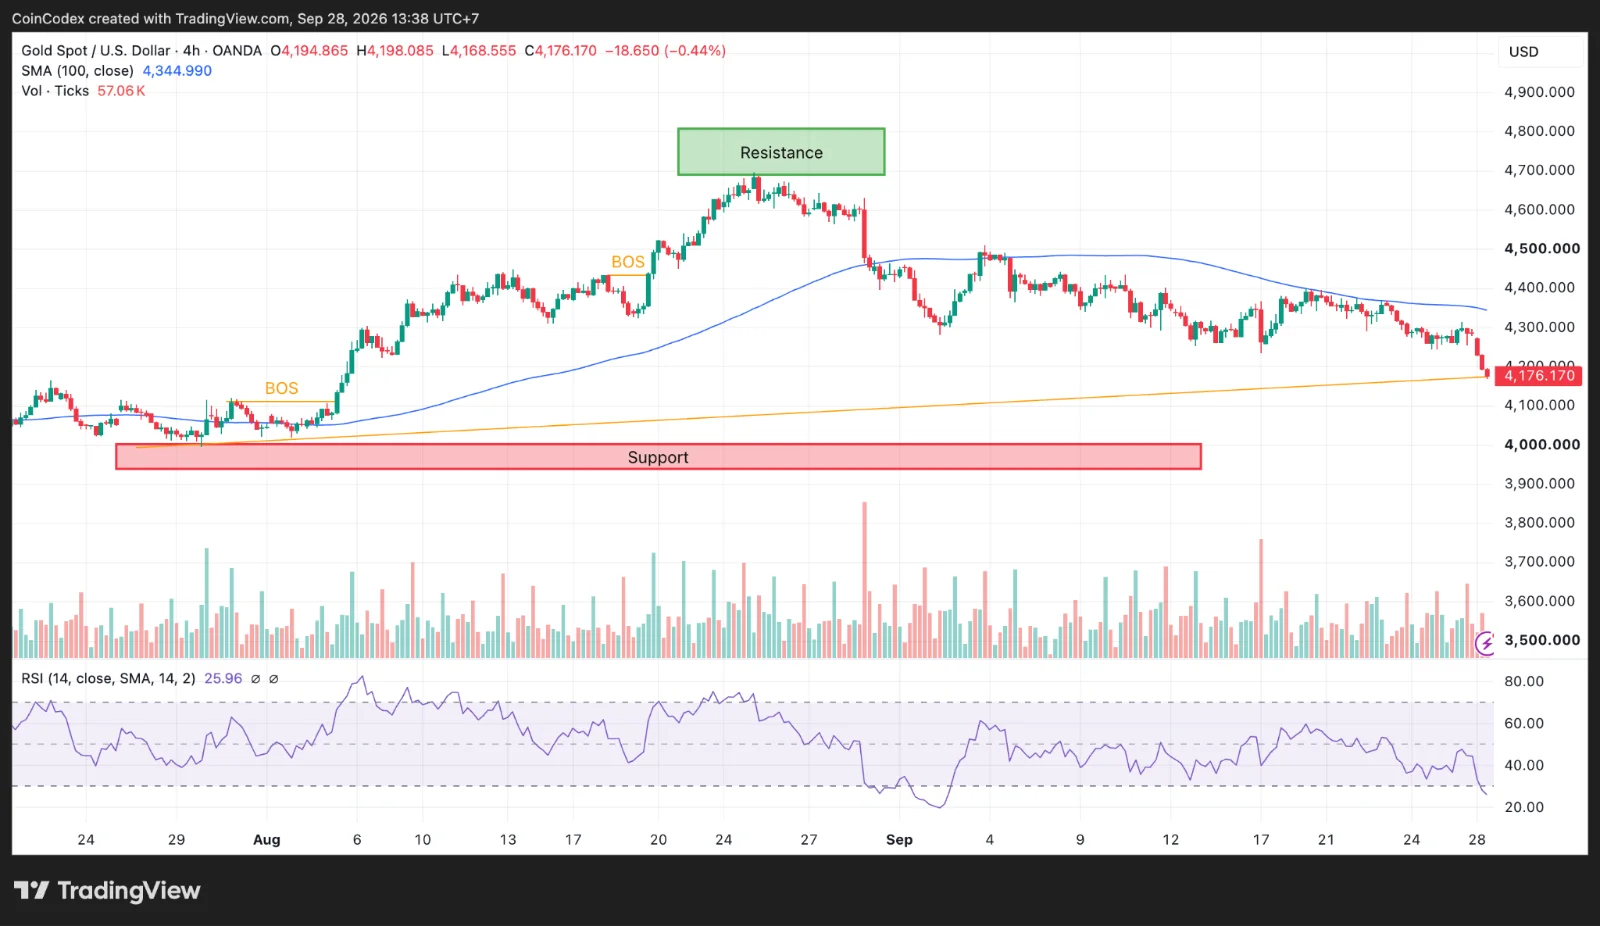
4-hour gold chart analysis
Even though the broader trend remains bearish, some indicators show that selling pressure may be becoming stretched. We had a look at the 4-hour chart, where the gold price trades around $4,176. The 100-period moving average sits much higher at $4,344.99, confirming that bears still have the upper hand.
However, the 4-hour RSI has dropped to 25.96. Readings below 30 are generally considered oversold and often appear before relief rallies. The daily RSI is also sitting at 37.36, another sign that momentum has weakened considerably. This does not automatically mean the gold price is ready to reverse higher, but it does increase the chances of a short-term recovery if support levels continue to hold.
Where could the gold price go next?
The next move for the gold price will likely depend on what happens around the $4,100-$4,200 support zone. If buyers defend that area, the gold price could rebound toward $4,300, followed by resistance near $4,344 and $4,435. A stronger recovery could eventually bring $4,898 back into focus.
If support fails, the outlook becomes much more bearish. A break below $4,100 could open the door to $4,000 and potentially $3,845. For now, the gold price remains caught between two powerful forces.
CoinCodex’s 1-month gold price forecast places the gold price at $4,367.02, implying that analysts expect a modest recovery from current levels over the coming weeks as the market attempts to stabilize after its recent decline below key moving averages.
Central banks continue buying at historically elevated levels, providing strong long-term demand. At the same time, rising rate concerns and bearish chart patterns continue weighing on price action. The battle between those forces is likely to determine where the gold price heads next.
Source:: Gold Price Analysis: Record Central Bank Buying Meets Growing Bearish Pressure