Key highlights:
- Bitcoin has slipped below the $60,000 level for the third time since February as ETF investors continue pulling capital from the market.
- Exchange withdrawal activity has slowed significantly during the recent sell-off, suggesting conviction among buyers may be weakening.
- Despite the broader bearish sentiment, whale inflows to exchanges have declined sharply, indicating large holders are not rushing to sell.
Bitcoin ETF outflows fuel latest drop below $60K
Bitcoin prices have fallen below the $60,000 psychological support level for the third time since February, extending a week-long correction that has weighed heavily on market sentiment.
Despite metals climbing over the current geopolitical escalations and developments. BTC, a token once preferred as a commodity to store value, is deviating significantly. The correlation coefficient data indicate an increased deviation between Gold and BTC.
Why are BTC prices down?
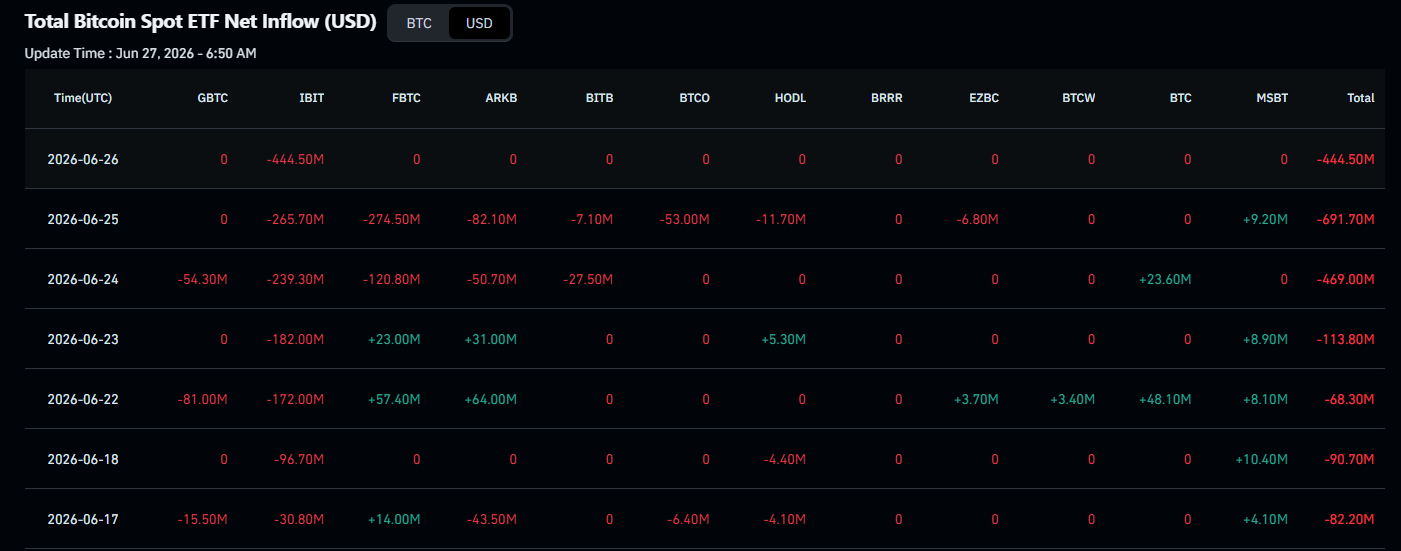
The decline coincides with persistent selling pressure across U.S. spot Bitcoin ETFs. Over the last week, most major funds have recorded net outflows, signaling reduced institutional appetite amid the ongoing market uncertainty.
ETF flows have become one of the most important drivers of Bitcoin’s short-term price action since the products launched. Consequently, sustained outflows often translate into weaker spot demand and increased downside pressure.
Exchange flow data paints a mixed picture
On-chain data suggests investors are becoming increasingly cautious.
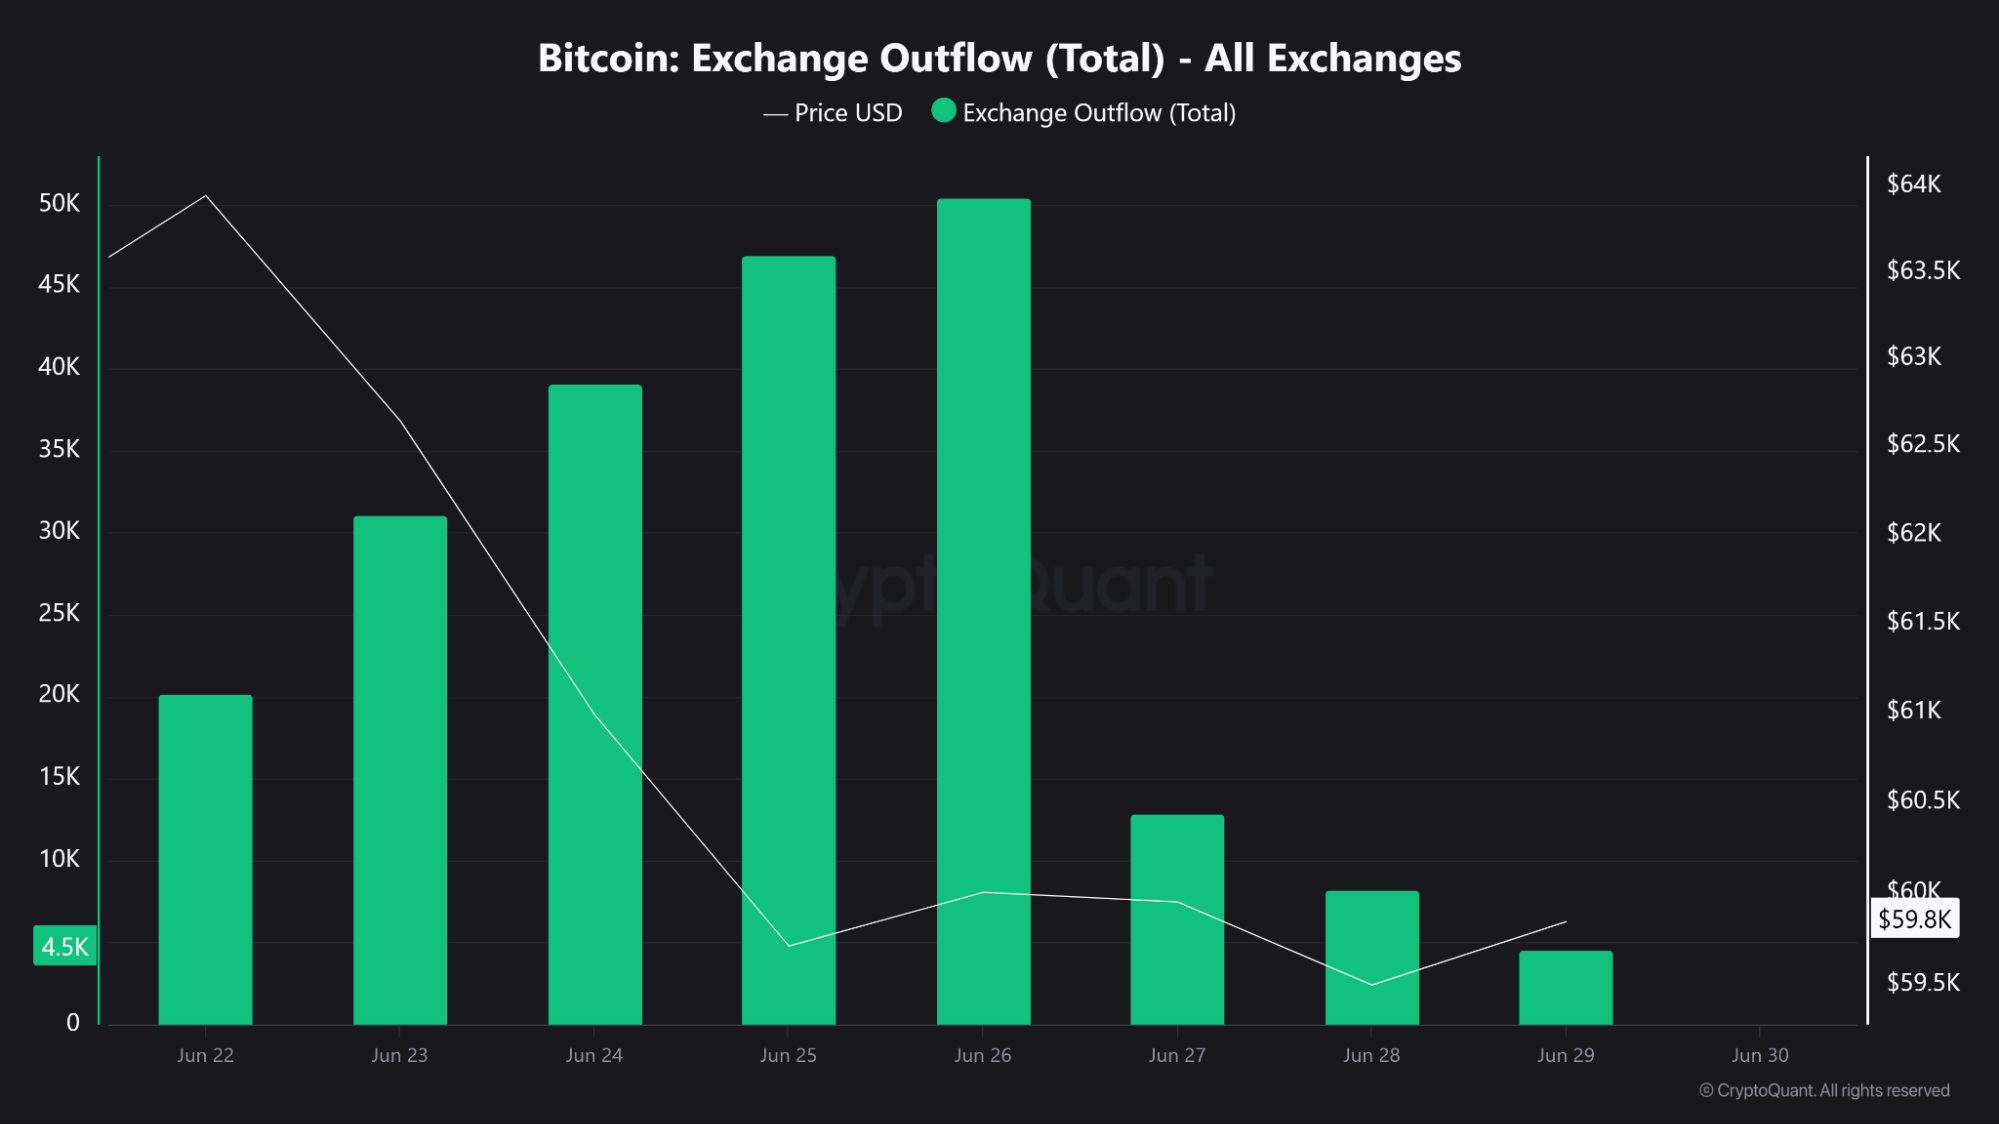
Bitcoin outflows from exchanges have contracted significantly over the last three trading sessions. While coins leaving exchanges are generally viewed as a bullish signal because they reduce immediate selling pressure, the recent slowdown suggests fewer investors are moving assets into long-term storage.
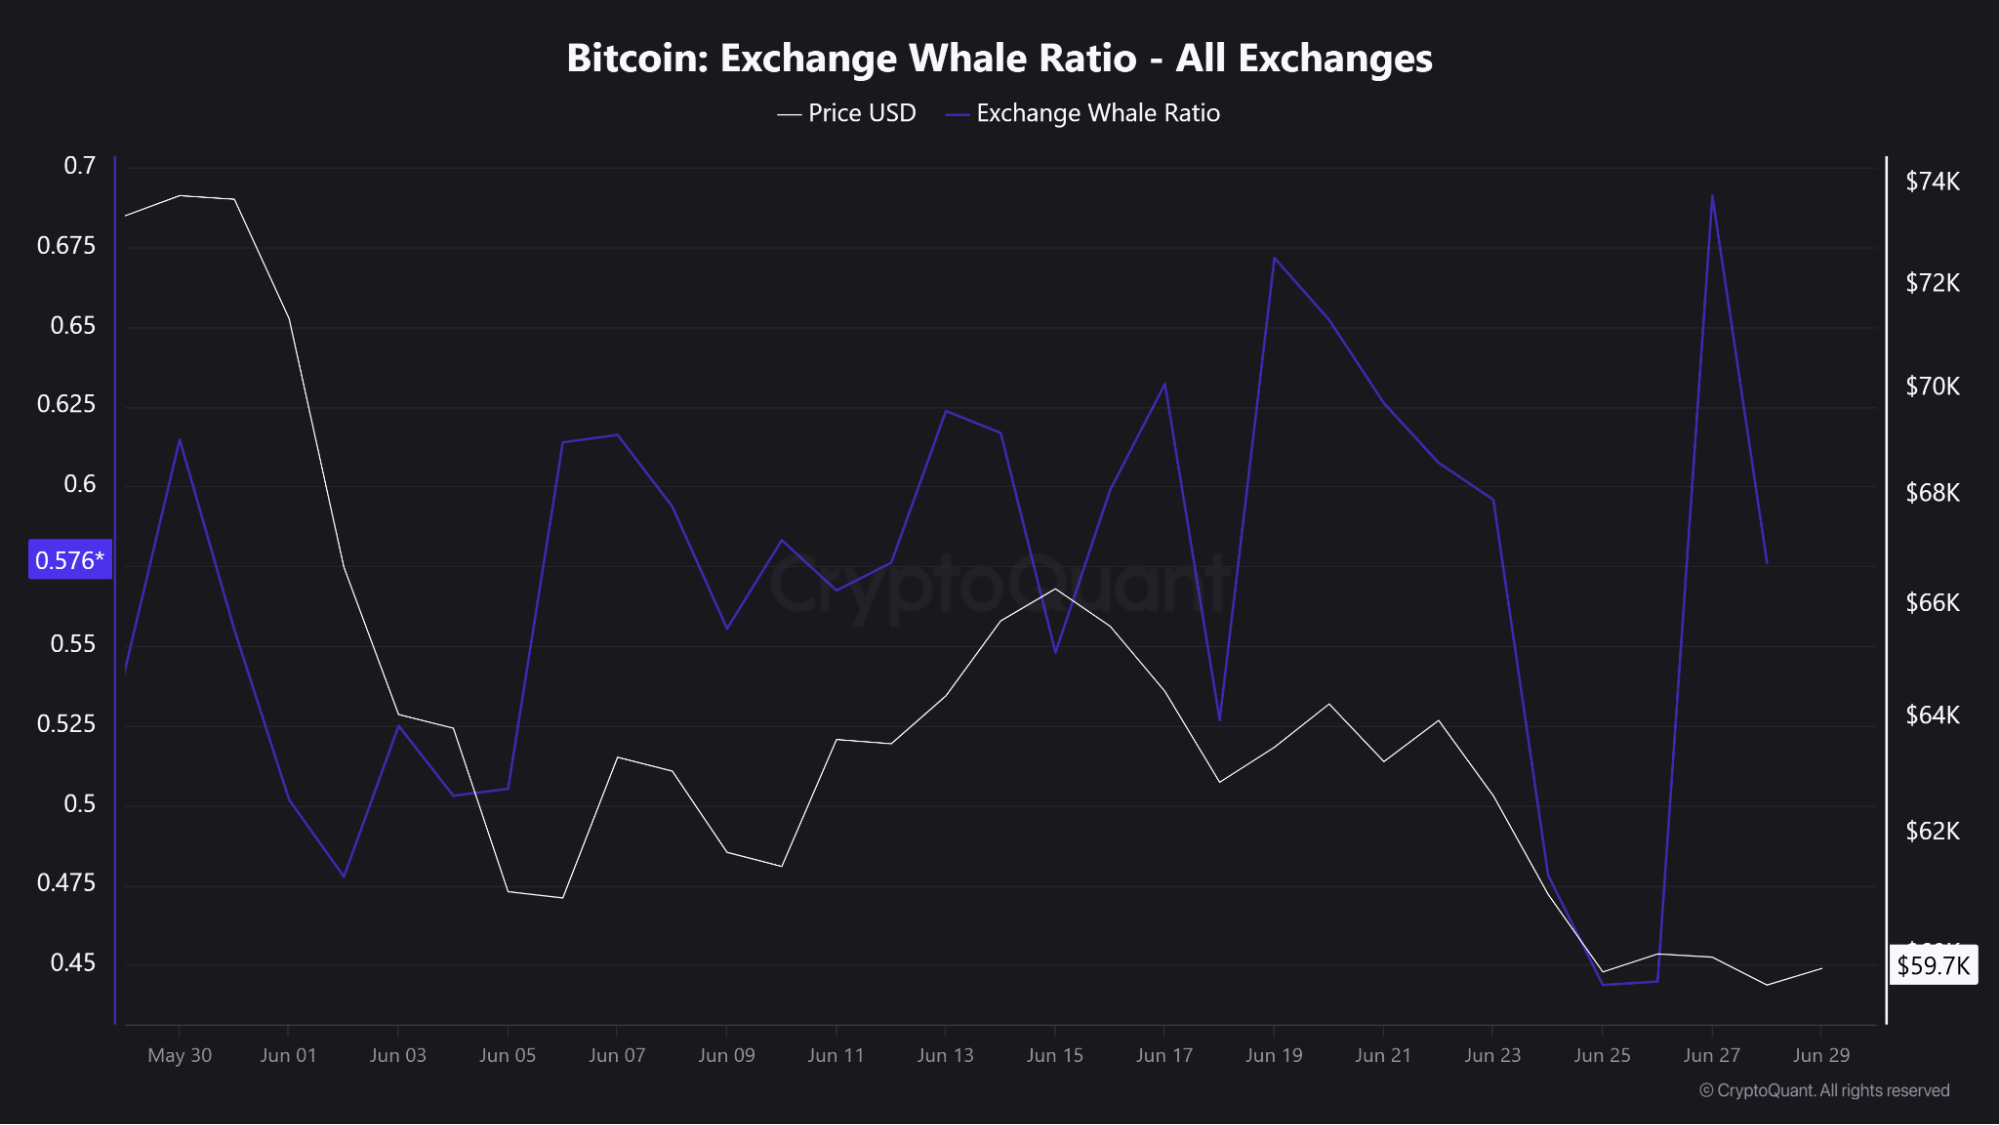
However, whale activity tells a different story.
The proportion of large-holder inflows into exchanges has dropped sharply during the same period. This divergence indicates that major investors are not contributing significantly to the current selloff.
Instead, much of the exchange activity appears to be coming from smaller holders, raising the possibility that retail traders are driving the recent wave of profit-taking and panic selling while whales continue holding their positions.
The trend aligns with previous corrections where institutional and whale investors accumulated during periods of heightened retail fear.
Bears remain in control of the market structure
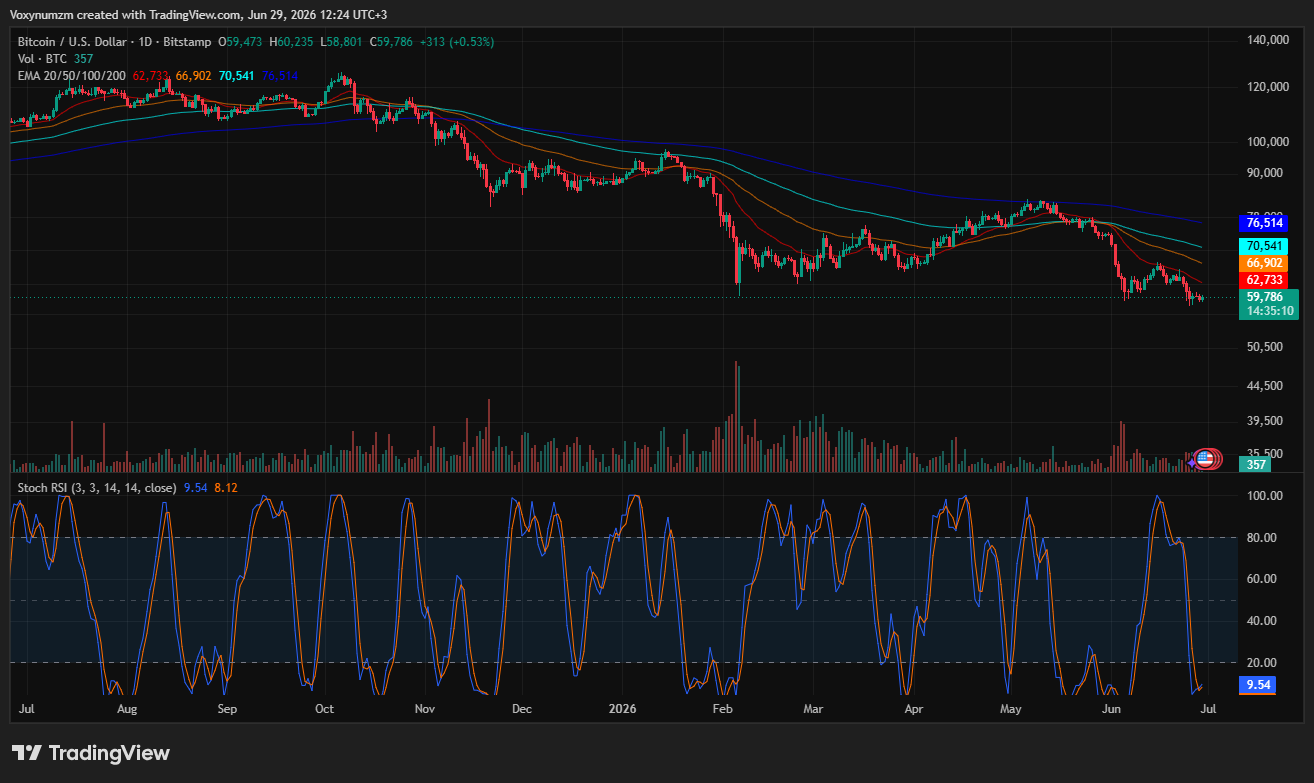
From a technical perspective, Bitcoin remains firmly under pressure.
The recent decline has pushed BTC below several key exponential moving averages, confirming that sellers currently control the broader market structure.
However, a more consistent bearish momentum will be key to breaking past the current support zone. The token volume is missing and its Stochastic Relative Strength Index is now in an oversold zone.
In most cases, reversals materialize when the Stochastic RSI is testing those key points of demand.
If BTC current bearish run is sustained, the next critical level sits around $52,000, which represents a major support zone and one of the last significant buyer strongholds before a deeper correction becomes likely.
What’s next for BTC?
According to CoinCodex’s short-term Bitcoin price prediction, BTC is expected to trade in the $84,310–$91,226 range between July and September 2026, with the base-case outlook suggesting a gradual easing from around $89,769 in July to $86,801 by September while still remaining well above current levels.
As it stands, the sharp decline in whale exchange inflows offers bulls a potential reason for optimism. While ETF investors continue withdrawing capital, large holders appear reluctant to sell into weakness. That divergence could become an important signal if Bitcoin attempts to stabilize in the coming sessions.
Source:: Bitcoin Falls Below $60K Again as ETF Selling Weighs on the Market