Key highlights:
Solana has been grinding lower for weeks, sliding down from the February highs near $110 all the way down to the $85 zone. It’s been a slow bleed, the kind that doesn’t make headlines but quietly erodes confidence. Every time it looks like it might be time for a bounce, sellers step back in and push it lower.
Ali Charts pointed out that the TD Sequential indicator just flashed a buy signal on the 4-hour chart. If you follow this indicator, you know that’s a signal worth paying attention to. It’s not a guarantee, but it’s definitely a data point.
The indicator that called the last bounce
Ali Charts is known for calling these setups. The TD Sequential isn’t a magic wand, but it has a track record of marking turning points. The fact that it’s flashing a buy on the 4-hour chart, at a time when the SOL price is oversold and network activity is holding steady, makes it worth paying attention to.
The last time this setup appeared, the SOL price bounced from $80 to $100 in weeks. No guarantee it repeats, but the confluence makes it interesting. It’s not just the TD Sequential flashing a buy.
TD Sequential flashes a buy signal on Solana $SOL, suggesting a rebound. pic.twitter.com/NVwoeMgEXu
— Ali Charts (@alicharts) March 27, 2026
The RSI is oversold. Price is sitting at a support zone that’s held multiple times. On-chain data shows network activity is steady. Multiple indicators pointing the same way doesn’t guarantee a bounce, but the risk-reward starts to look better.
The downside is defined. If the signal fails, the SOL price likely breaks below $84 toward $80. If it works, upside is $89 first, then $93 to $95, and eventually $100. That’s a solid risk-reward. The market decides. But the setup is there, and Ali Charts has a track record of getting these right.
What the SOL 4-hour chart is showing
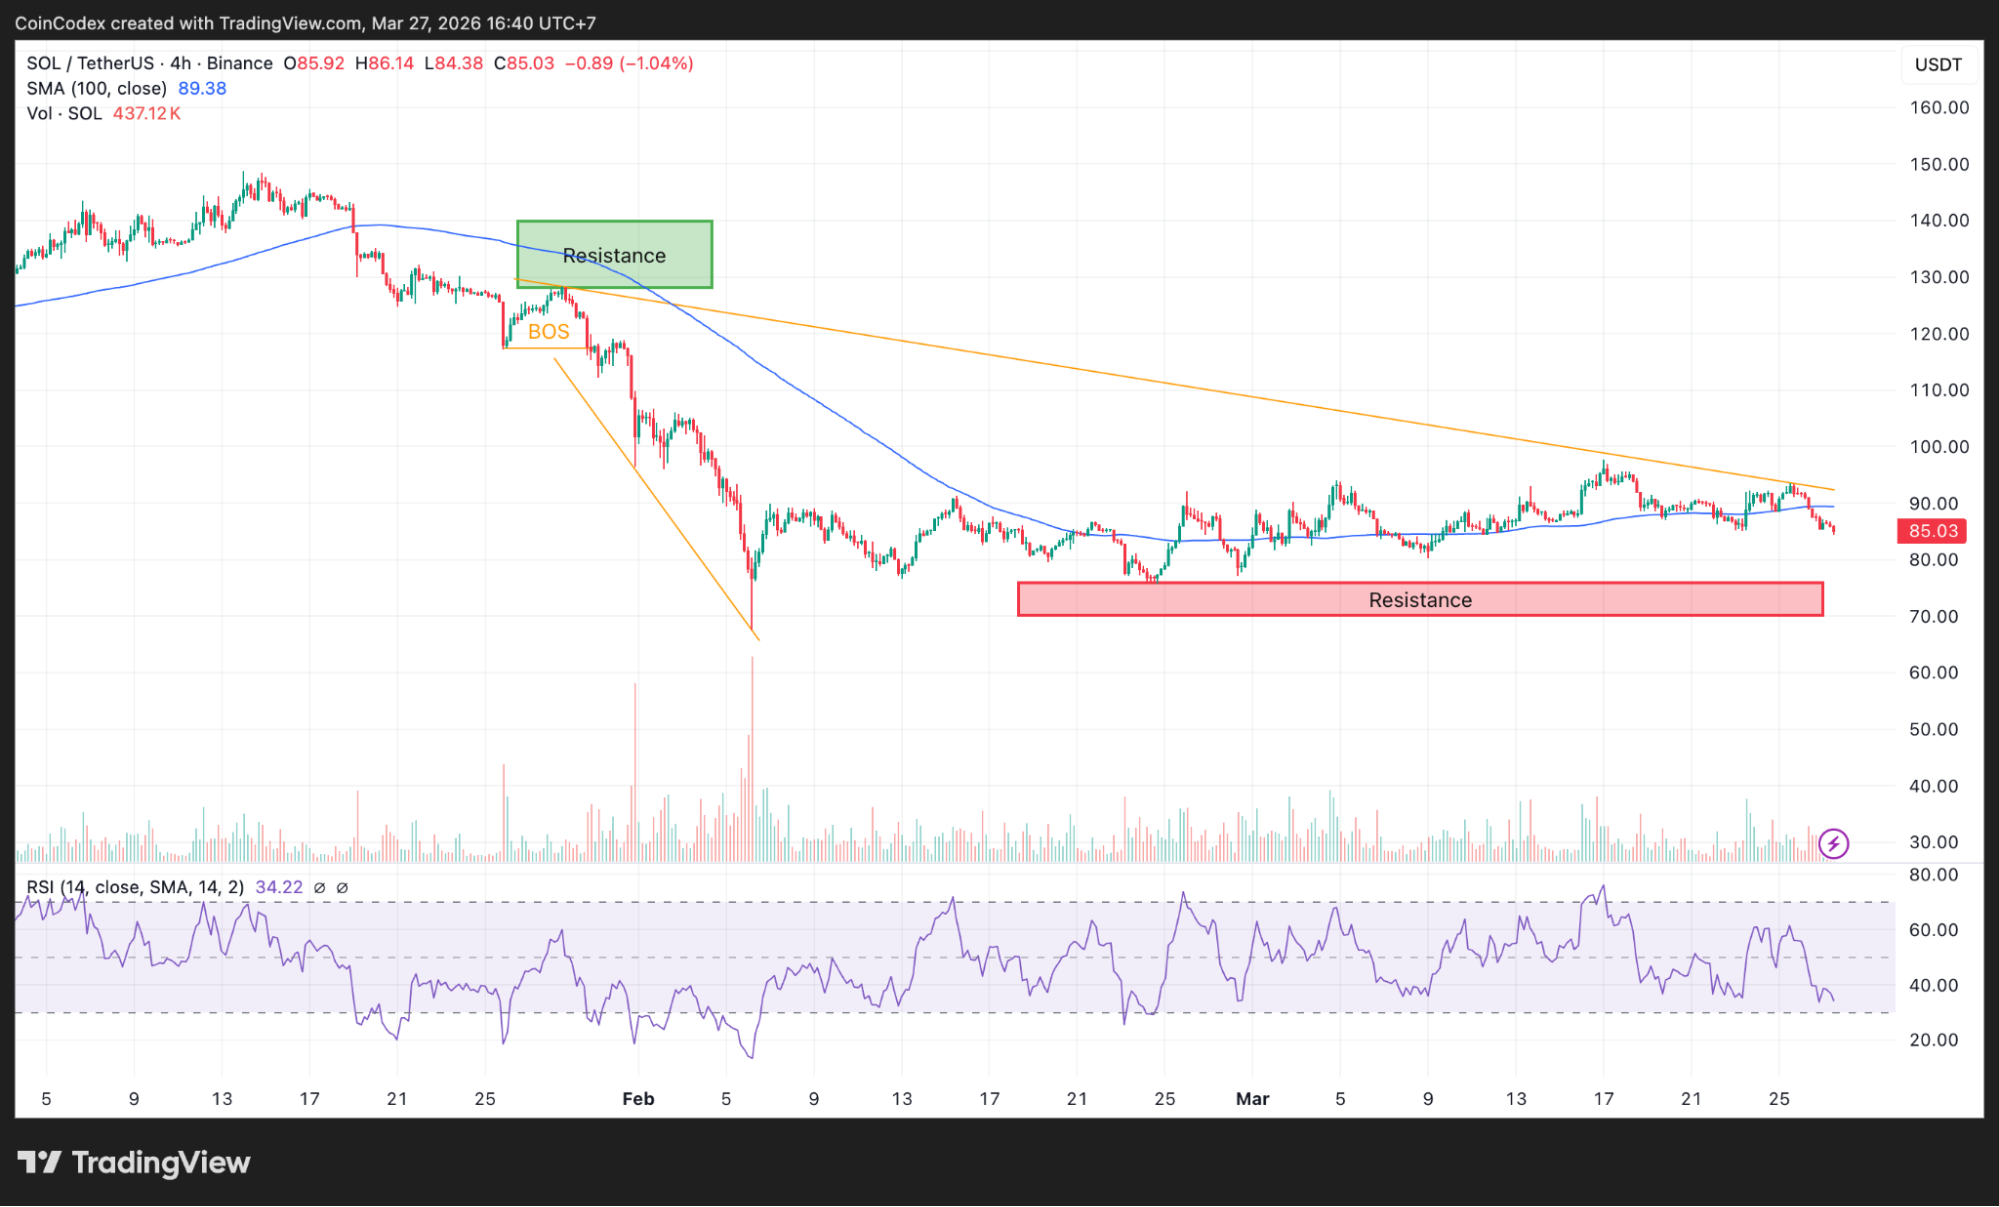
If you take a look at the 4-hour chart, the picture is pretty clear. The SOL price is sitting at $85.03, down a bit on the session, but the structure is starting to shift. The TD Sequential, which counts price bars to identify exhaustion points, has completed its count and flashed a “9” setup. That’s the buy signal.
What makes this interesting is the context. The SOL price has been making lower lows for weeks, but the TD Sequential is suggesting that this downtrend might be running out of steam. The last time this indicator flashed a buy on this timeframe, the SOL price bounced hard.
4-hour SOL price chart analysis.
The RSI on the 4-hour is sitting at 34.22, which is oversold territory. That doesn’t guarantee a bounce. Nothing does, but it does indicate that the selling pressure might be running out of gas.
The 100-period SMA is up at $89.38, which is now acting as resistance. So the first real test is whether Solana can reclaim that level. If it clears that, the structure starts to look a lot better.
Volume on this timeframe is 437,000 SOL, which is light, but that’s typical during consolidation phases. The real test will come when the SOL price tries to push through resistance.
Solana daily chart tells the bigger story
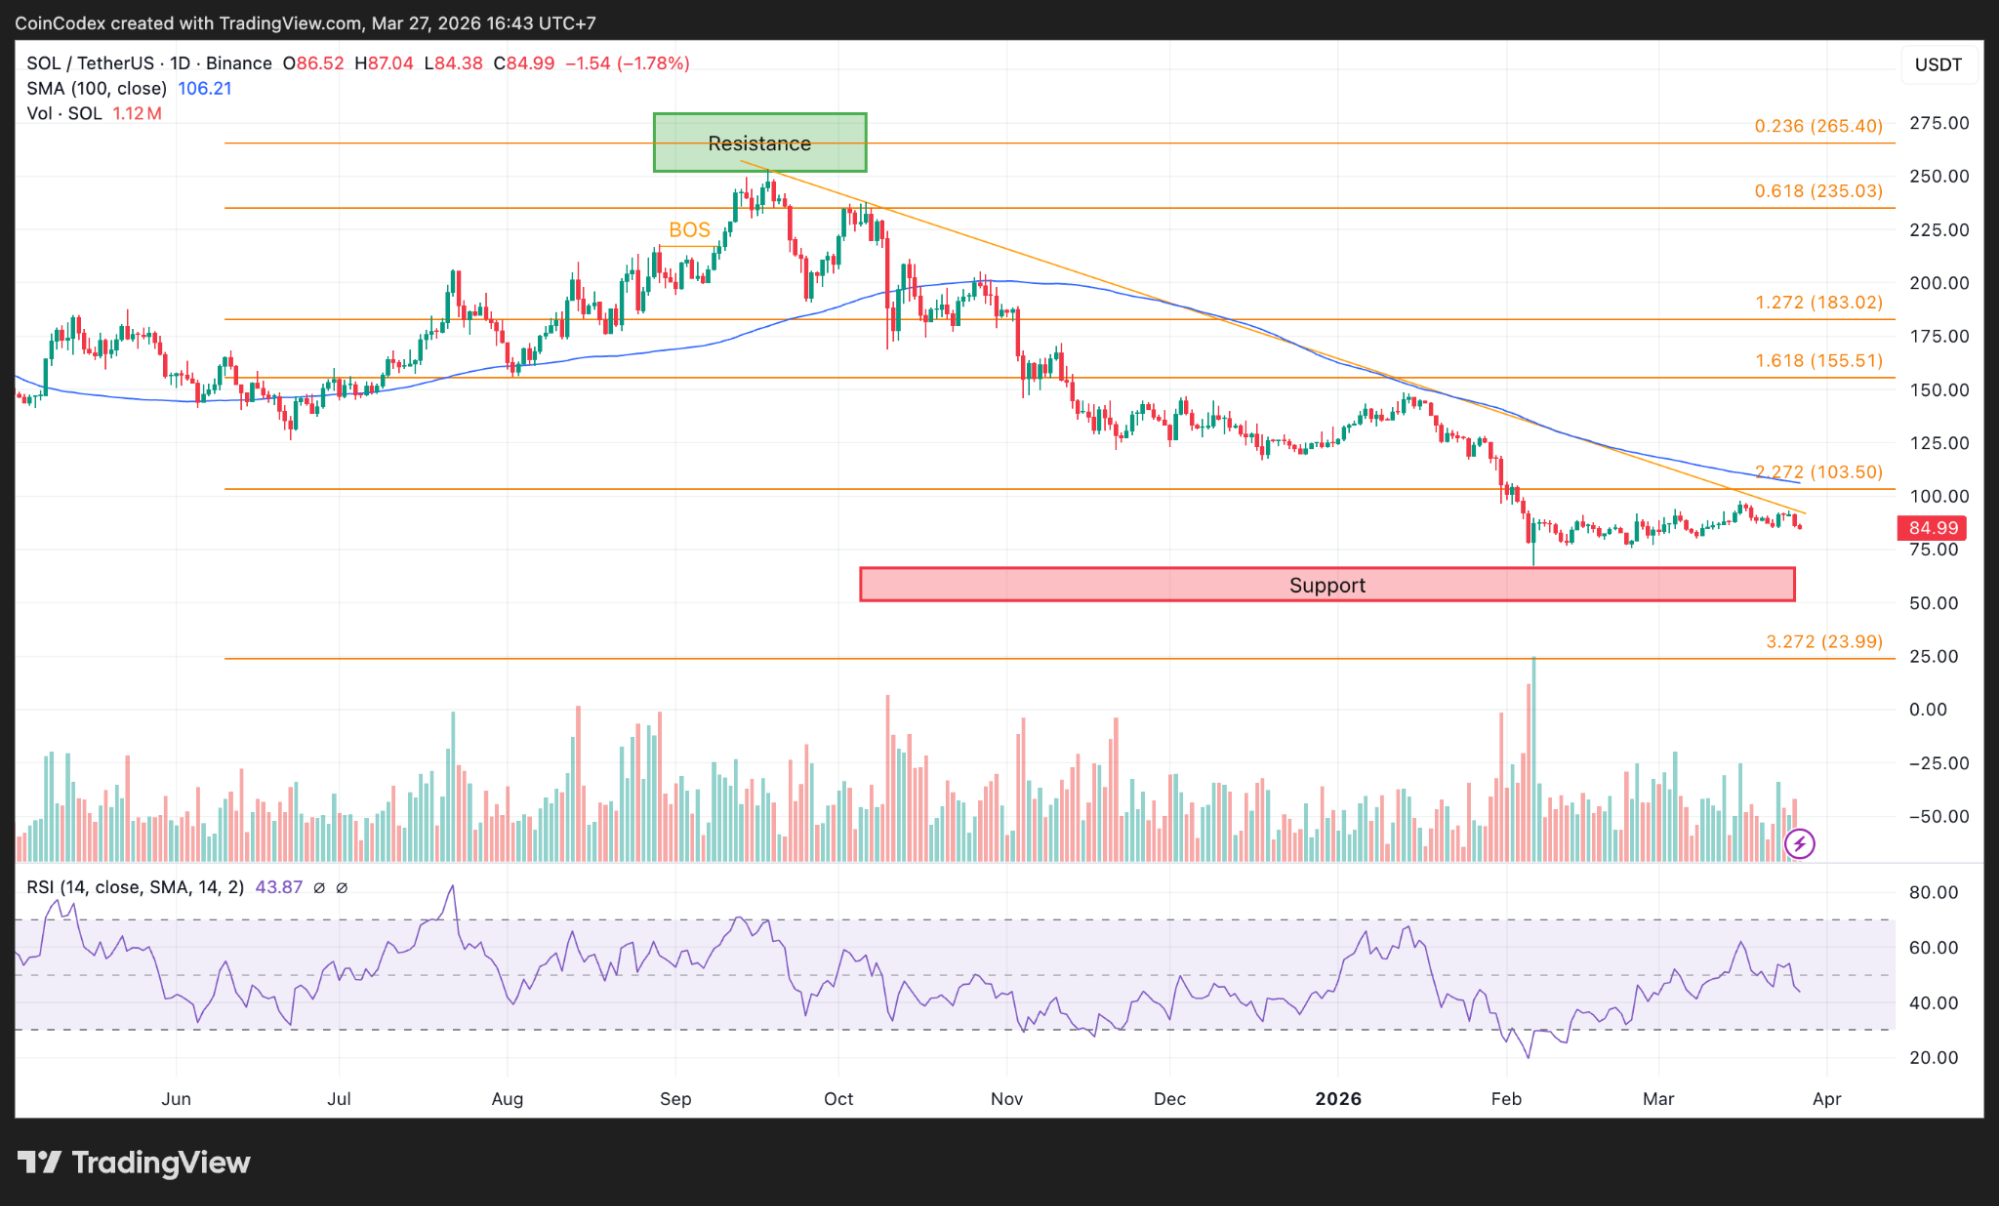
Zooming out to the daily chart, the picture is still bearish overall. The SOL price is sitting at $84.99, and the 100-day SMA is way up at $106.21. That’s a long way to climb.
Daily SOL price chart analysis.
The Fibonacci levels show the path ahead. The 2.272 extension sits at $103.50, which is the first real resistance above. Then there is 1.618 at $155.51, the 1.272 at $183.02, and the 0.618 at $235.03.
But here’s the thing. The RSI on the daily is sitting at 43.87, which is neutral but trending toward oversold. That means there’s room to run if momentum picks up. Volume is light, 1.12 million SOL, which tells you the market is waiting for a catalyst.
What the on-chain data reveals
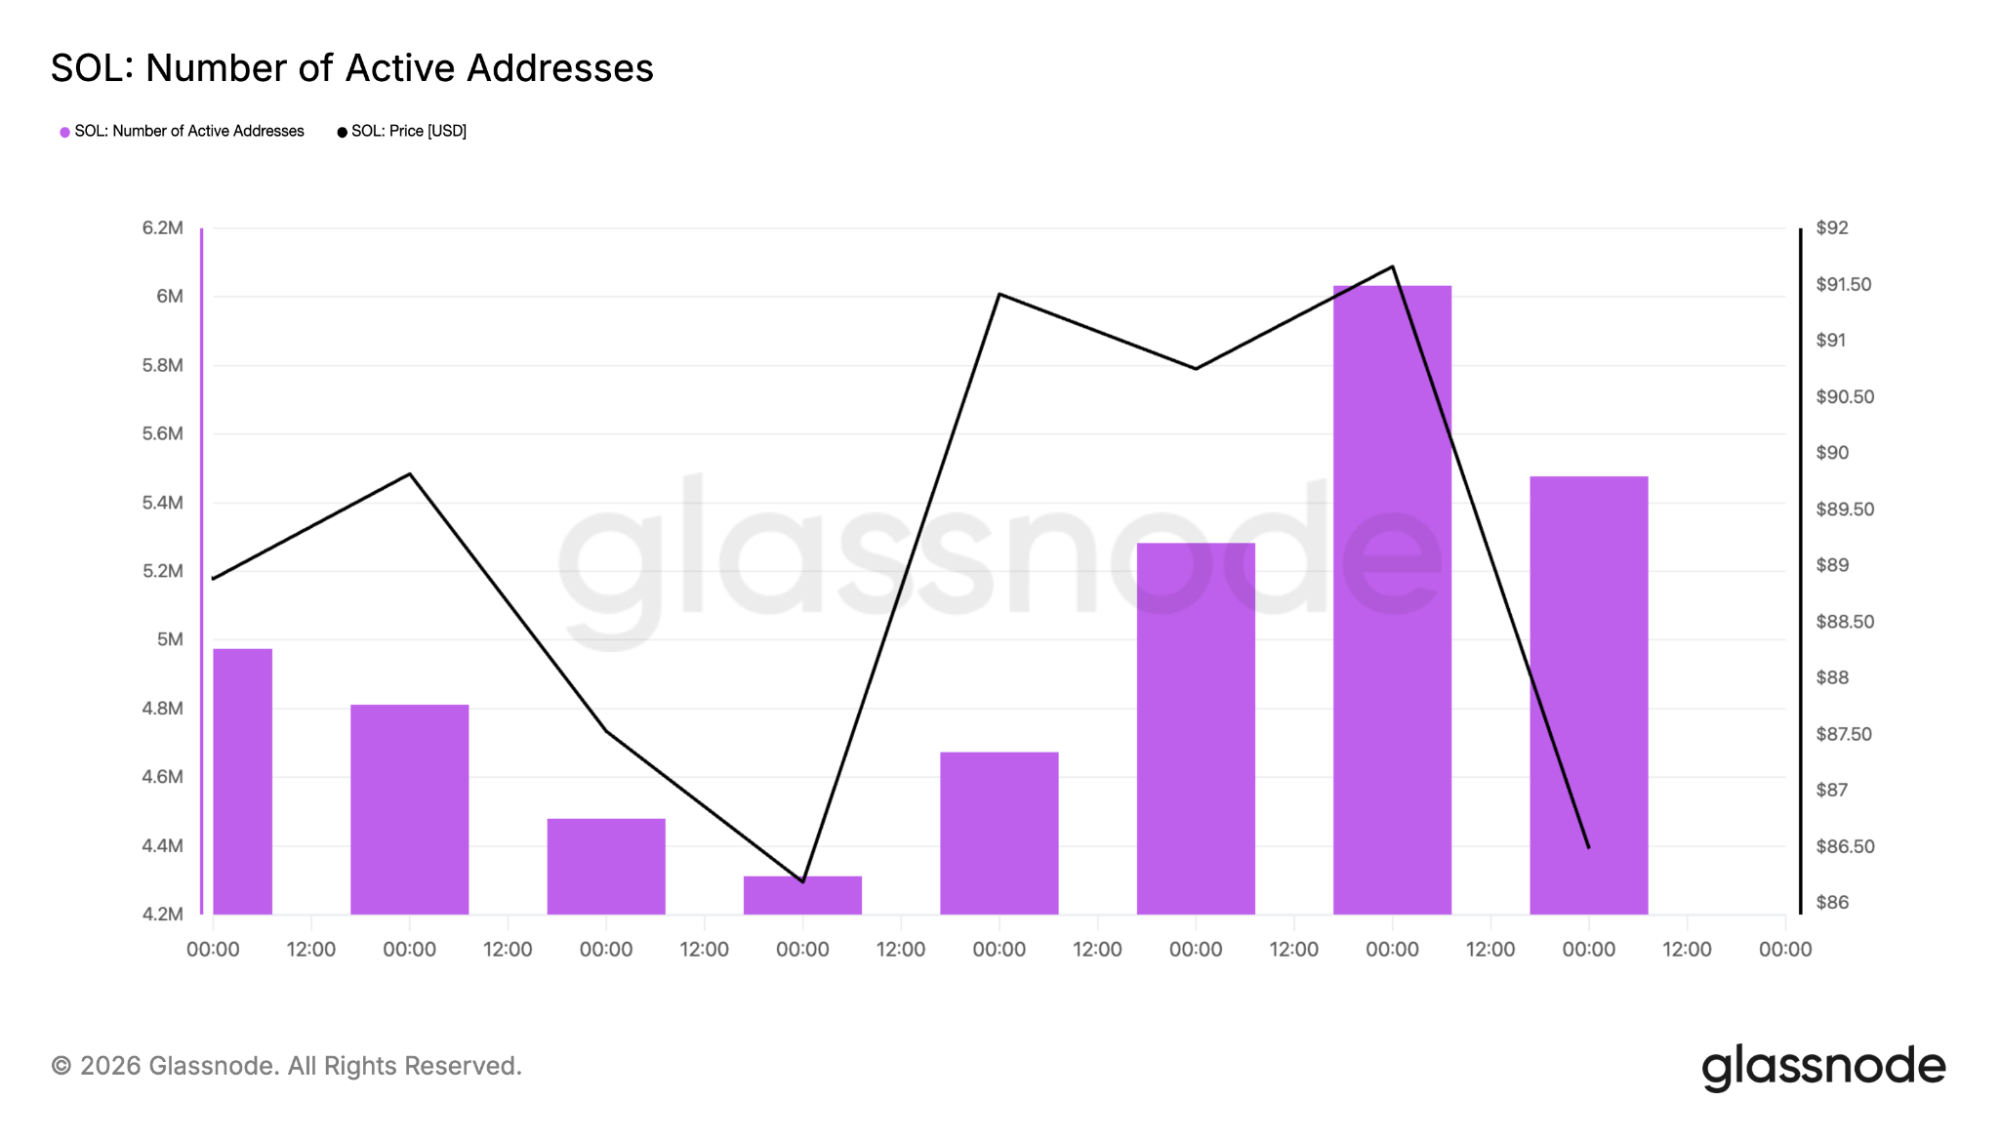
The Glassnode data adds some context to what’s happening underneath. Active addresses on Solana have been holding steady in the 5.4 to 6.2 million range. That’s actually pretty healthy. The network isn’t dead. People are still using it.
Transfer counts are sitting in the 68 to 70 million range, which is solid. That’s not blow-out numbers, but it’s consistent. It tells you that there’s real activity happening on Solana, even if the price is down.
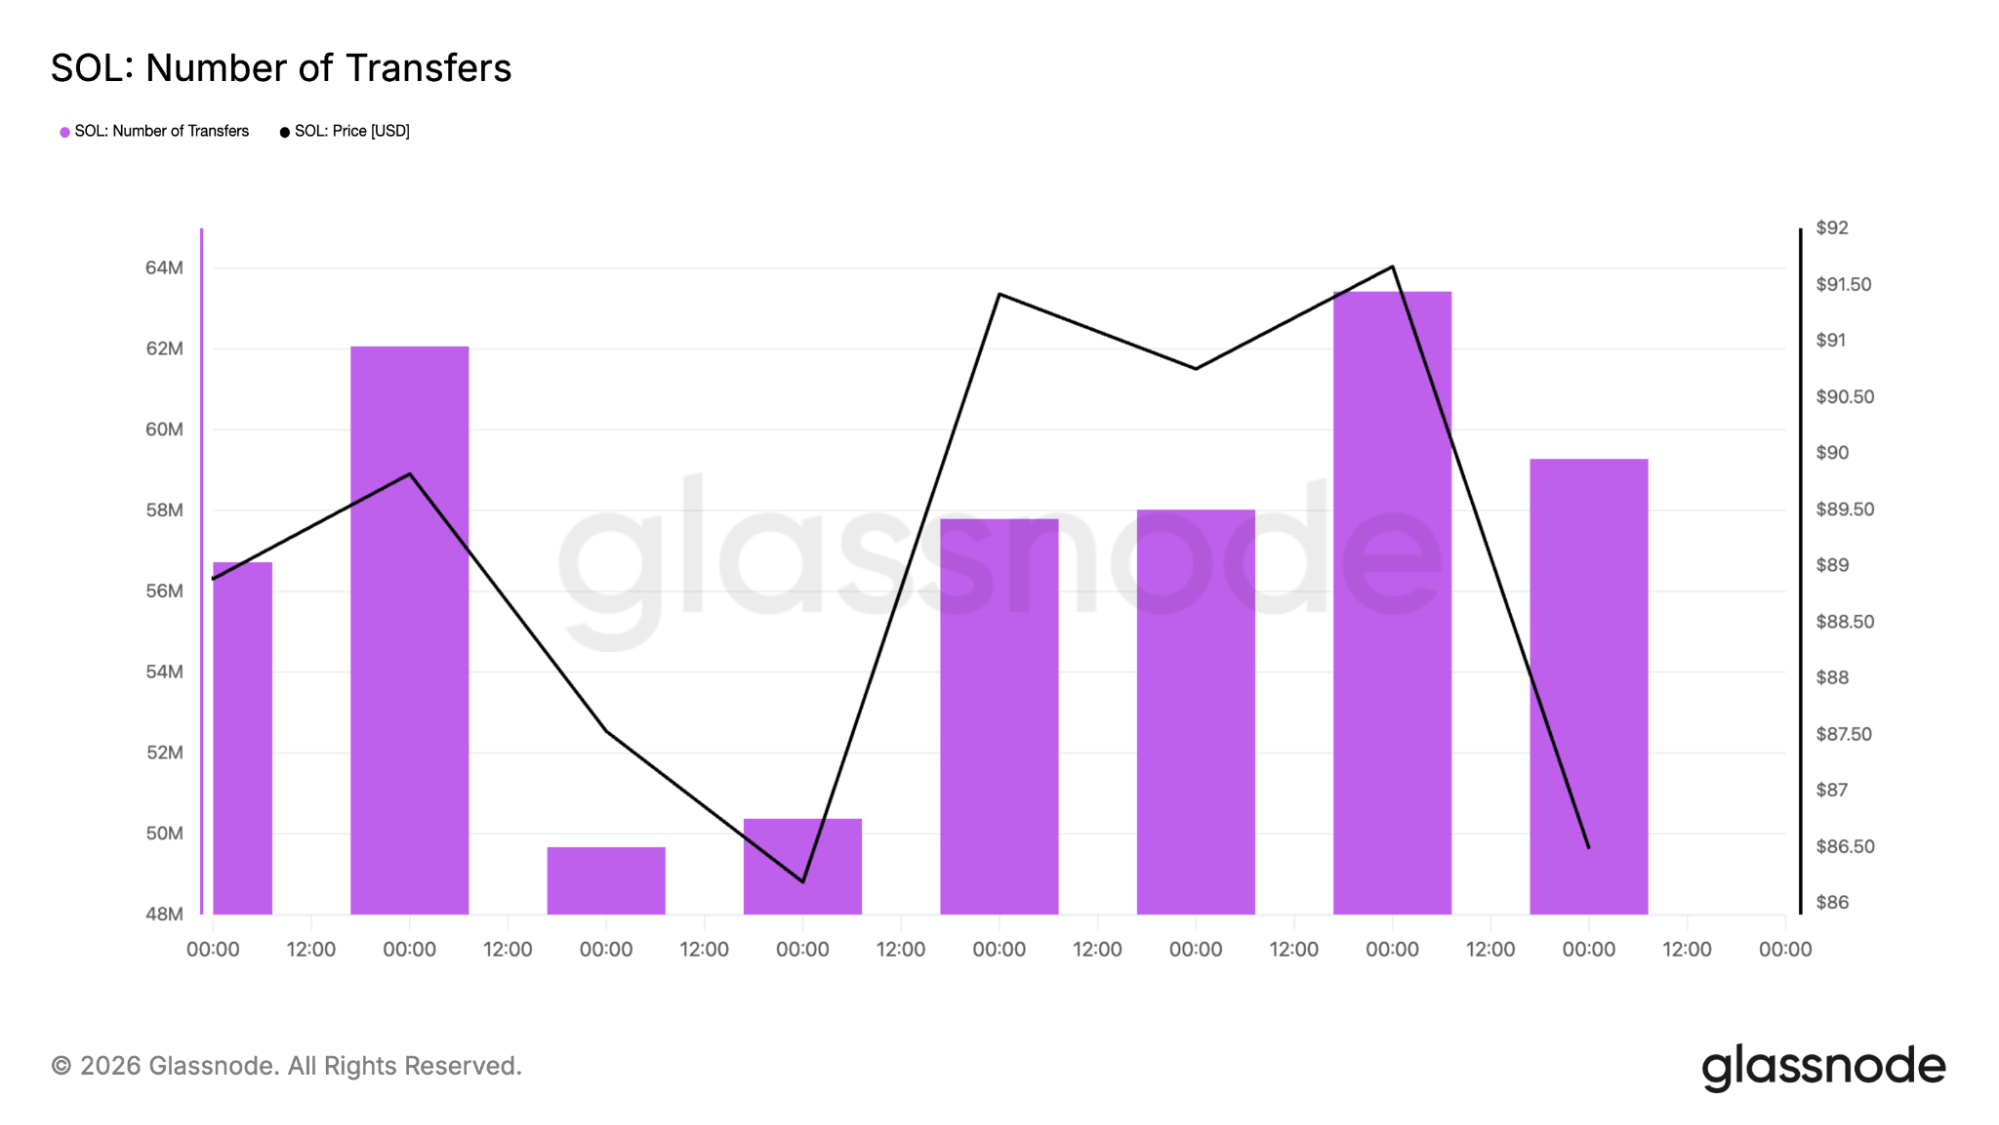
That divergence, where price is down but network activity is steady, is usually the kind of thing that precedes a trend change. The fundamentals get ahead of the market. Eventually, price catches up.
What comes next for Solana
The SOL price is sitting at $85, oversold on the 4-hour, and just flashed a buy signal. The first level to watch is $89. That’s the 100-period SMA and the first real resistance. If the SOL price can reclaim that, the next target is $93 to $95, then the $100 zone.
On the downside, the SOL price needs to hold $84. That’s the recent low. If it breaks below that, the next support is $80, then $75. That would mean the buy signal was just a pause in the downtrend.
The TD Sequential is signaling that the selling might be exhausted. The on-chain data shows the network is still active. The RSI is oversold. The pieces are there for a bounce. But the market needs to show it.
CoinCodex’s 1-month SOL price prediction places the token at $109.46, pointing to a move from current levels near $85 if the TD Sequential buy signal plays out and oversold conditions trigger a bounce.
Kraken: Best crypto exchange for security & reliability
- Buy, sell, and trade 400+ cryptocurrencies with industry-leading security
- Spot, Futures & Margin trading – leverage up to 5x for advanced traders
- Earn rewards with staking on top cryptocurrencies
- 24/7 customer support and high liquidity for fast trades
- Regulated in the US with strong compliance and security measures
- 13+ million users worldwide
Disclaimer: This content is for informational purposes only and does not constitute financial, investment, or other advice. Nothing on this page is a recommendation or solicitation. Always seek independent professional advice before making investment decisions. Some links may earn us a commission at no extra cost to you.
Source:: Solana Price Prediction: SOL TD Indicator Flashes "Buy" – Is a Bounce Next?