Key highlights:
- The Monero price is once again testing the major $450 resistance area that has rejected every rally for nearly a decade.
- Momentum is slowing down on both higher-timeframe and intraday charts as bearish signals start to appear.
- A rejection here could open the door to deeper pullbacks, while a clean breakout would rewrite Monero’s long-term structure.
Monero has pushed its way back into one of the most important zones on its entire chart, and the timing couldn’t be more interesting.
After a strong run that carried the XMR price toward the familiar $450 region, traders are once again watching to see whether this level finally breaks or whether history repeats itself.
This area has acted like a ceiling for seven years and more, and every time Monero tried to climb over it, the price eventually rolled over and headed lower.
Now that XMR is tapping the zone once more, the same question is being asked: is this the moment things finally change, or are we gearing up for another sharp rejection?
XMR runs into the same barrier that has stopped every rally since 2017
If you look at the monthly chart shared by Ali Martinez, the pattern is immediately obvious. Every major push toward $450 ended the same way: a big wick into resistance, a lot of selling pressure, and a reversal that stretched over months or even years.
It doesn’t matter whether you look at 2017, 2021, or 2023, it’s the exact same behavior. Even though Monero spent most of 2025 grinding higher from the $135–$165 accumulation area, it’s still running straight into the level that has defined its long-term structure for nearly a decade.
Since 2017, $450 has been a brick wall for Monero $XMR. Another rejection here could send prices to $230 or even $140. pic.twitter.com/7p6RAyfi9B
— Ali (@ali_charts) November 10, 2025
The candle for November tells the story pretty clearly. The XMR price peeked above the zone briefly, but the wick shows it was rejected almost immediately. That doesn’t mean the breakout attempt is dead, there’s still plenty of time left in the month, but when a level has rejected this consistently in the past, traders naturally get cautious.
The forecast path drawn on the Monero chart reflects the possible downside scenario. If Monero gets rejected again, the price could revisit the $260–$270 region fairly quickly, and if momentum shifts sharply, even the $140 zone comes into play.
On-chain data shows strength returning, but also highlights a vulnerable area
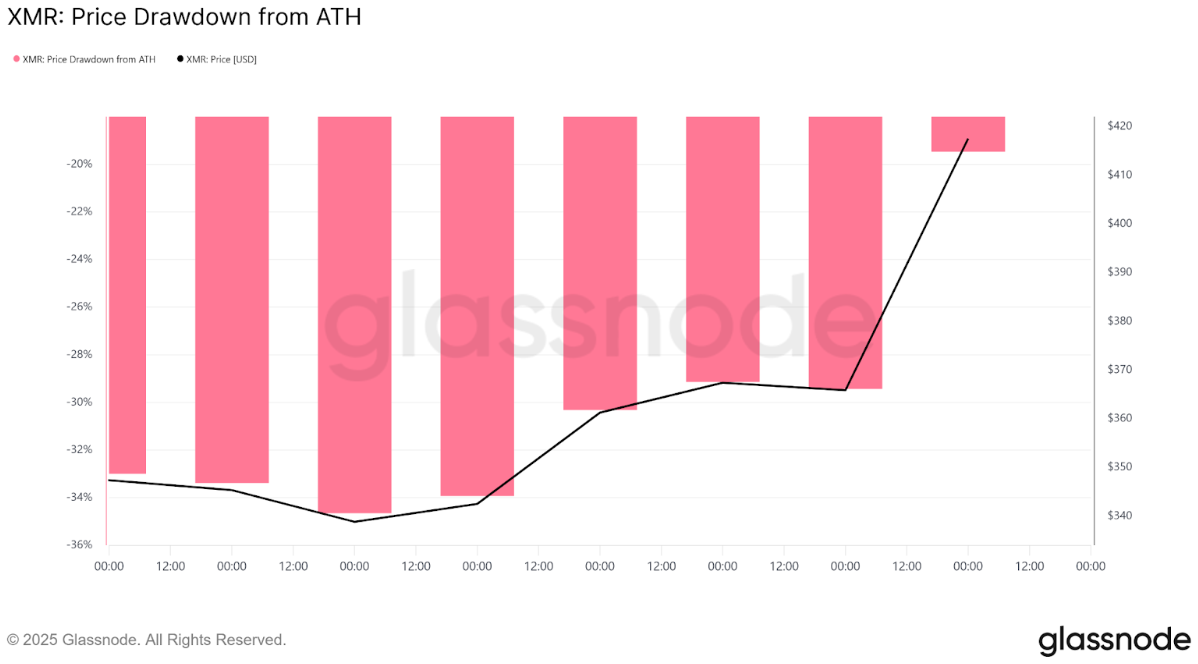
The recent on-chain data from Glassnode adds another layer to the picture. The drawdown chart shows how quickly Monero recovered from a deep 30–35% decline earlier in the month.
The surge back into the mid-$400s pulled the drawdown back into much healthier territory. Historically, when Monero recovers sharply into resistance, the next move tends to be decisive, either a real breakout or a deep correction.
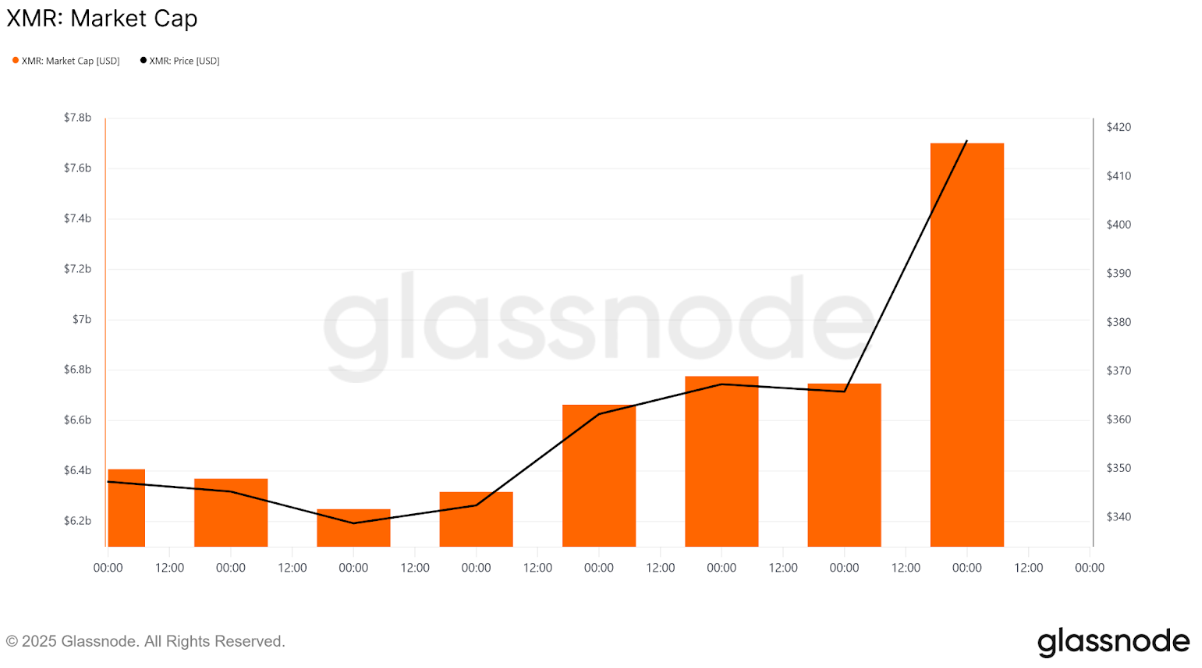
The market cap trend reinforces the same idea. The XMR price spent months stuck near the $6.2–$6.8 billion zone before fresh capital came back in and lifted the market cap toward $7.7 billion. That influx is positive, but it also shows that a lot of this move is fueled by renewed investor appetite rather than any structural supply shift.
The circulating supply chart adds a small but important detail. The supply trend has been steady, while the price has been doing all the heavy lifting. This shows the rally has been driven mainly by buyers returning to the market.
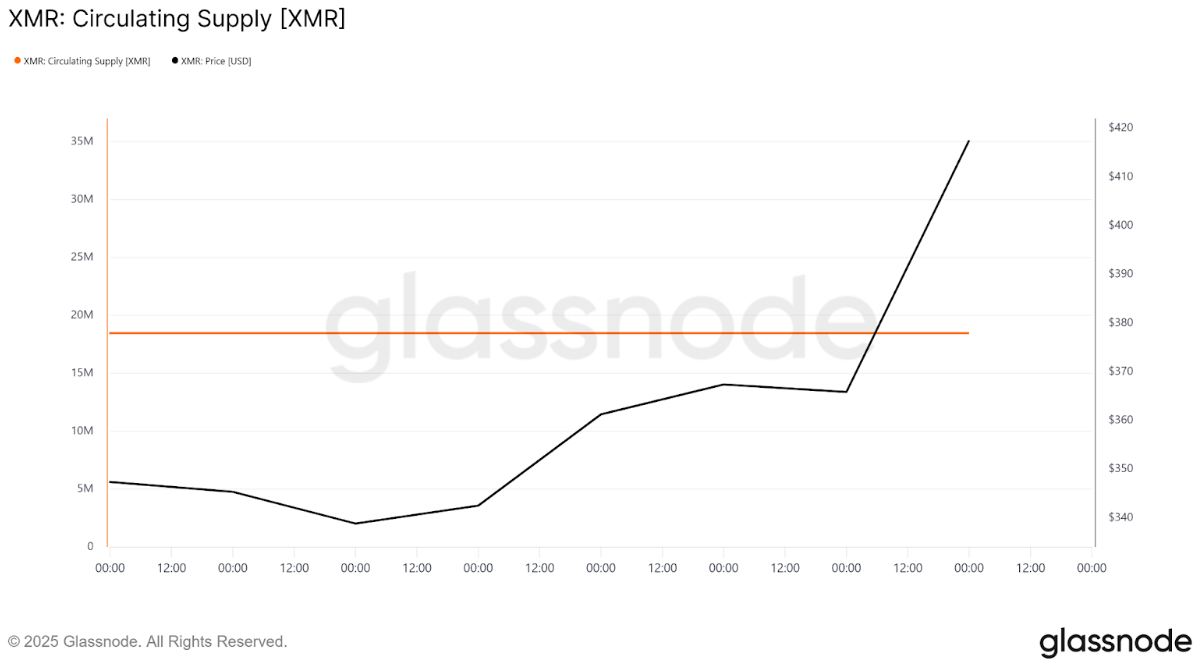
When price moves into a massive resistance zone under those conditions, reactions are usually more volatile, because the structure relies almost entirely on momentum.
Monero charts show the first signs of tired momentum
The daily and 4-hour charts help explain why traders are growing cautious here. On the 4-hour chart, Monero blasted through the $350 region with a strong impulse move that left almost no consolidation behind.
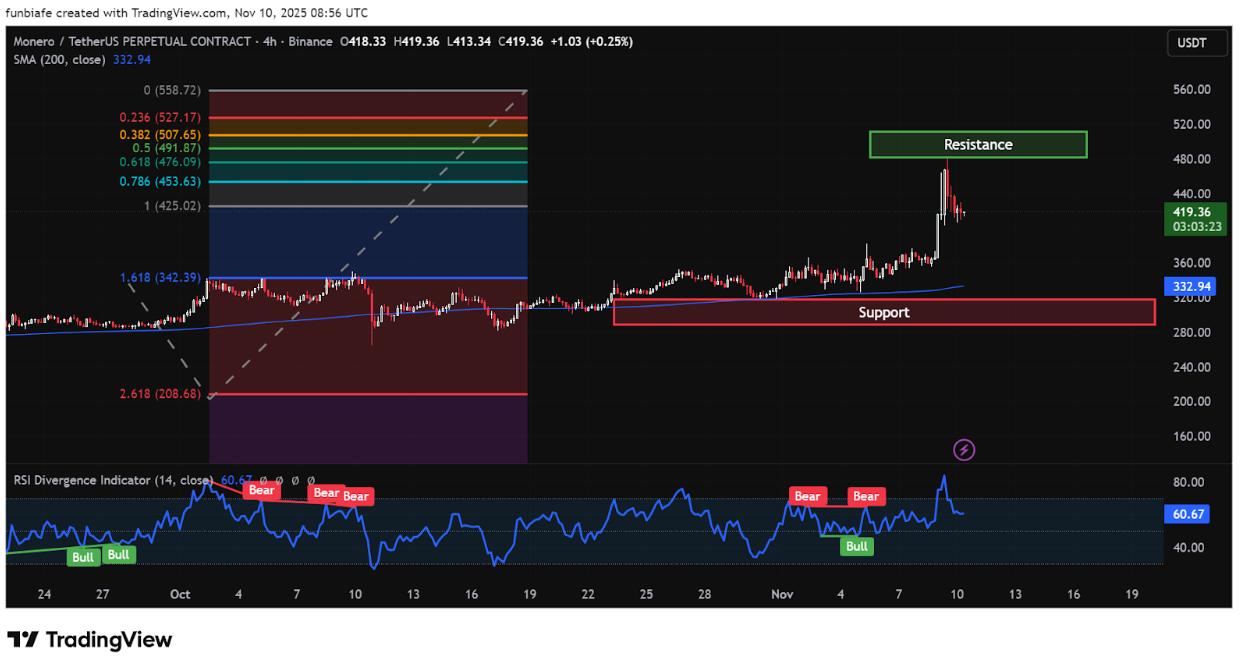
XMR 4hr chart. Source: TradingView
But the moment the XMR price touched the $450 zone, things slowed down. Candles started forming with smaller bodies, the first wick rejection appeared, and price dipped back toward the low $410s. That’s usually the kind of behavior you see when buyers run into heavy resistance.
The Fibonacci levels drawn across the chart highlight why this reaction makes sense. The 0.786 level sits almost perfectly at $453, which lines up exactly with the same resistance that stopped Monero in the past. Because the price reacted there, it adds even more weight to the zone.
The daily chart backs this up with its own signals. After the strong green candle that sent XMR into resistance, the next few candles showed hesitation, wicks on both sides and smaller bodies.
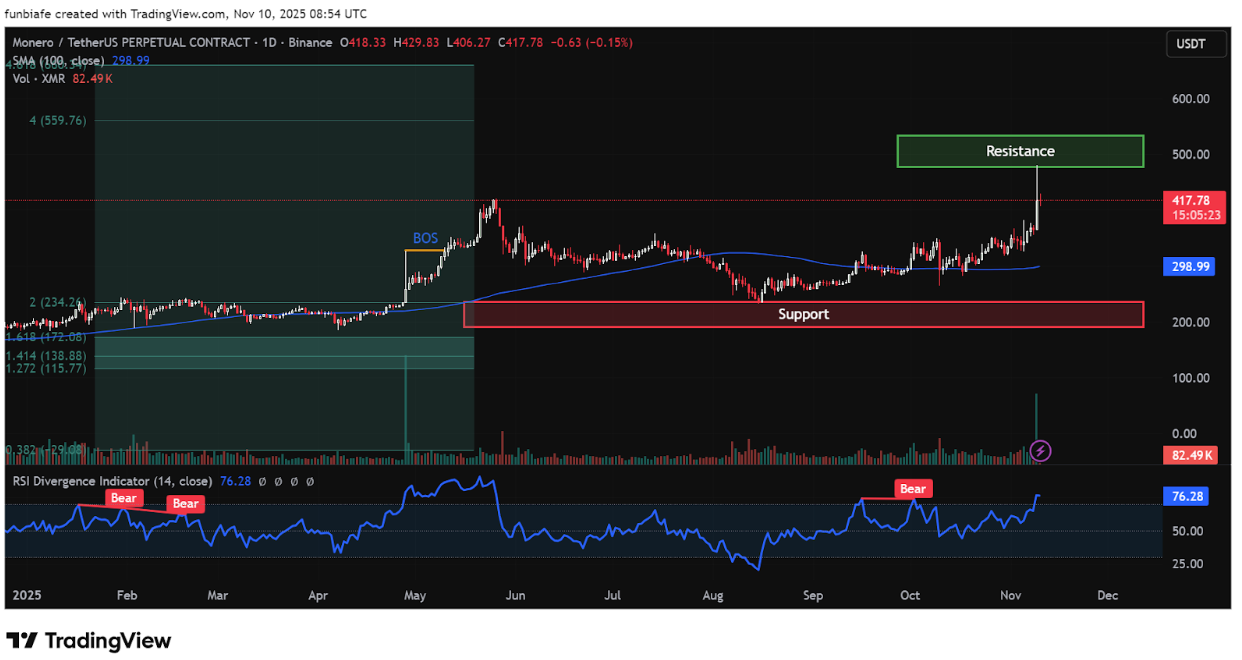
XMR daily chart. Source: Tradingview
At the same time, the RSI divergence indicator printed a bearish signal just as Monero tapped into the zone. It doesn’t confirm a reversal, but it does show that momentum is fading right where the market usually slows down.
Breakout or rejection: Which scenario makes more sense?
At this stage, the entire outlook revolves around how Monero handles the $450 area. A clean breakout and a strong monthly close above this level would reshape the long-term structure and likely pull in a fresh wave of liquidity.
But when you consider the early rejection, the slowdown in momentum, the bearish RSI divergence, and the historical pattern, the more conservative outlook still leans toward a retracement first.
A move back toward the $330–$360 region would actually be a healthy correction for the XMR price, especially with the 200-day moving average sitting in that zone. If that level holds, Monero could make another attempt at the resistance with a stronger base.
If the structure breaks down more aggressively, the $260–$270 area becomes the next place to watch. And in the worst-case scenario, usually tied to broader market weakness, the deeper target near $140 remains possible. None of this is guaranteed, but these levels are grounded in clear historical reactions.
What’s next XMR?
This moment is one of the most important points on Monero’s chart in years. The recovery has been strong, on-chain data shows renewed confidence, and the rally brought price back to a zone traders have been watching forever.
But the resistance hasn’t changed. It’s still the same level that rejected every major rally for seven years, and it’s still one of the most dominant barriers in the entire privacy-coin sector.
If the Monero price can stabilize above $410 and build a base, another test of $450 becomes likely. If it can push through cleanly, everything changes. But if the rejection deepens, the next leg lower could unfold quickly, especially because momentum is already showing early signs of cooling off. According to CoinCodex’s Monero price prediction, XMR is forecasted to go up by 8% in the next 3 months.
Whichever way this breaks, the next few weeks will decide whether Monero finally leaves this multi-year ceiling behind or whether the $450 wall continues to define the long-term story.
Kraken: Best crypto exchange for security & reliability
- Buy, sell, and trade 400+ cryptocurrencies with industry-leading security
- Spot, Futures & Margin trading – leverage up to 5x for advanced traders
- Earn rewards with staking on top cryptocurrencies
- 24/7 customer support and high liquidity for fast trades
- Regulated in the US with strong compliance and security measures
- 13+ million users worldwide
Source:: Monero Price Analysis: The XMR Price Struggles at $450 – Is Another Rejection Coming?