Key highlights:
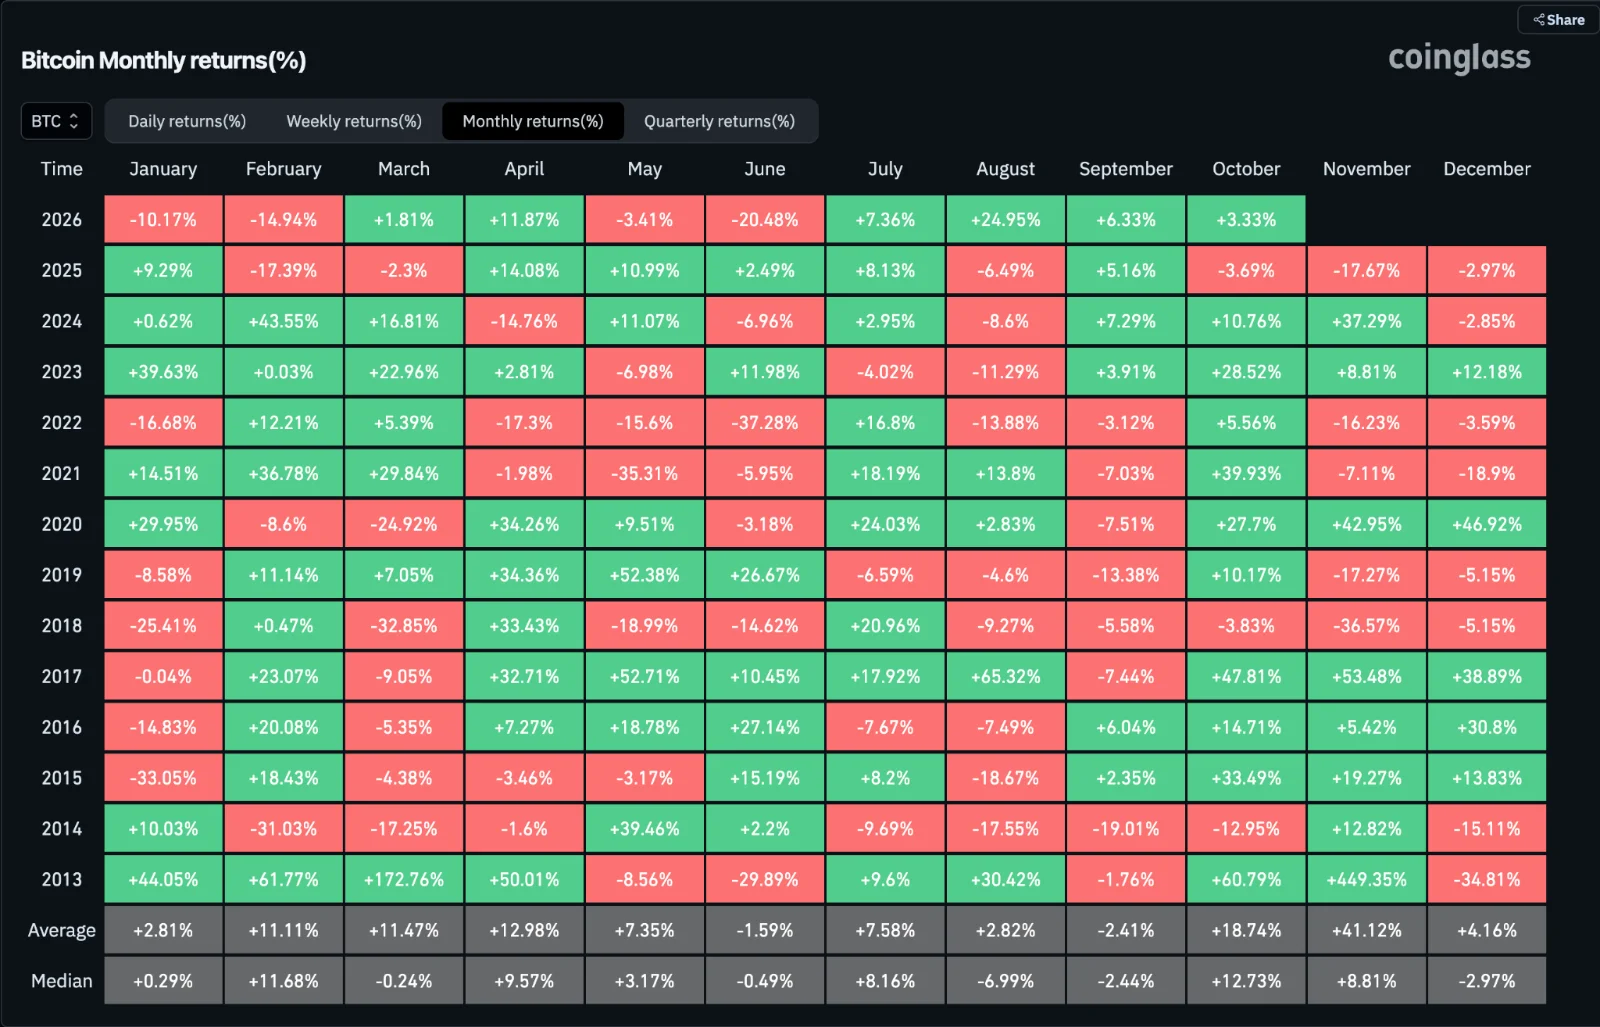
- Bitcoin entered “Uptober” at ~$83,823, with historically Bitcoin gains in 10 of 13 October, and 4 of 5 green Septembers followed by positive Octobers.
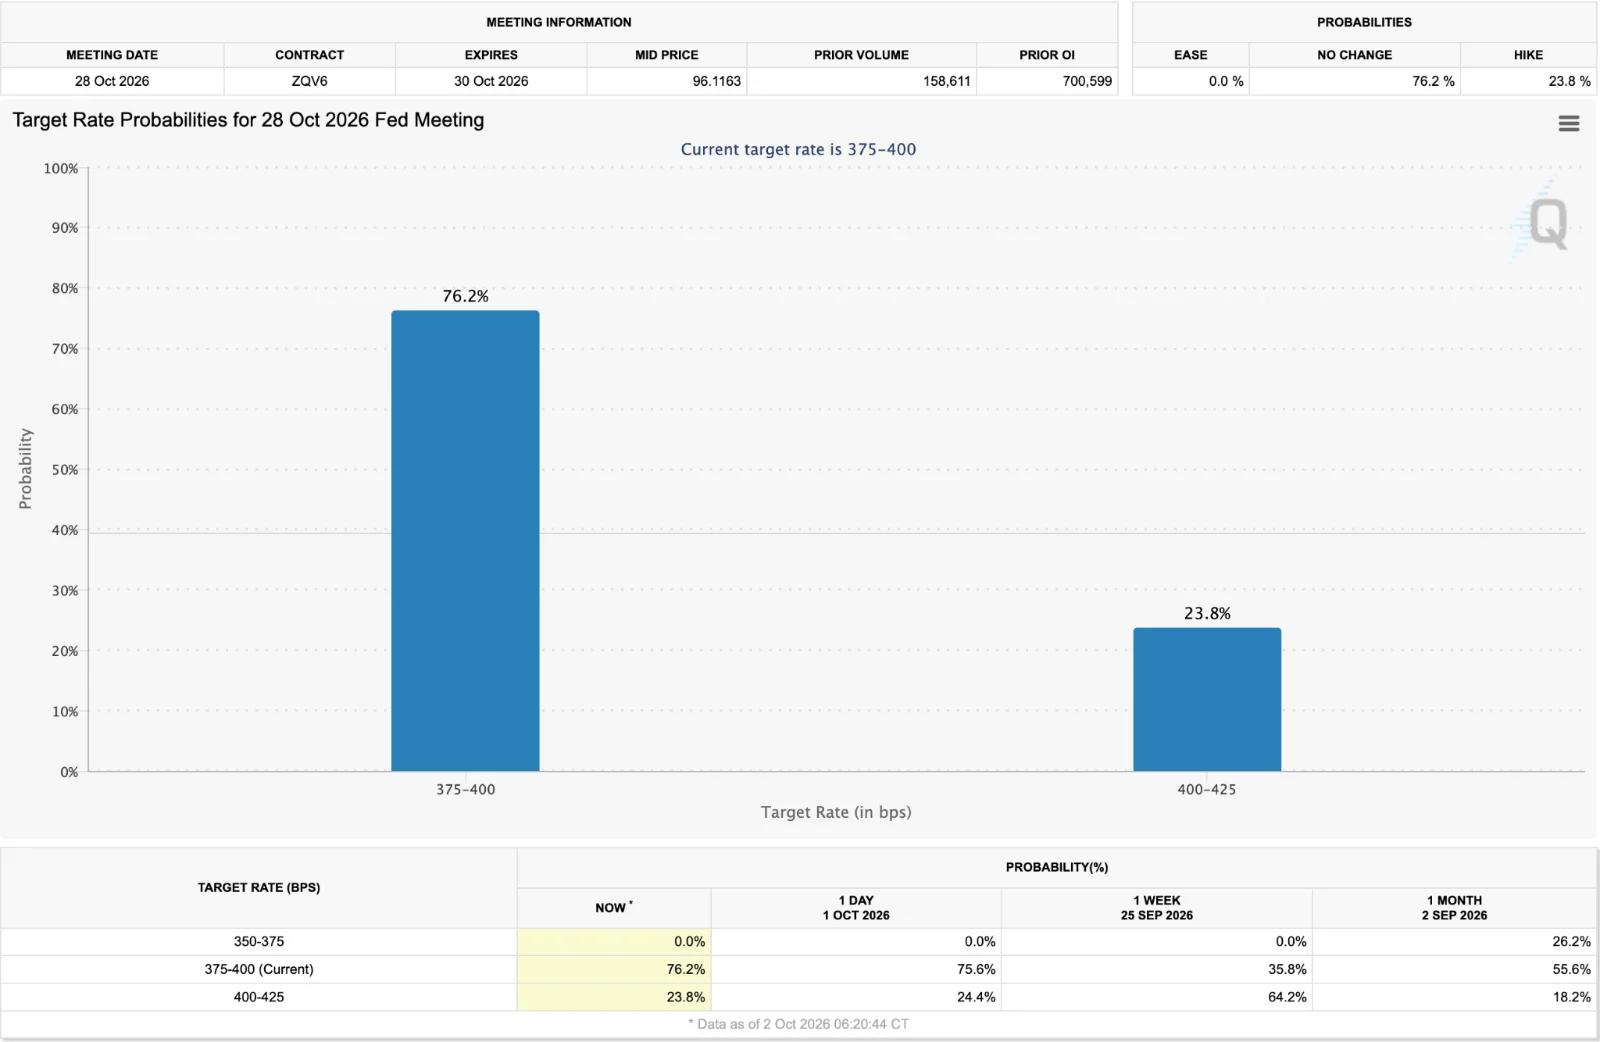
- The 10-year Treasury yield hit 5.304%, the 30-year reached 5.632%, and Fed rate hike odds for Oct. 27-28 sit at ~70% with the Oct. 2 jobs report and Oct. 14 CPI as the next major catalysts.
- Glassnode identified a threefold-grown sell wall at 85,000–85,500 with subdued daily volume of ~$6.4B (near ETF-era lows) and resistance at 87,100–87,400 above.
Bitcoin entered October near $83,000 as investors weighed the cryptocurrency’s historical record of gains during the month against rising US Treasury yields and the Federal Reserve’s latest interest rate increase.
While renewed buying and strong inflows into spot Bitcoin exchange-traded funds have supported the recovery, higher borrowing costs are creating fresh challenges for the market.
Markets have placed the probability of an October rate increase to about 70%, making the Fed’s Oct. 27-28 meeting a key event alongside the Oct. 2 jobs report and Oct. 14 CPI release.
Bitcoin hits $85,000 resistance—can bulls break through?
Bitcoin is facing resistance around $85,000 as weak trading volume, according to Glassnode.
Glassnode identified a large sell wall between $85,000 and $85,500, which has grown roughly threefold since appearing on Sept. 24.
A sustained move above $85,500 would clear the largest immediate resistance, while $77,200, the firm’s True Market Mean, remains a key support level.
Source: Glassnode
Trading activity remains subdued, with combined Bitcoin spot and U.S. spot ETF volume averaging about $6.4 billion a day, near the lower end of its range since the ETFs launched.
Glassnode said the limited volume suggests the recovery has yet to attract broad participation.
Technical analysts are divided on the next move, as Ted Pillows on X compared Bitcoin’s current structure with its 2023 price action and identified the $75,000 area as a potential pullback zone if the pattern repeats.
The comparison remains a single historical analogue rather than a confirmed forecast.
Meanwhile, Daan Crypto Trades pointed to a breakout above the $85,121 resistance on the hourly chart.
He identified $87,100-$87,400 as the next major resistance zone, while a move back below $85,121 could signal a failed breakout and expose Bitcoin to the $82,890 support level.
Despite September’s bearish reputation, Bitcoin has often posted October gains after a positive September.
Source: Coinglass
Four of the five previous green Septembers were followed by October gains: 2015 (+33.49%), 2016 (+14.71%), 2023 (+28.52%), and 2024 (+10.76%), while 2025 fell 3.69%.
With September up 6.33% and October already 2.95% higher, historical data point to potential further gains.
Source:: Bitcoin Starts “Uptober” at $83K as Fed Hike and 5.3% Treasury Yield Test BTC Bulls