Key highlights:
Sui is starting to wake up again, and some analysts believe the move could be much bigger than most traders expect. Crypto analyst Captain Faibik recently shared a chart showing a confirmed falling wedge breakout and a potential 300%+ move for the SUI price.
His message was simple: the train has left the station. The question now is whether SUI can keep climbing or if it needs to slow down before making another run higher.
The timing of this prediction is interesting. The SUI price has been recovering from a brutal decline, institutional access is improving through the 21Shares Spot SUI ETF, and the network is expanding its role in Bitcoin-based DeFi. At the same time, some technical indicators are flashing caution signs after the latest rally.
Why analysts think the SUI price has room to run
The bullish case starts with the chart pattern. For months, SUI traded inside a falling wedge after dropping from its peak near $5.50 to a low around $0.29. That pattern usually signals that selling pressure is fading and buyers are starting to take over.
$SUI Train has left the Station..🚄🚄 https://t.co/PY1L0EdkzJ pic.twitter.com/xZjKv6yV9f
— Captain Faibik 🐺 (@CryptoFaibik) September 21, 2026
The breakout already happened. SUI moved above the wedge’s upper trendline, then came back to test the breakout area near $0.77. Buyers stepped in there and pushed it back up. On the 3-day chart, SUI is trading at $0.9716 after gaining 19.3% on the latest candle.
Faibik’s chart projects a move of roughly 313%, putting a target near $2.50 if the breakout continues to play out. That target lines up with one of the key resistance zones traders are already watching.
There is more behind this SUI rally than technical analysis
The SUI chart is only part of the story. One factor helping the SUI price is the launch of the 21Shares Spot SUI ETF on Nasdaq. The ETF gives institutions a regulated way to gain exposure to SUI, opening the door to capital that may not have entered the market otherwise.
Sui is also making a push into Bitcoin finance. The network has integrated assets such as tBTC and is developing infrastructure like the Hashi bridge to attract Bitcoin liquidity into its ecosystem.
Bitcoin-based assets accounted for more than 20% of Sui’s total value locked in August 2025, showing that BTCfi activity is already becoming a meaningful part of the network. For investors looking at the bigger picture, those developments matter because they create actual demand drivers beyond short-term trading activity.
The SUI recovery is showing up in the numbers
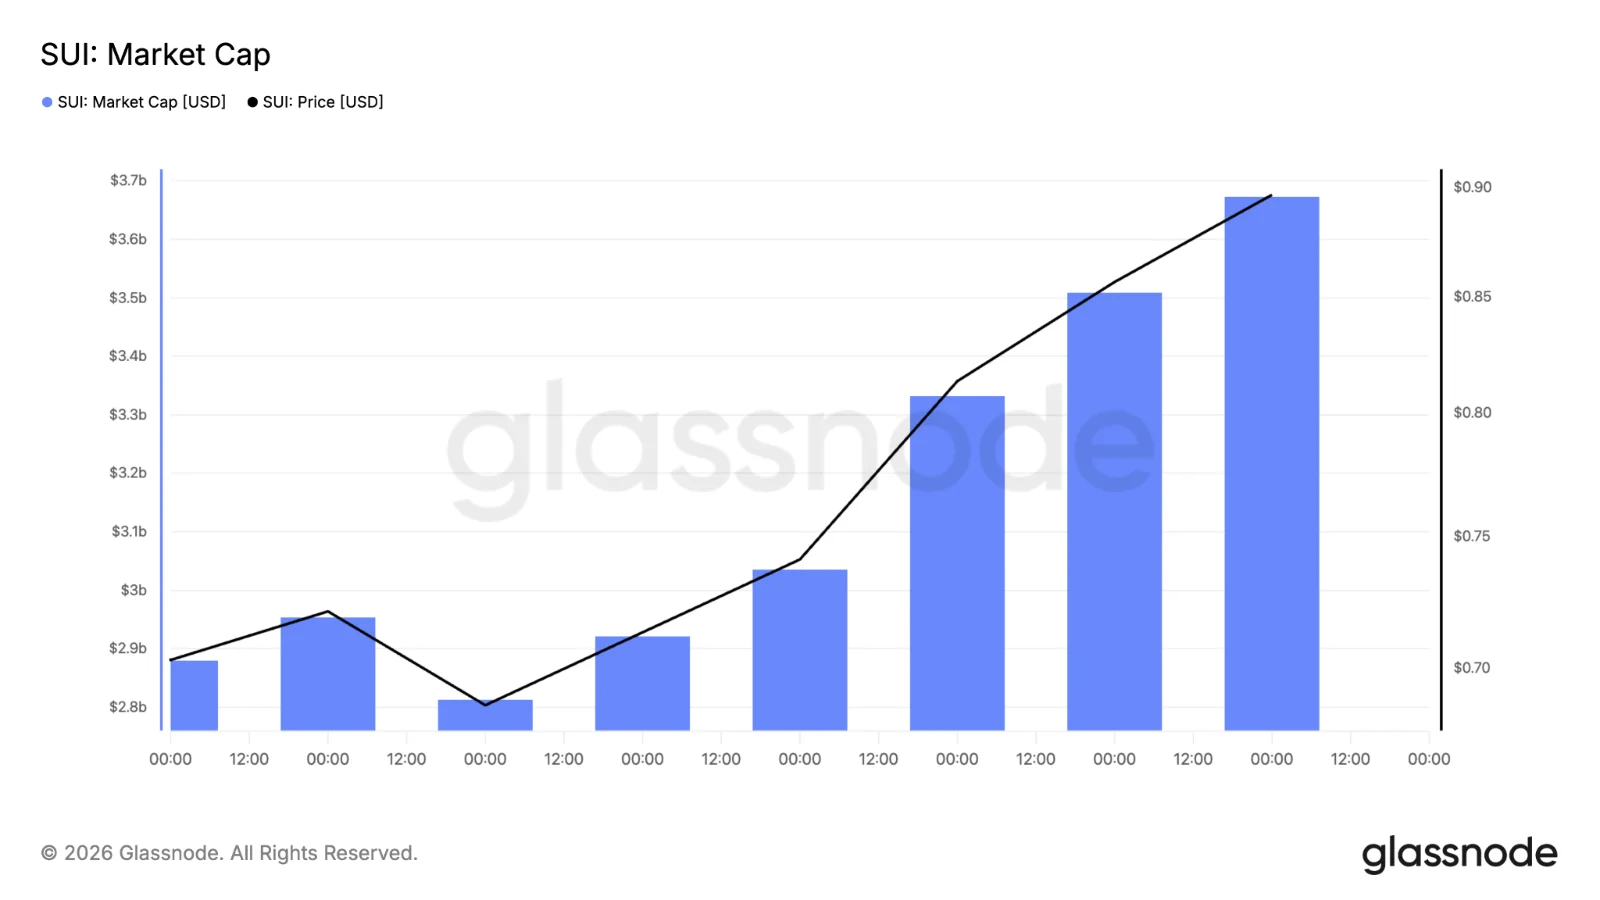
The SUI price is not the only metric moving higher. Sui’s market capitalization has climbed from roughly $2.8 billion to about $3.7 billion. During the same period, the SUI price moved from around $0.70 to approximately $0.90.
That matters because the rising price alongside rising market cap usually means fresh money is entering the asset. Another interesting metric is SUI’s drawdown from its all-time high. Even after the latest recovery, the token remains roughly 83.5% to 87% below its peak near $5.50.
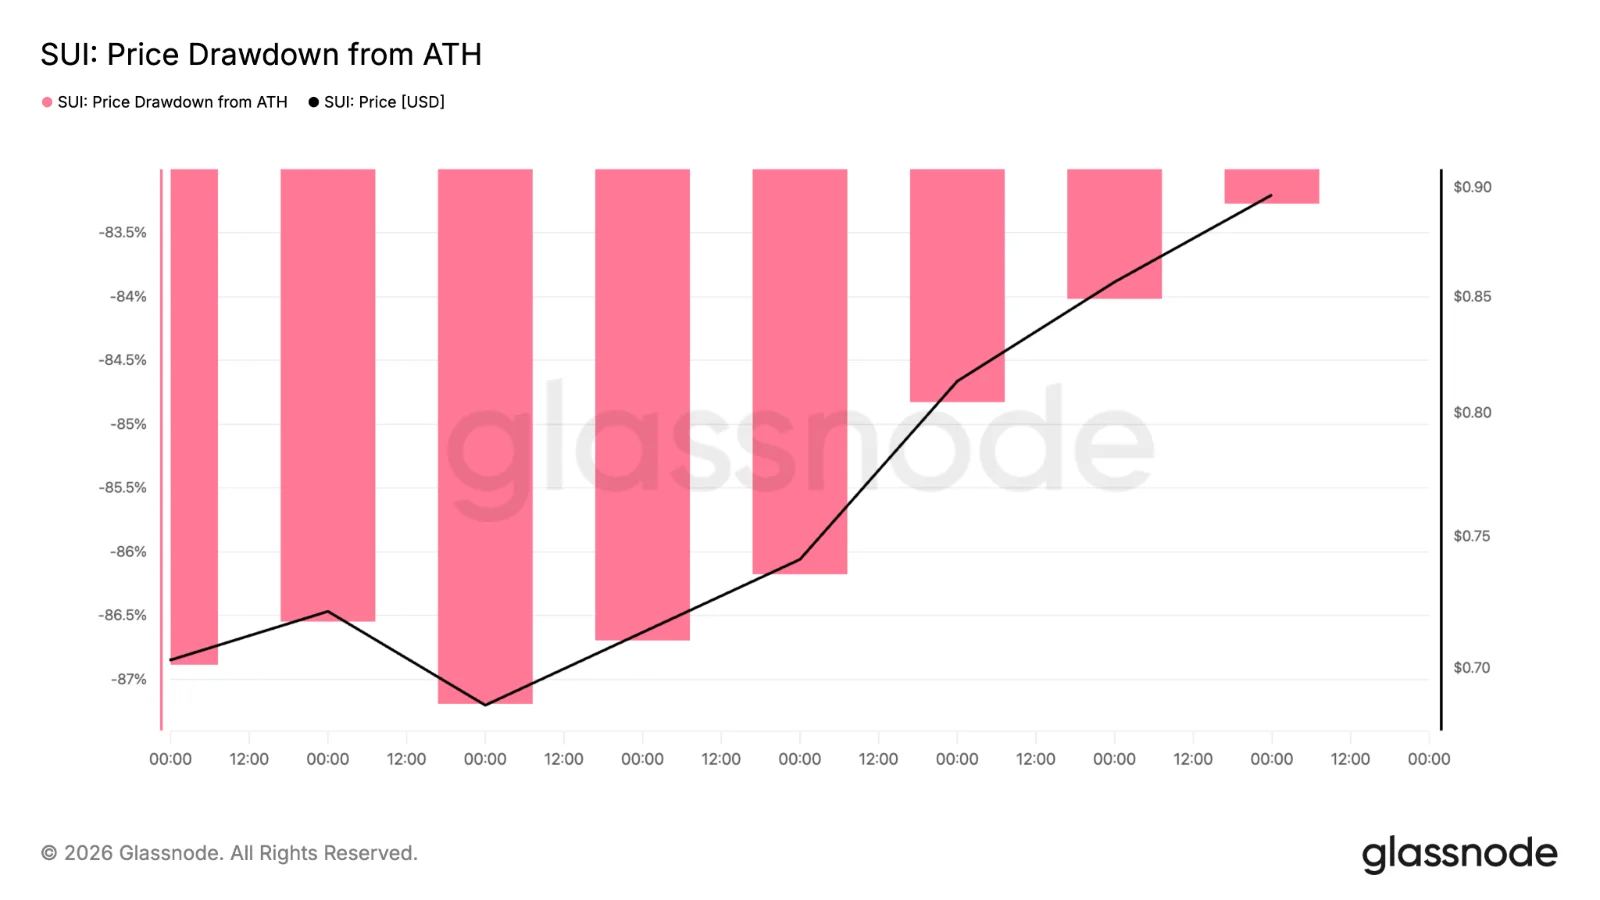
That may sound negative at first, but many major crypto assets have historically formed their strongest recovery phases after similar declines. The drawdown has improved from about -87% to roughly -83.5%, showing that the recovery is slowly closing the gap between current prices and previous highs.
The next levels traders are watching
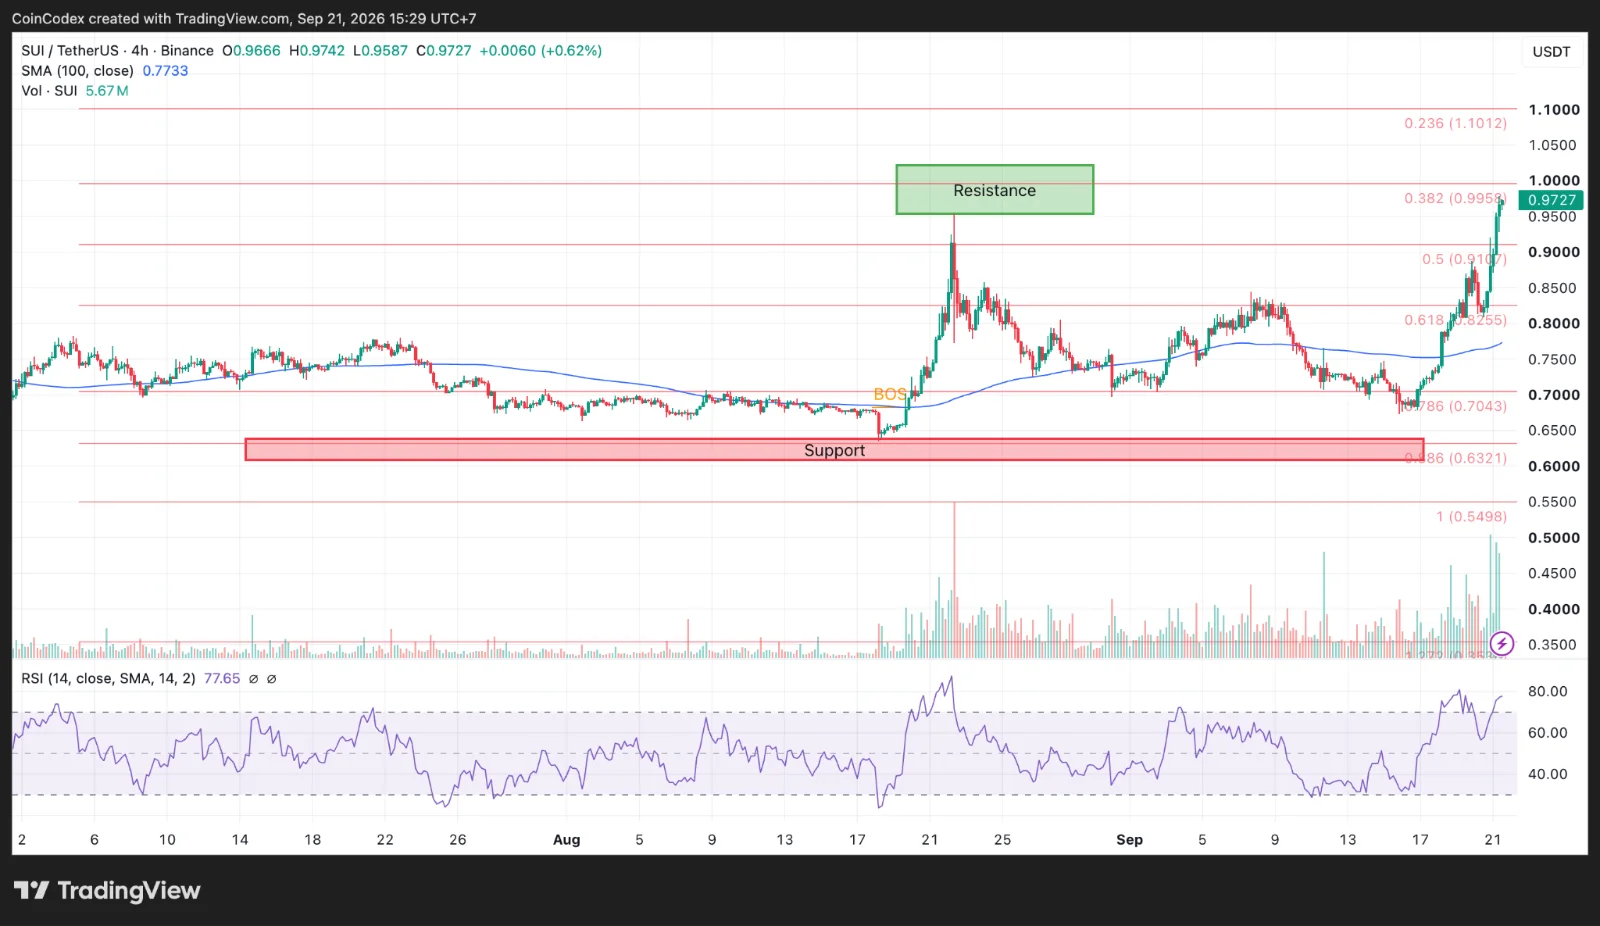
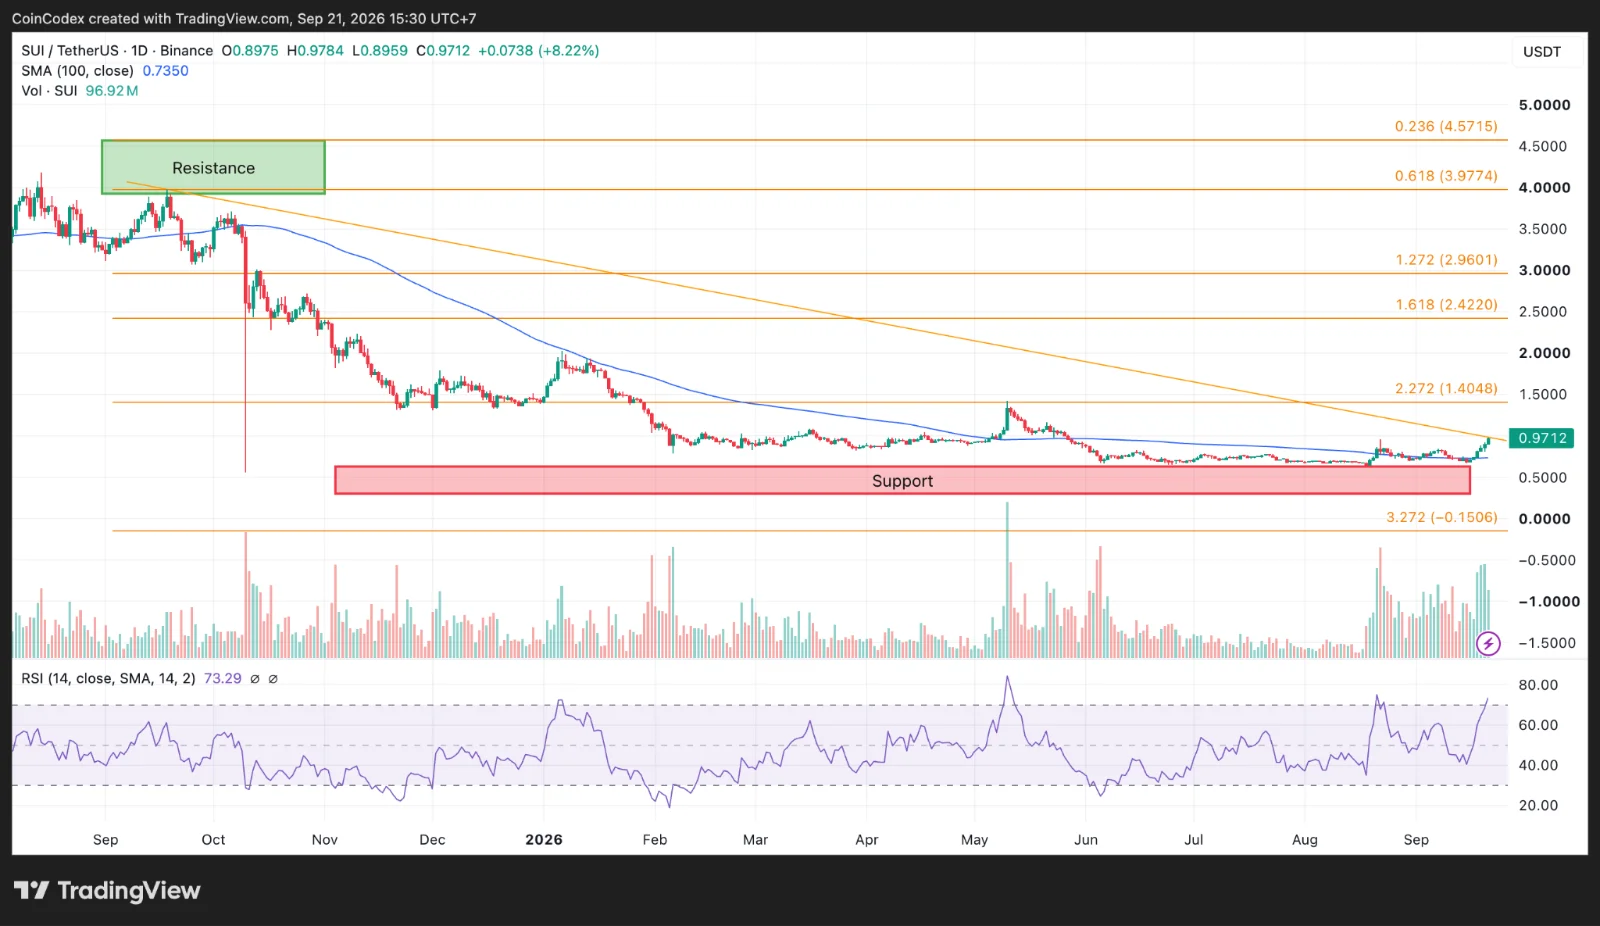
We had a look at both the daily and 4-hour charts, and the trend remains bullish. The SUI price is trading above the daily 100-period SMA at $0.7350 and the 4-hour SMA at $0.7733. Staying above both levels keeps buyers in control for now.
4-hour SUI chart analysis
The first obstacle sits around $0.9958. Above that, traders are watching $1.1012 and then the larger daily resistance level at $1.4048. If those barriers break, attention could quickly move toward $2.4220 and $2.9601. Those levels would bring the SUI price much closer to the targets highlighted in Faibik’s bullish outlook.
The rally has been impressive, but the market is getting crowded on the bullish side. The daily RSI stands at 73.29, and the 4-hour RSI is even higher at 77.65. Both readings are above the traditional overbought level of 70.
Daily SUI chart analysis
That does not mean the SUI price has reached its top. It simply means the market may need a breather before continuing higher. If profit-taking starts, support levels near $0.91, $0.82, $0.77 and $0.73 could come into play.
There is also a scheduled unlock of 13.26 million SUI tokens on October 1, 2026. At current prices, that represents roughly $13.5 million worth of tokens entering circulation. Any large increase in supply can create temporary pressure if holders decide to sell.
Where could the SUI price go next
The SUI price has several things working in its favor right now. The falling wedge breakout remains intact, market capitalization is growing, institutional investors now have ETF access, and Bitcoin-focused activity continues expanding on the network.
The biggest challenge is whether buyers can clear resistance between $0.99 and $1.10. A successful move above that zone could open the door to $1.40 and potentially much higher targets over time.
For now, the trend remains positive. The only question is whether the SUI price moves straight to the next resistance level or takes a pause before the next leg higher begins. CoinCodex’s 1-month Sui price forecast puts the price at $0.7167, which points to a possible cooldown from current levels as analysts factor in the risk of profit-taking after SUI’s latest rally.
Source:: SUI Price Prediction: SUI Breaks Out as Analyst Eyes a Rally Ahead