Key highlights:
- AAVE has gained by over 14% in the past week amid rising on-chain activity
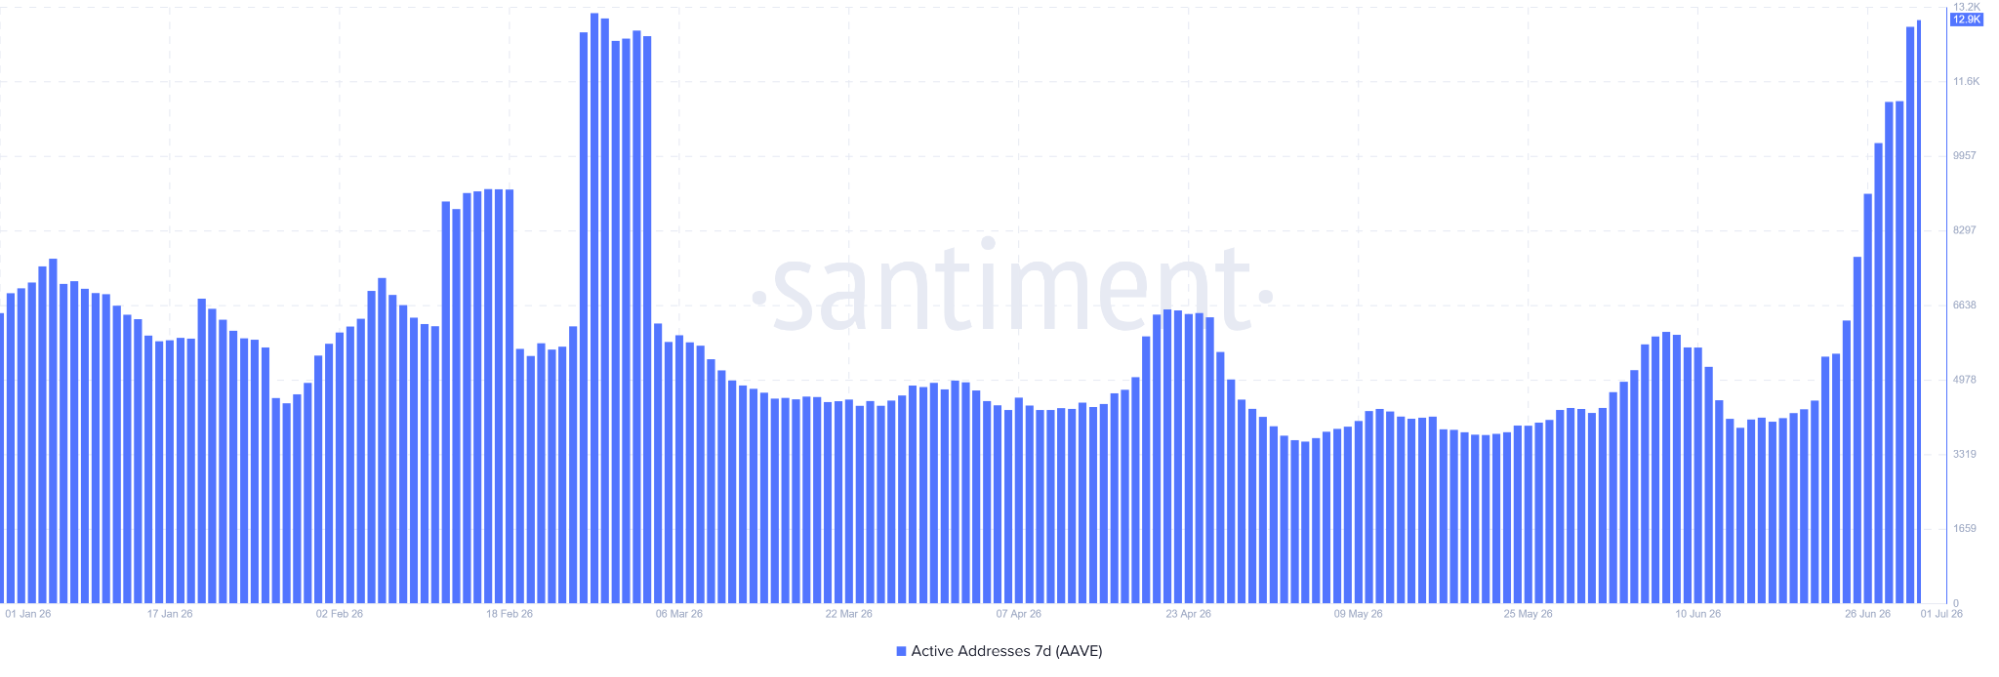
- The network’s Active Addresses also surged to around 13,000, marking the strongest growth in new wallets since 2021
- Key liquidity clusters at $100 and $115 are emerging as the next targets for traders and investors in long positions
Aave’s recent rally is backed by more than just bullish price action.
The leading decentralized lending protocol has seen a sharp increase in user activity over the past week, with the number of active addresses climbing to roughly 13,000, a level not seen in months. The surge marks Aave’s strongest daily growth in new wallets since 2021, suggesting fresh capital and users are returning to the protocol.
The increase in network participation comes as
User growth strengthens Aave’s bullish structure
On-chain activity has become one of the strongest indicators supporting Aave’s latest rally.
The steady rise in active addresses points to growing engagement across the protocol rather than purely speculative trading activity.
Historically, sustained increases in wallet activity have often preceded periods of stronger network utilization, which can translate into higher fee generation and greater demand for governance tokens.
The latest spike suggests investors are once again turning their attention to decentralized finance after months of subdued activity across the sector.
For Aave, which remains the dominant player in decentralized lending, growing user participation reinforces its position as one of the strongest DeFi ecosystems in the market.
AAVE remains in an uptrend despite correction risks
From a technical perspective, AAVE continues to maintain a bullish market structure.
The token remains comfortably above key Exponential Moving Average (EMA) support levels, indicating buyers still control the broader trend. The recent pullback has done little to alter the overall uptrend. However, momentum indicators are beginning to flash caution.
The Stochastic RSI is approaching oversold territory, suggesting that short-term volatility could persist before the next leg higher develops. While this may lead to additional consolidation, analysts generally view such pullbacks as healthy during sustained uptrends.
Liquidity zones point to higher targets
Market participants are now closely watching liquidity concentrations above the current price.
Liquidation heatmaps show significant liquidity clusters forming around the $100 and $115 levels. These zones often act as magnets for price action as market makers and leveraged traders seek liquidity.
If AAVE maintains its current structure and network activity continues to expand, these zones could become the next major upside targets for bulls.
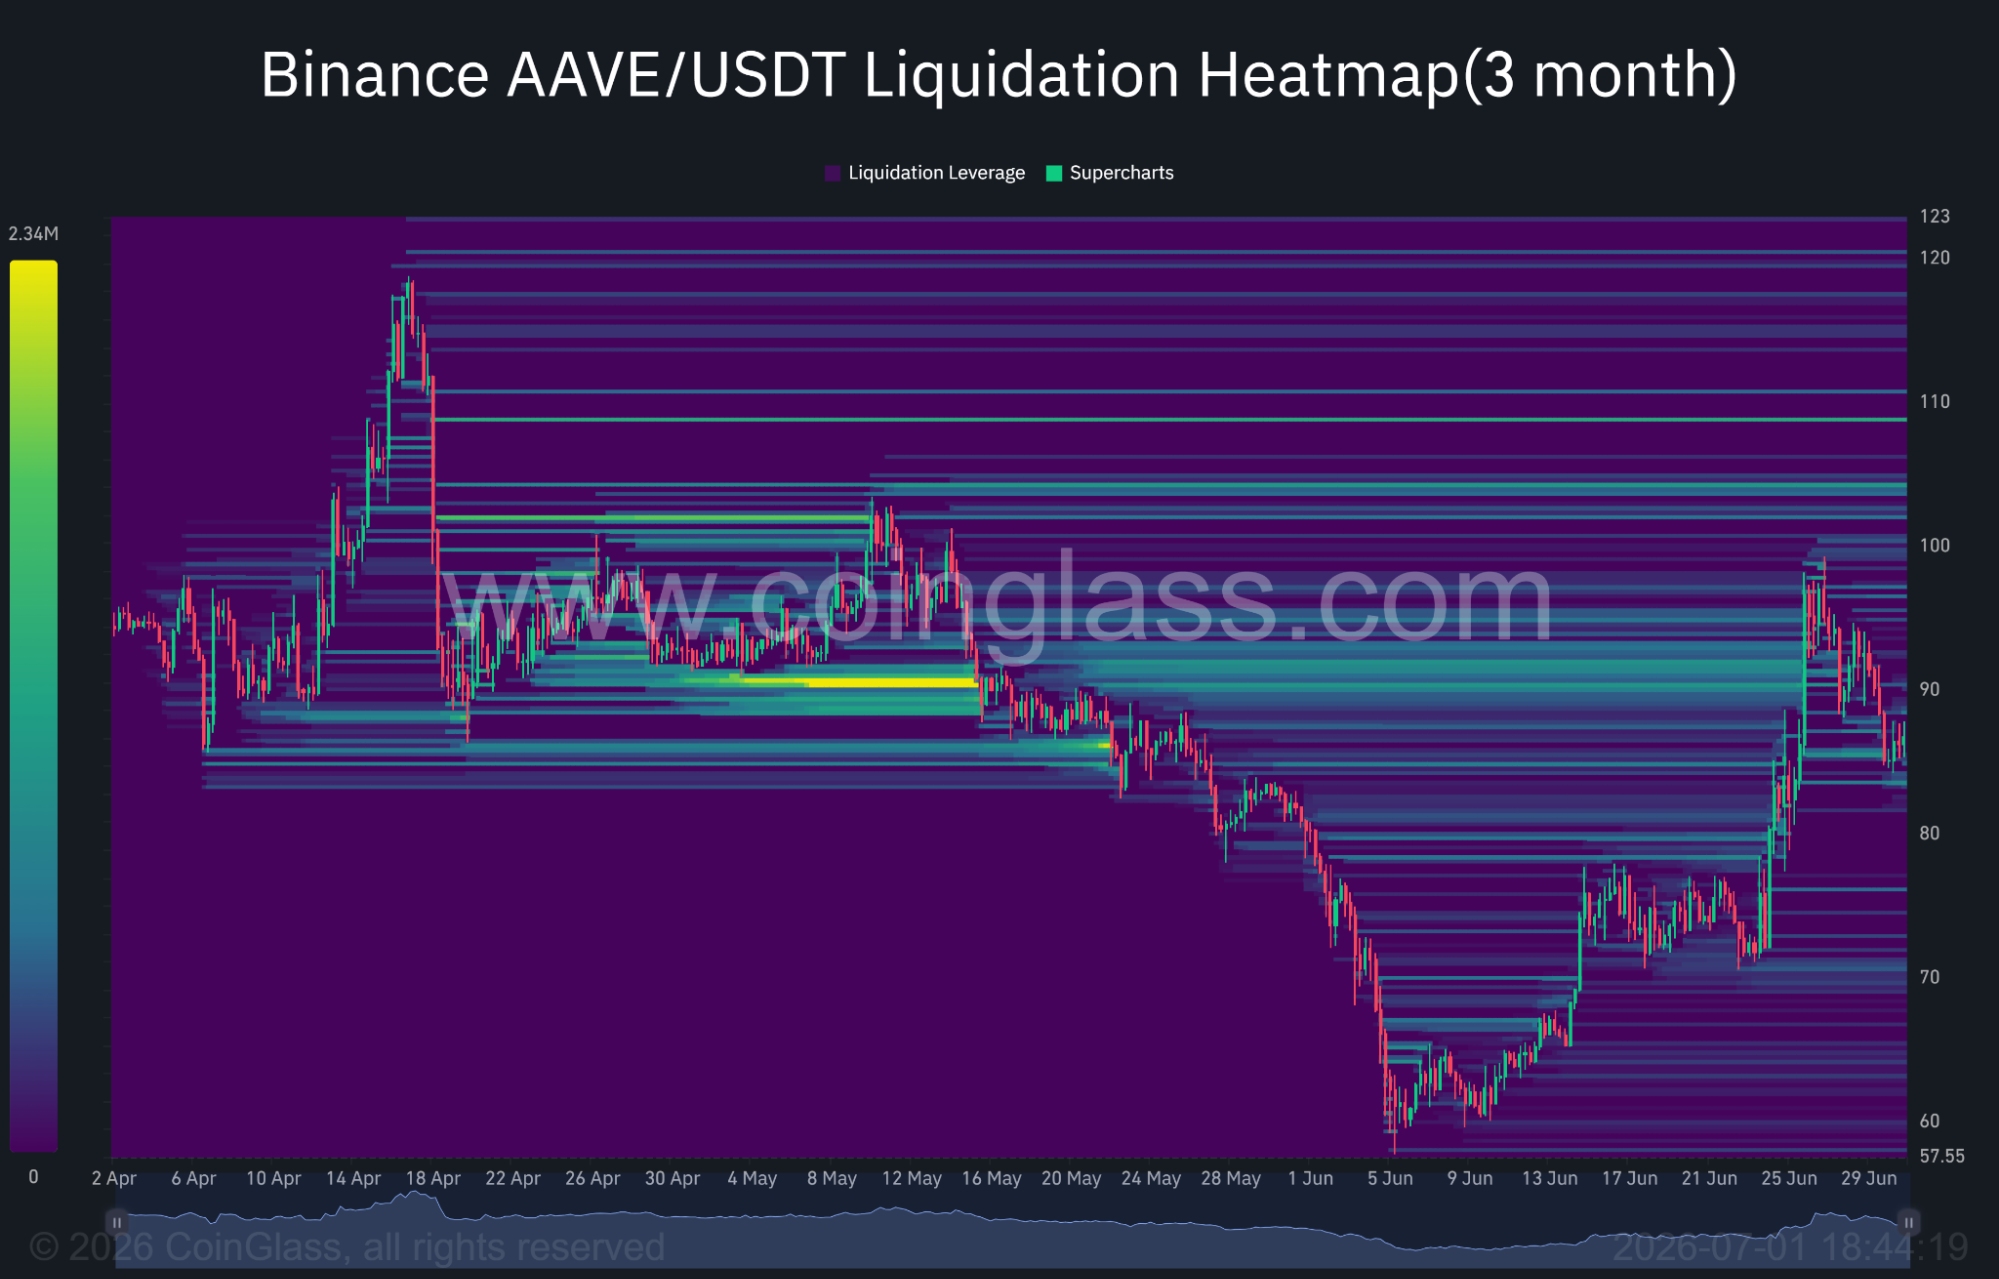
Source: CoinGlass
What’s next for Aave?
The combination of rising user adoption, strengthening on-chain metrics, and a resilient technical structure suggests Aave’s rally may still have room to run.
However, prospective traders and investors will likely monitor short-term momentum indicators closely to determine whether the current correction has fully played out before positioning for another higher push.
Source:: AAVE Price Surges by 14% as User Activity Hits Highest Growth Rate Since 2021