Key highlights:
data presents a more balanced picture than the charts. The market cap of Stellar fell from about $6.6 billion to $5.9 billion within the observation timeframe. This equals to $700 million, which is a 10.6% decrease. Funds have kept being withdrawn from the ecosystem during the period despite price stabilization.
The second dataset shows the distance at which Stellar is from the all-time high. The price of XLM is currently traded 80% to 82% below its all-time high of $0.9381 recorded in January 2018.
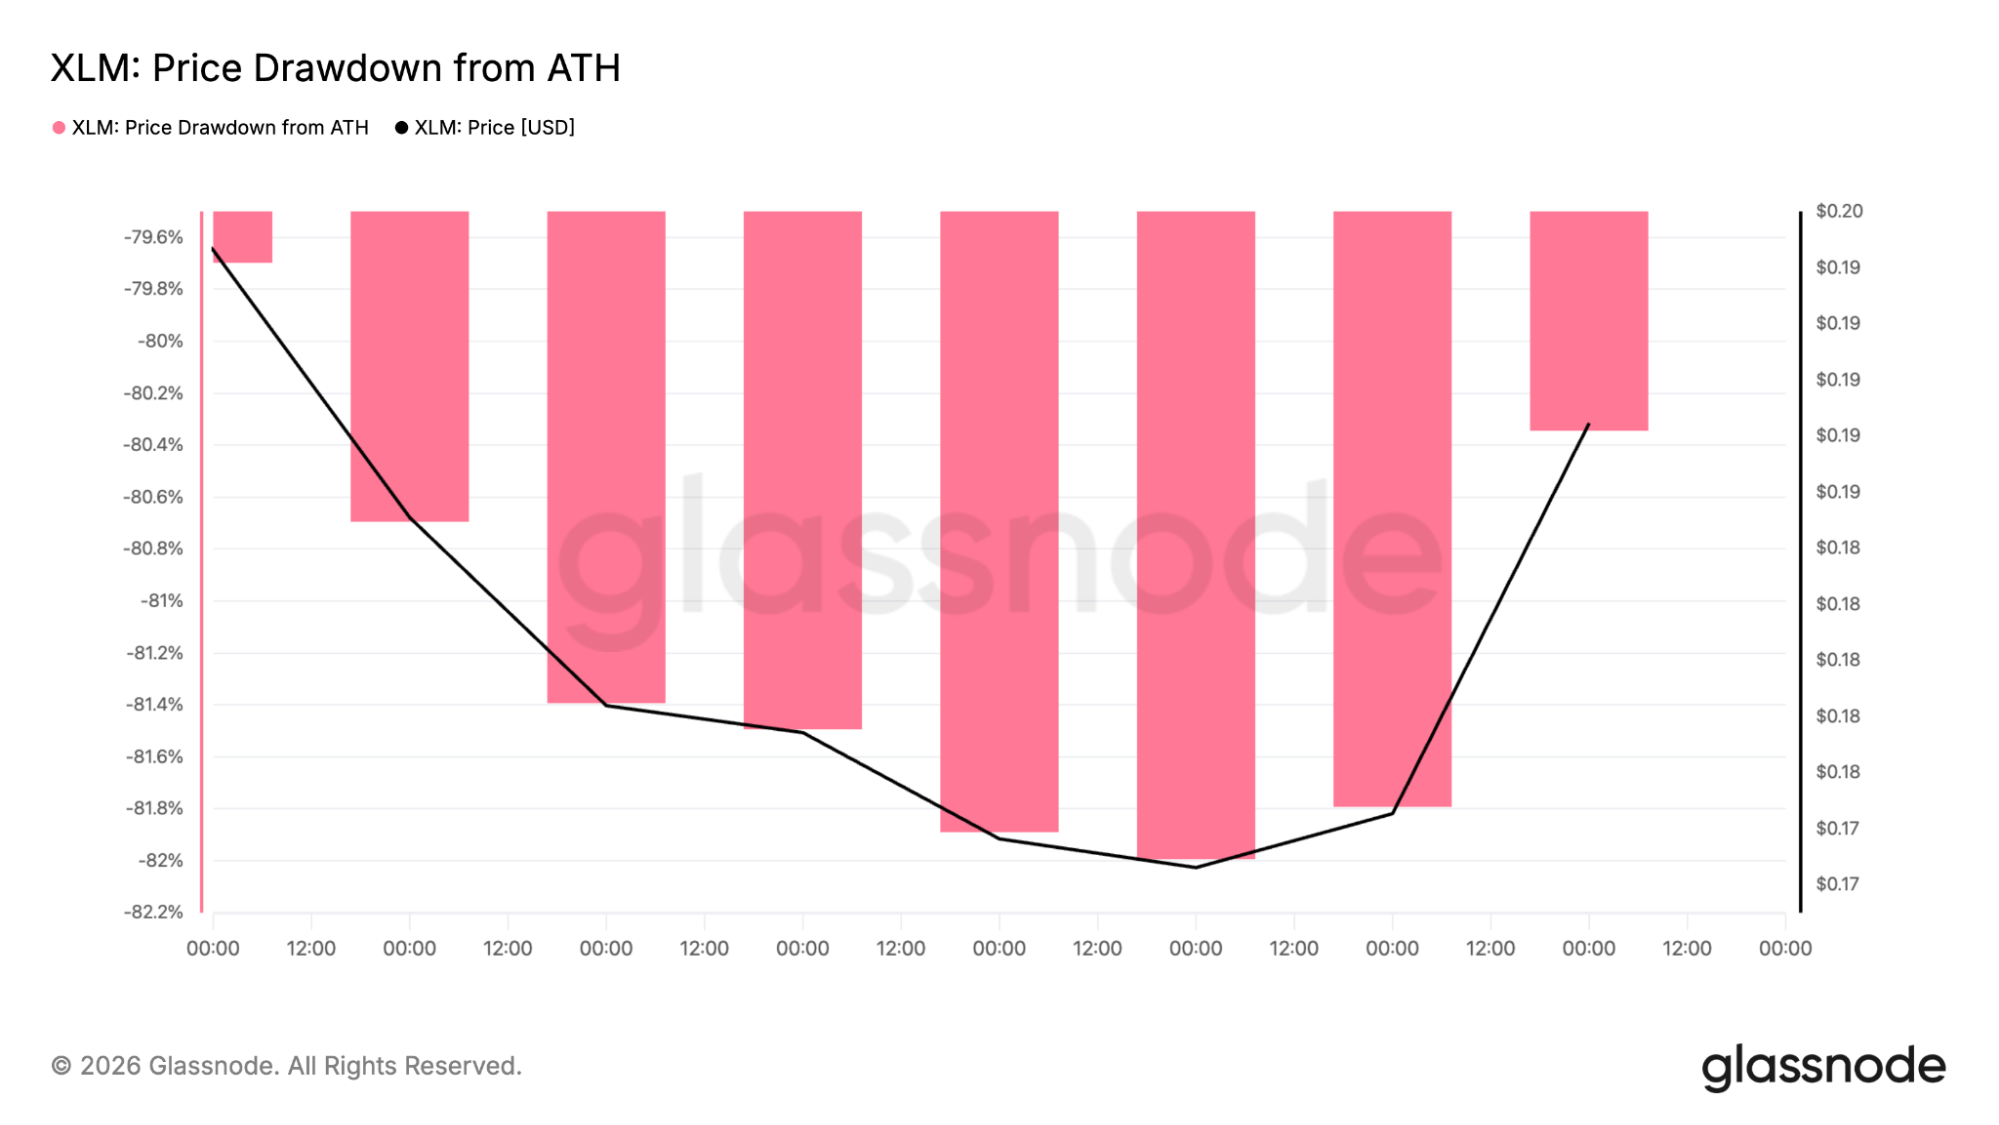
The good news is that the drawdown has not been growing over the timeframe observed. Price has stabilized instead of continuing its previous decline, although that alone is not enough to confirm a lasting recovery.
Stellar institutional adoption keeps expanding
The most notable development comes from Depository Trust & Clearing Corporation (DTCC), whose plans are to test the use of the Stellar network to settle tokenized Russell 1000 stocks and U.S. Treasuries during the first half of 2027.
DTCC processes securities linked to more than $114 trillion in assets across financial markets. If that pilot expands beyond its initial rollout, Stellar would gain direct institutional transaction activity through tokenized asset settlement.
The network has also passed another milestone. More than $3 billion worth of real-world assets are now tokenized on Stellar through firms including Franklin Templeton, WisdomTree and Ondo Finance. Those products generate network activity beyond traditional payments and create additional demand for Stellar’s infrastructure.
Development work also continues. Stellar plans to introduce quantum-resistant signatures in 2027 alongside upgrades targeting transaction throughput of roughly 5,000 transactions per second.
Competition remains strong, though. XRP, stablecoins and other payment-focused blockchains continue competing for cross-border settlement activity. Broader crypto sentiment also remains cautious, with the Fear & Greed Index sitting at 16, placing the market in Extreme Fear territory.
Can the XLM price continue moving higher?
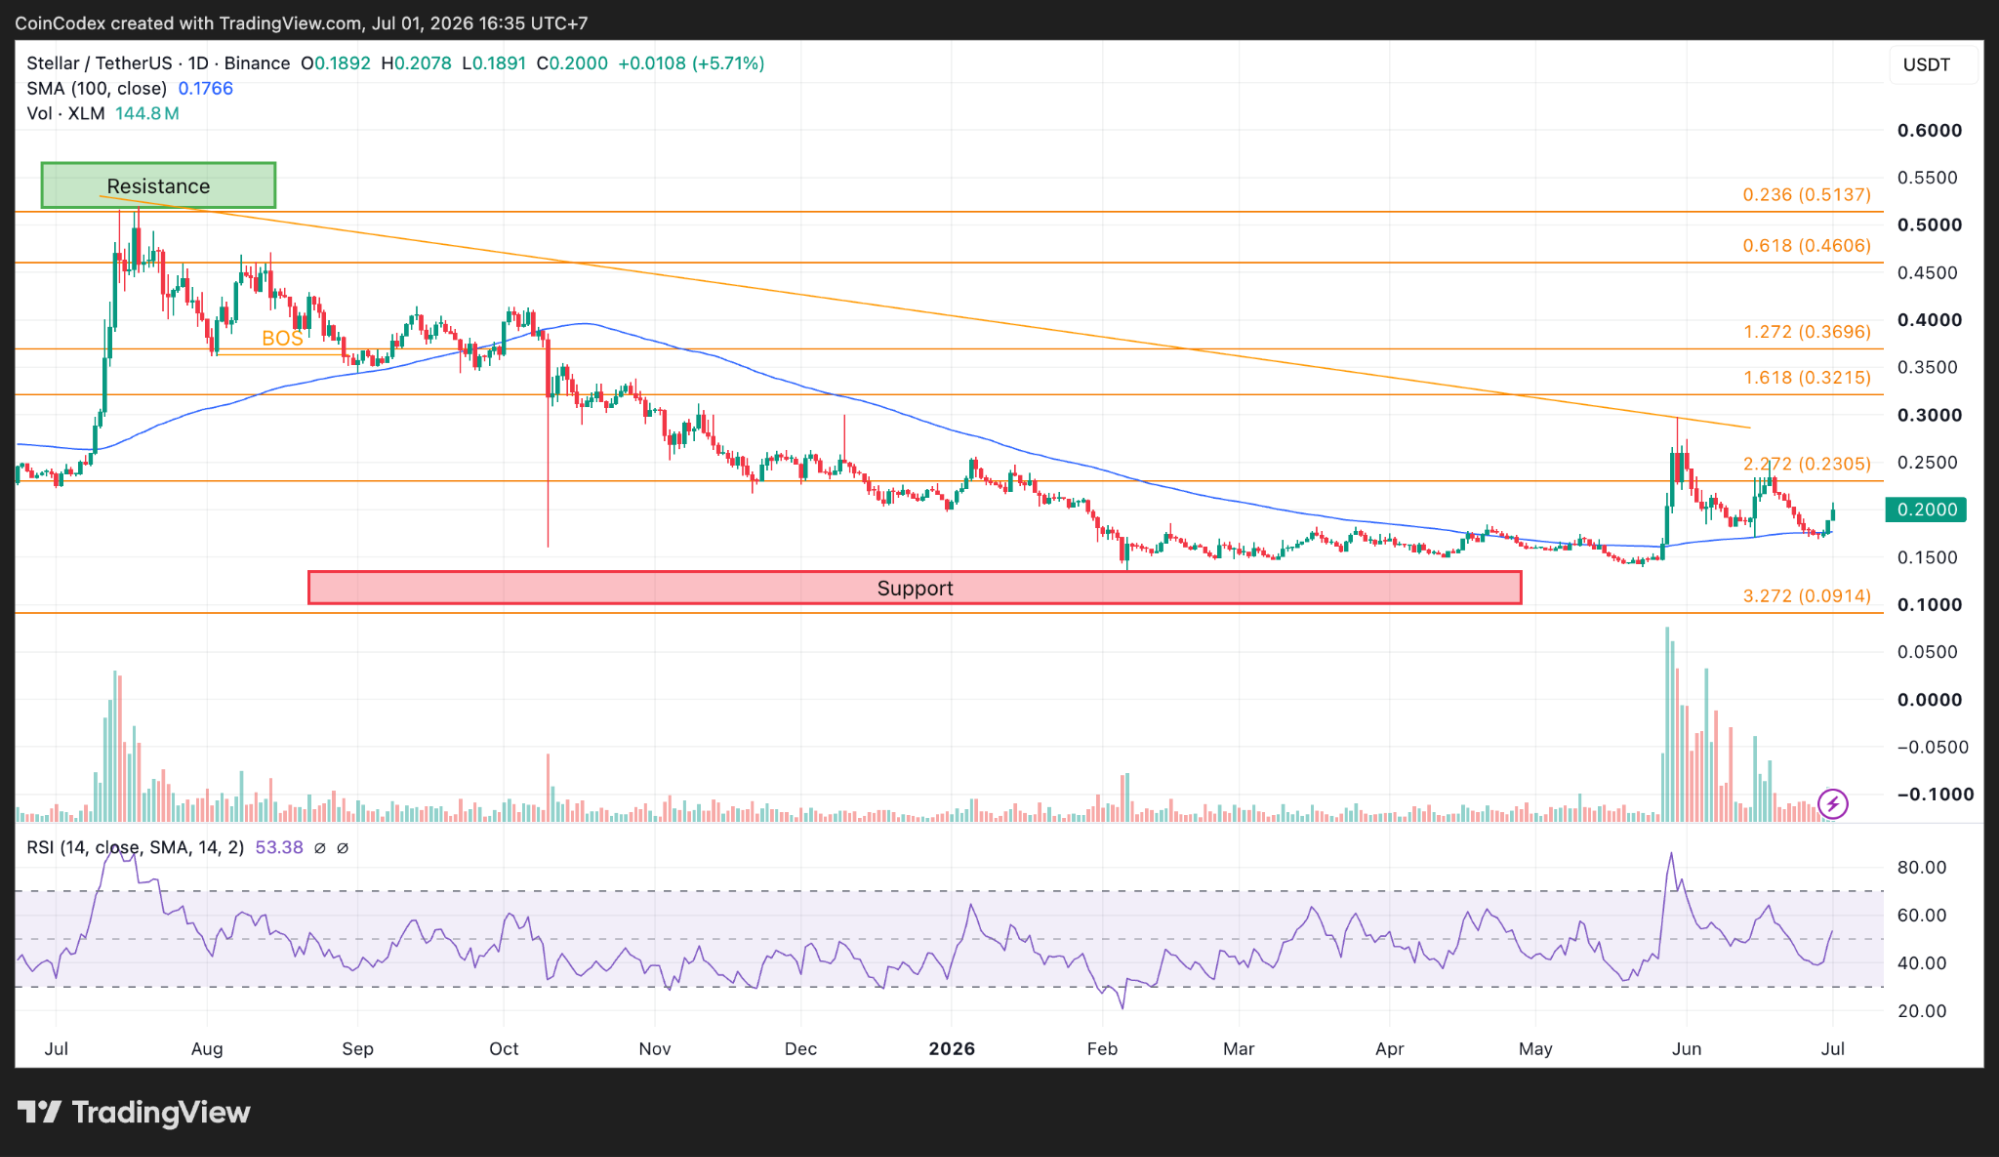
The XLM price has finally started showing technical improvement after months of weakness. The rounding bottom breakout, movement above the moving averages, and better RSI numbers indicate an increase in buying pressure.
The first hurdle is found between $0.2050 and $0.2100. Breaking out of this range will reinforce the bullish scenario and make the $0.2305 Fibonacci resistance level come into play. A move beyond that level would put the higher retracement targets back on the table.
The XLM breakout area needs to hold, and the broader crypto market also needs to cooperate. Losing support near the 9 EMA and 50 SMA would weaken the recovery and send attention back toward the $0.172 to $0.175 support zone.
According to CoinCodex’s 1-month XLM price prediction, the price could reach $0.2357, pointing to moderate upside if buyers continue defending the breakout zone and reclaim resistance around $0.2050 before testing the $0.2305 Fibonacci level.
Source:: Stellar Price Prediction: Can XLM Build on Its +11% Price Breakout as Institutional Adoption Grows?