Key highlights:
- Gold fell after topping above $5,600, but analysts argue the correction may still fit inside a larger macro bull cycle.
- Rising oil prices, stronger USD demand, and fading Fed rate-cut expectations all added pressure to the gold price.
- Key support now sits near $4,300 as traders watch whether gold can stabilize before another move higher.
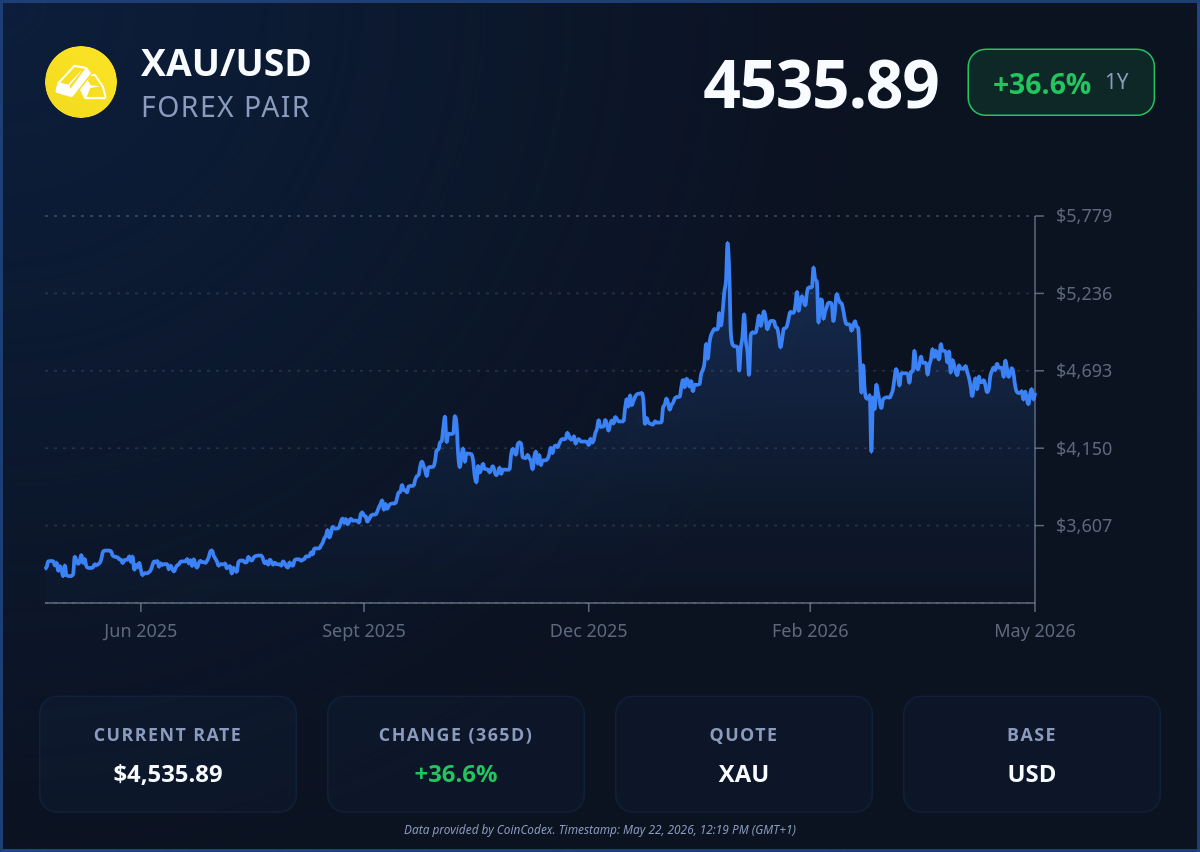
Gold has faced an extremely harsh correction following a bull run which is one of the strongest rallies experienced by the market in decades. In early 2026, the gold price had crossed the $5,600 mark until it collapsed on itself.
Commodity analyst Graddhy warned near the highs that the gold price was reaching a major cycle resistance zone. At the time, many traders pushed back because gold still looked unstoppable. But the quarterly candle that followed turned deeply bearish, and the correction began almost immediately after price tagged the upper trendline on his long-term chart.
Why the gold price fell so fast
A lot of traders expected gold to keep rallying because inflation fears and geopolitical tensions were still everywhere. But the move lower had more to do with the global dollar system than weakness in gold itself.
We had a look at a market breakdown shared by ThePenguinBTC, and the core argument centered around energy markets and the US dollar. About 20% of global seaborne oil moves through the Strait of Hormuz. Once fears about supply disruptions started rising, oil prices climbed fast.
The need for dollars led to increased pressure on the value of gold. Gold is traded in dollars around the world; therefore, when dollars strengthen too rapidly, even against the favorable market environment, XAU/USD will likely suffer.
The market also started rethinking expectations around Federal Reserve rate cuts. Gold had benefited heavily from the idea that lower rates were coming later in the year. But once energy prices started climbing again, inflation concerns returned, making rapid rate cuts less likely.
There was also pressure coming from leveraged funds. Large portfolio managers often hold gold alongside stocks, bonds, and commodities using borrowed capital. Once volatility started spreading through multiple markets, some firms needed liquidity quickly. Gold became one of the easiest profitable positions to sell.
Another theory circulating through the market is that some energy-importing governments may have sold portions of their gold reserves to raise dollar liquidity during the oil spike. That would explain why the gold price weakened during a period when many traders expected safe-haven buying instead.
The bigger bull market thesis is still alive
Even after the correction, the long-term structure behind the gold price still looks bullish on the macro charts. We had a look at Graddhy’s Kondratiev Wave analysis, and the framework places gold inside the third major bull leg of the current economic supercycle.
Gold hit that upper red line, and back then I said a top was probably here. Got some heat for that but that candle then turned into a huge bearish quarterly candle.
The bull is still very much on, but all bull markets have larger corrections and consolidations. https://t.co/FUDvy2hb5z pic.twitter.com/cFbnCmpJbd— Graddhy – Commodities TA+Cycles (@graddhybpc) May 20, 2026
Kondratiev Waves are long economic cycles that usually stretch across 50 to 60 years and are often linked to inflation periods, debt expansion, and major monetary transitions. The chart indicates that the ongoing fifth Kondratiev Wave would last until the late 2020s or even into the early 2030s. Within that period, the objective for the long-term gold price is about $15,000 per ounce.
This price seems like an outrageous figure initially, but gold has already jumped from below $2,000 previously to above $5,600 within the same year. The market has already proven how powerful this cycle can become once momentum accelerates.
The current correction may simply be the type of reset that larger bull markets go through. Gold has historically experienced 20% to 40% declines during previous secular uptrends before continuing higher later. That is part of why Graddhy’s original warning mattered.
What the gold price chart looks like now
We had a look at the daily chart, and the market is still trying to stabilize after the aggressive selloff. The gold price lost its 100-day simple moving average near $4,799, which had acted as support throughout most of the rally.
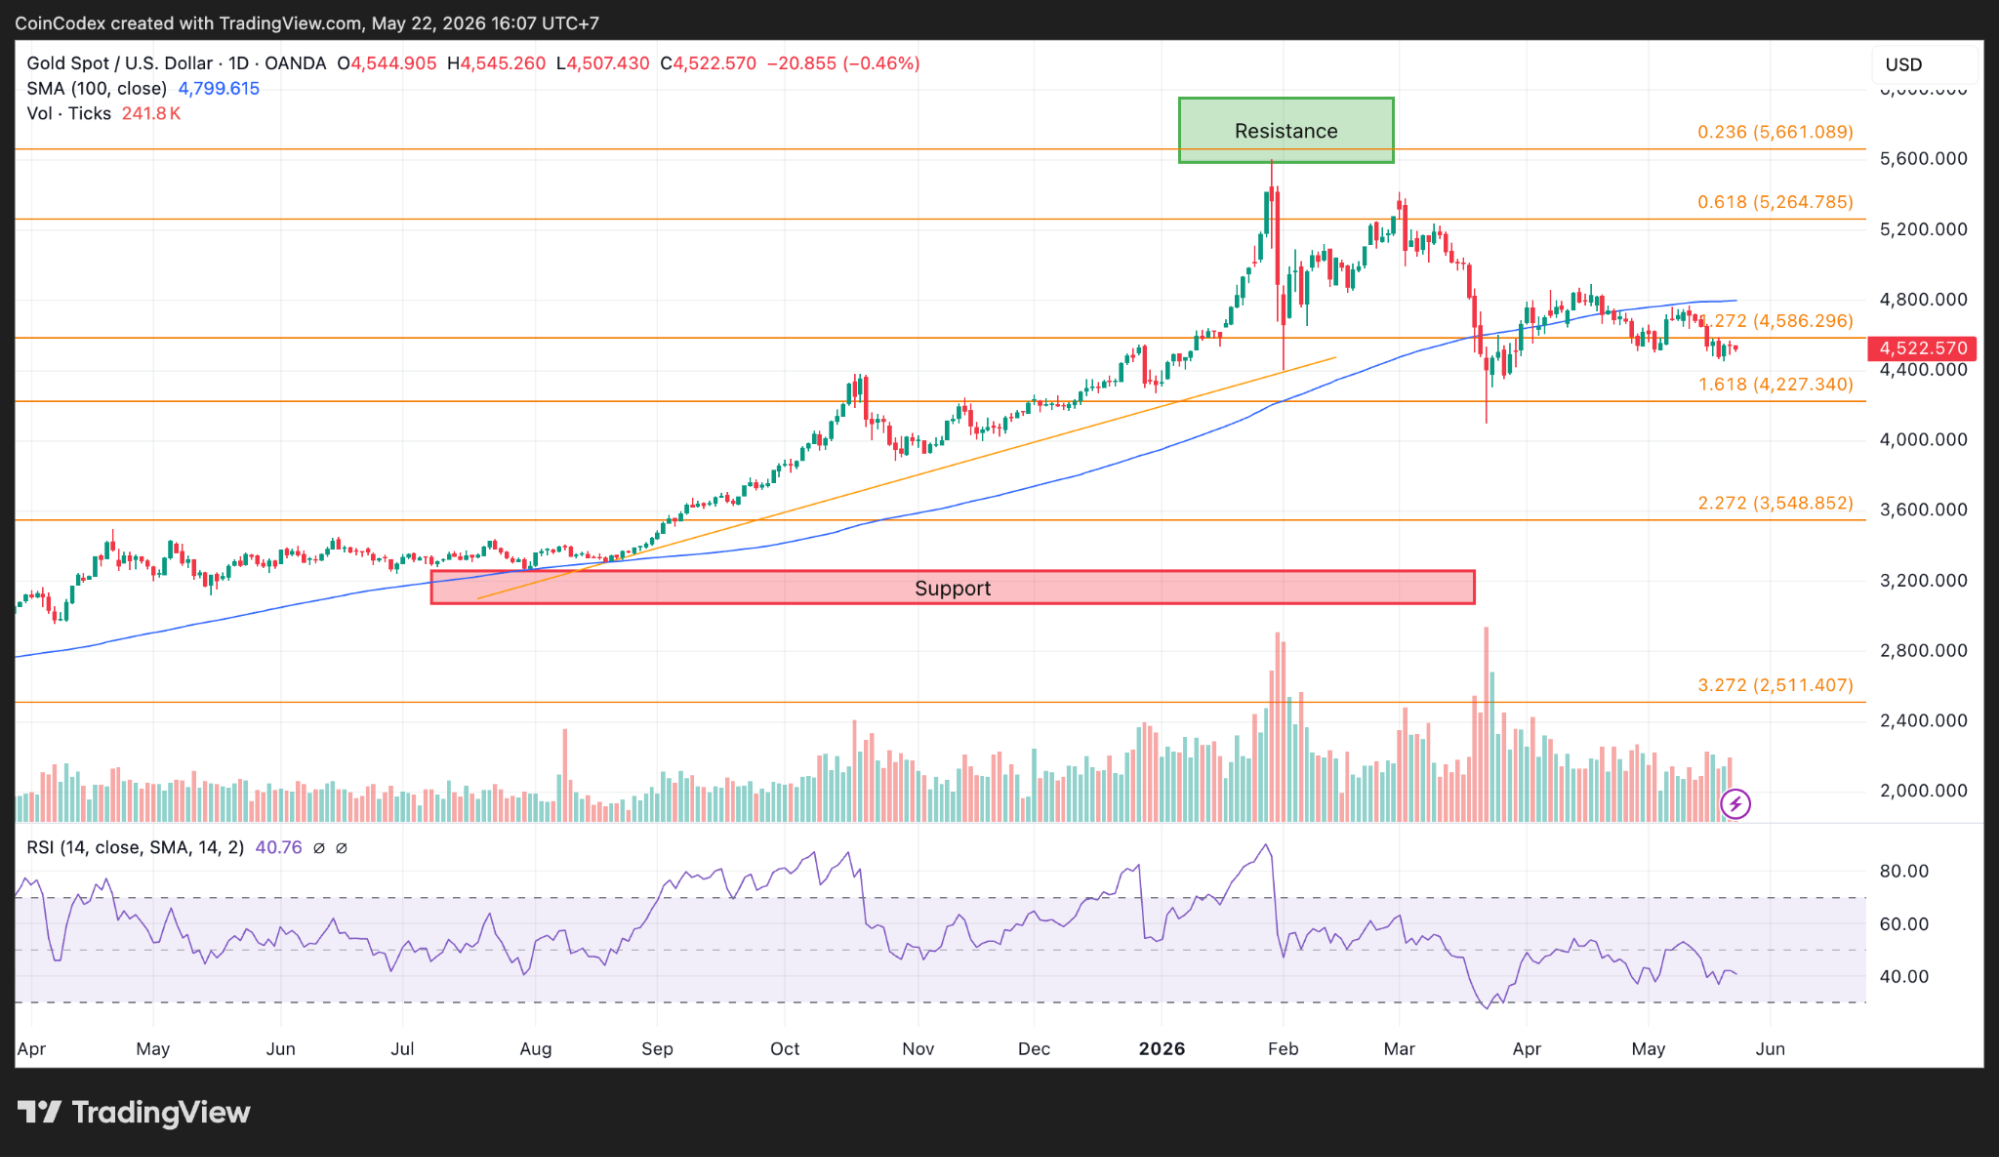
Daily gold price chart analysis
Momentum indicators also cooled sharply. The daily RSI dropped toward 40.76 after spending months in overbought territory. The correction dragged gold from the $5,600–$5,700 area down toward the mid-$4,000 range. Some key Fibonacci supports have become significant.
The closest resistance range is located in the range of around $4,650 and $4,800. This range consists of the moving average, which is breached, and also the breakout zone, which could not be defended by the bulls during the downtrend.
Below the market, stronger support sits between roughly $4,212 and $4,300. If the gold price manages to stabilize there, the larger bullish structure still remains intact. A breakdown below that region could open the door toward deeper retracement levels around $3,500–$3,800.
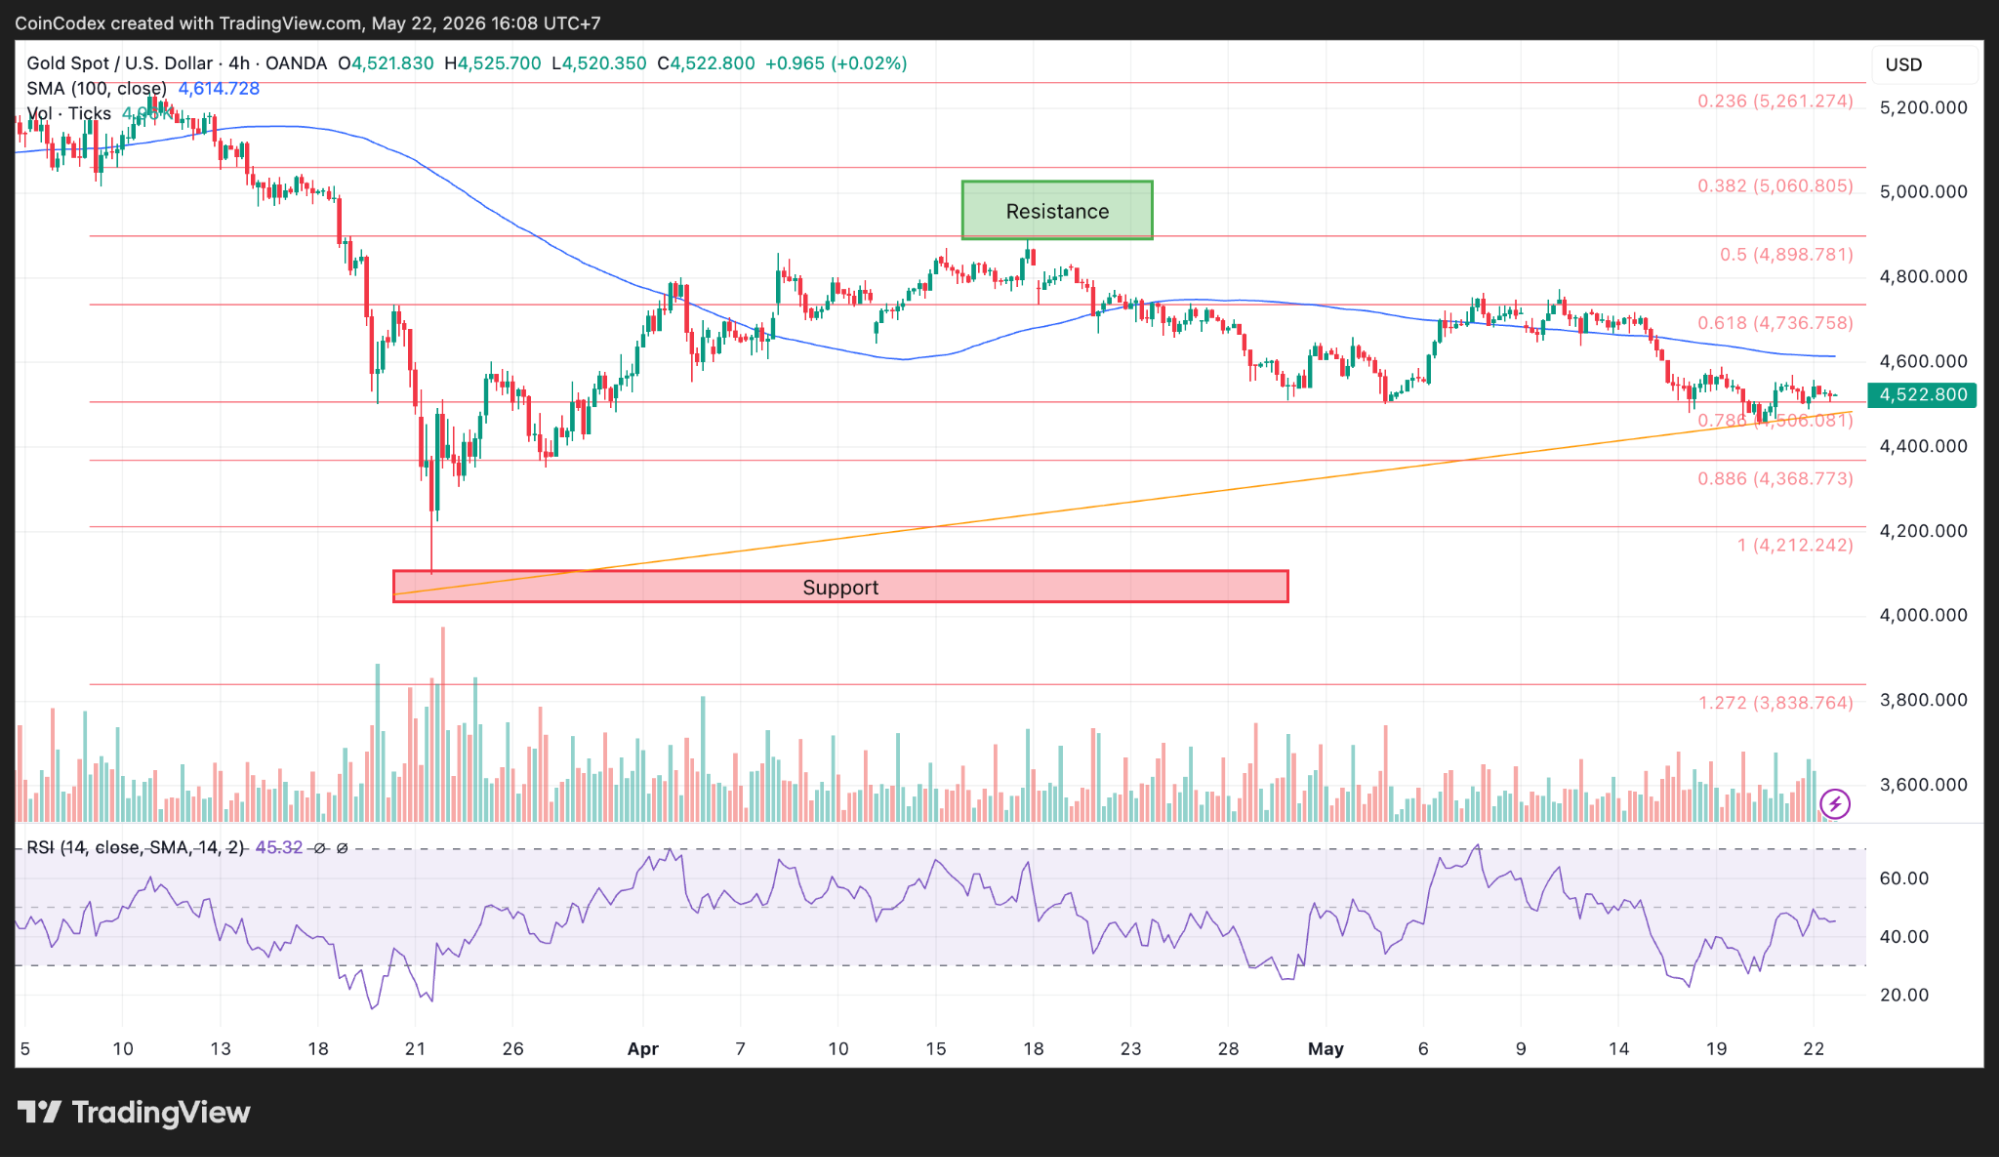
4-hour gold price chart analysis
The 4-hour chart shows consolidation around $4,500–$4,600 levels following the decline. The RSI indicator in the 4-hour chart recovered somewhat to 45.32, demonstrating that the selling pressure has weakened, although bulls have yet to gain full control back.
Where could gold go next?
That is still the biggest question in the market right now. At this stage, most of the larger macro drivers behind gold are still in place. What changed is the pace of the rally. The gold price is no longer moving vertically higher every week.
The market has entered a phase where larger consolidations and violent swings are becoming normal after such a move. If gold can consolidate at levels above $4,300-$4,500 and ultimately make its way back up to $4,800, the next target for bulls would be $5,000 and ultimately higher again.
Currently, the corrective phase looks more like a cooling off after a record-breaking rally rather than the beginning of the end for the bull case on gold. According to CoinCodex’s 1-month gold price prediction, the price could fall toward $4,387.96, which is below the current level and shows that some analysts still expect the correction to continue.
CFDs are complex instruments with a high risk of losing money due to leverage. 80% of retail investors lose money trading CFDs with this provider. Ensure you understand the risks before trading. Past performance is not indicative of future results.
Source:: Gold Price Forecast: Why This Pullback May Still Be Part of the Bigger Bull Market