Key highlights:
XRP is now back to a price level that has been a topic for discussion among traders. Having dropped from $1.20 to $1.0558, XRP has now seen a drop of approximately 12% in a relatively short period of time.
Crypto analyst CasiTrades believes the current setup still points toward a deeper correction, with $1.00 and $0.87 remaining the key downside targets. At the same time, Ripple is rolling out new institutional infrastructure through Ripple Mint, and on-chain activity has been improving.
The XRP price is sitting on a critical support zone
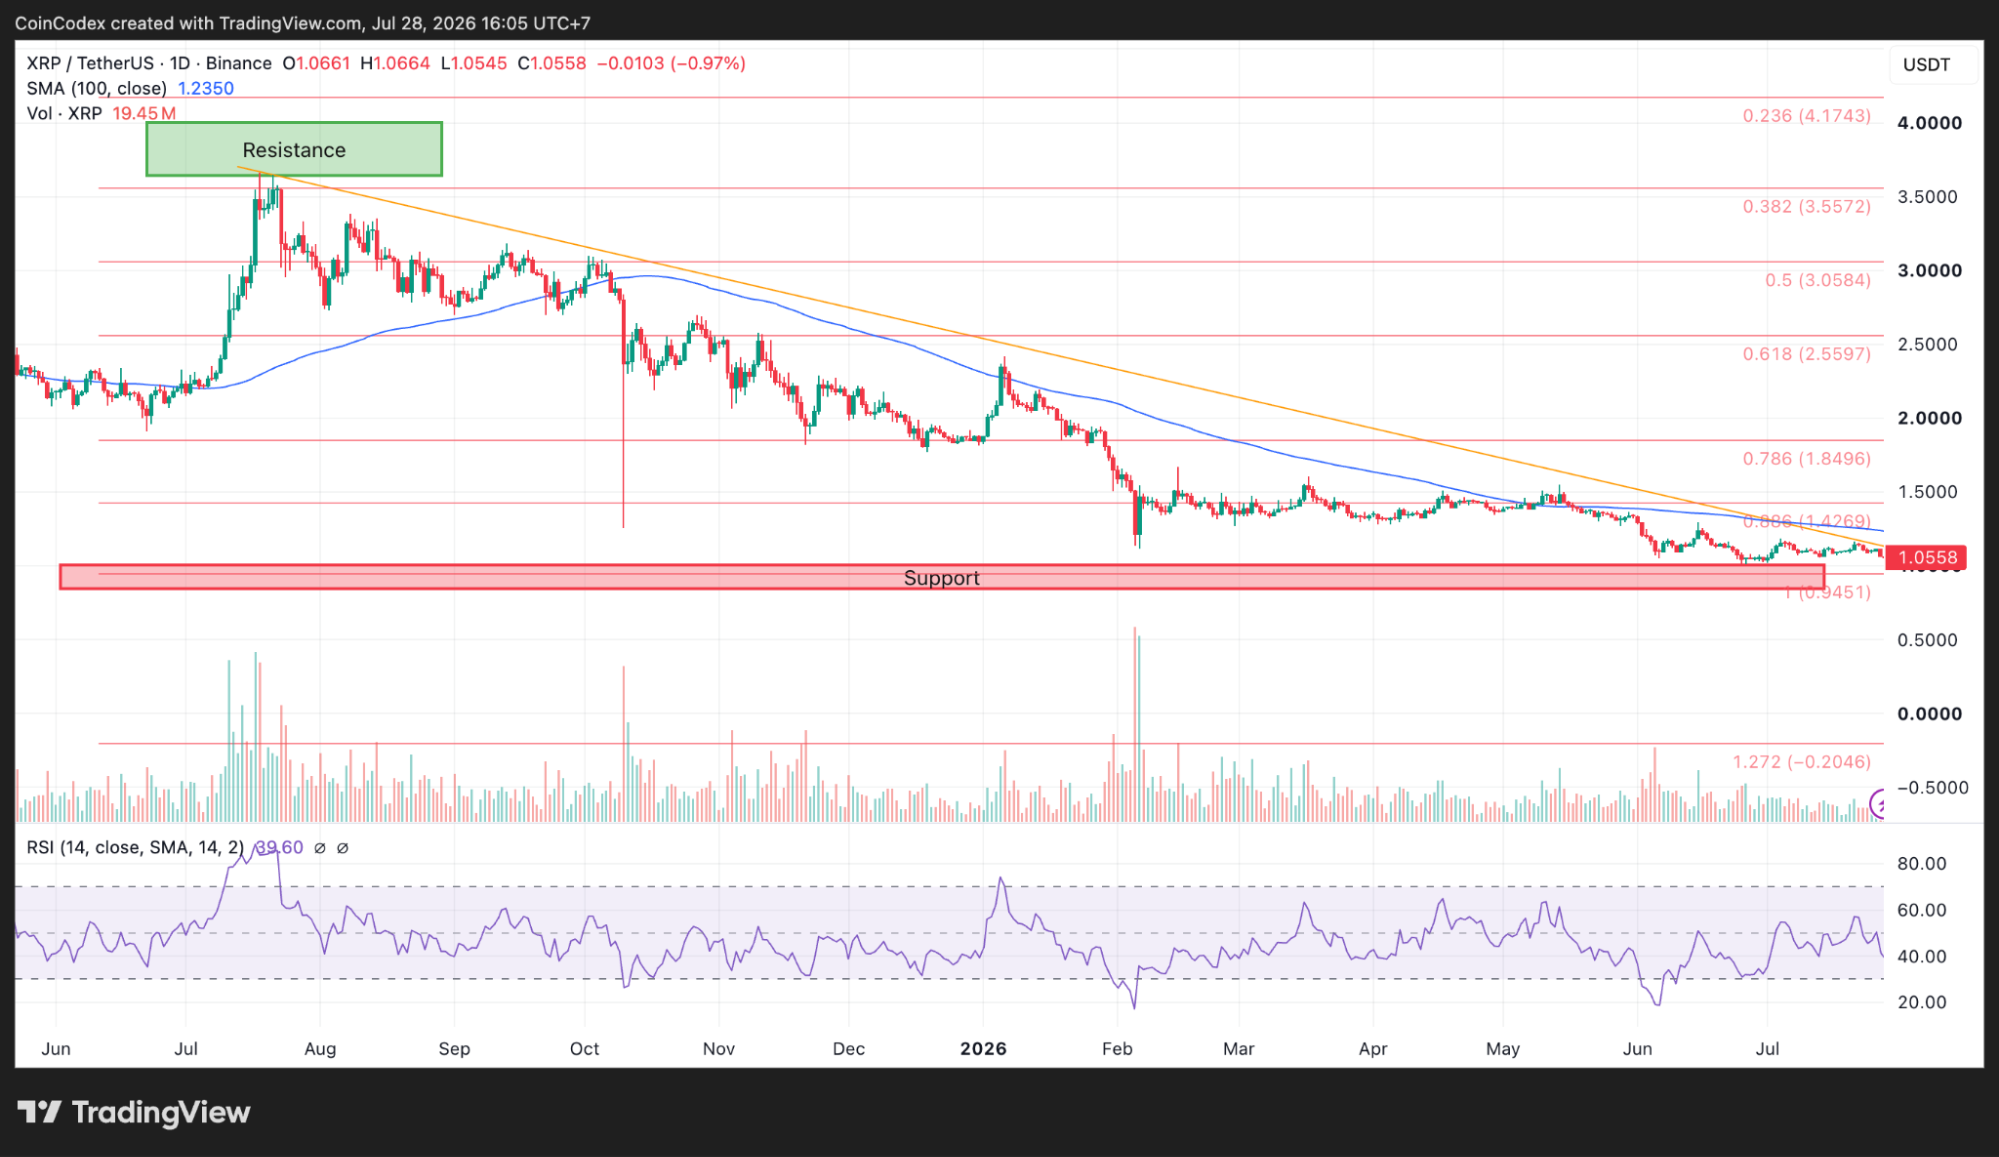
We had a look at Casi’s chart, and the overall trend still seems to be favoring the bears. XRP trades below its 100-day simple moving average at $1.2350, indicating that it is currently trading around 14.5% below a significant resistance level. After the fall from the $4.17 area in December 2025, the chart has been making lower highs and lows.
[TWEET]: https://x.com/CasiTrades/status/2081788136112226368
A closer look at the shorter time frame paints an even tighter picture. On the 4-hour chart, there is support at $1.0545-$1.0061 and resistance at $1.1016-$1.1406. Every attempt to move higher has run into selling pressure below that falling moving average.
Casi argues that the bounce from the $1.09 area was only a temporary reaction inside a larger corrective move. In that scenario, a break below $1.05 could bring $1.00 into focus quickly, with $0.87 remaining the larger macro support target.
The daily and 4-hour XRP charts are saying different things
The XRP daily chart continues showing bearish signs. The XRP price trades around $1.06, which is 14.5% below the 100-day moving average level of $1.2350. XRP remained below this moving average line since the early part of 2026, while the moving average continues pointing downwards.
Daily XRP chart analysis
The most significant technical indicator on the daily chart is the extremely elevated RSI of 89.6. This is a very rare occurrence, often seen after an impressive recovery. It does not necessarily mean that the cryptocurrency will fall next, but it normally indicates a quick rise of the market which needs to consolidate before going further.
In contrast, the 4-hour chart has an altogether different tale to tell. The currency is trading below its 100-period moving average at $1.1016, indicating that the immediate trend remains negative. However, it seems like the negative momentum has been overstretched. This is because the 4 hour Relative Strength Index currently is at 28, an area that traders usually monitor for a bounce back.
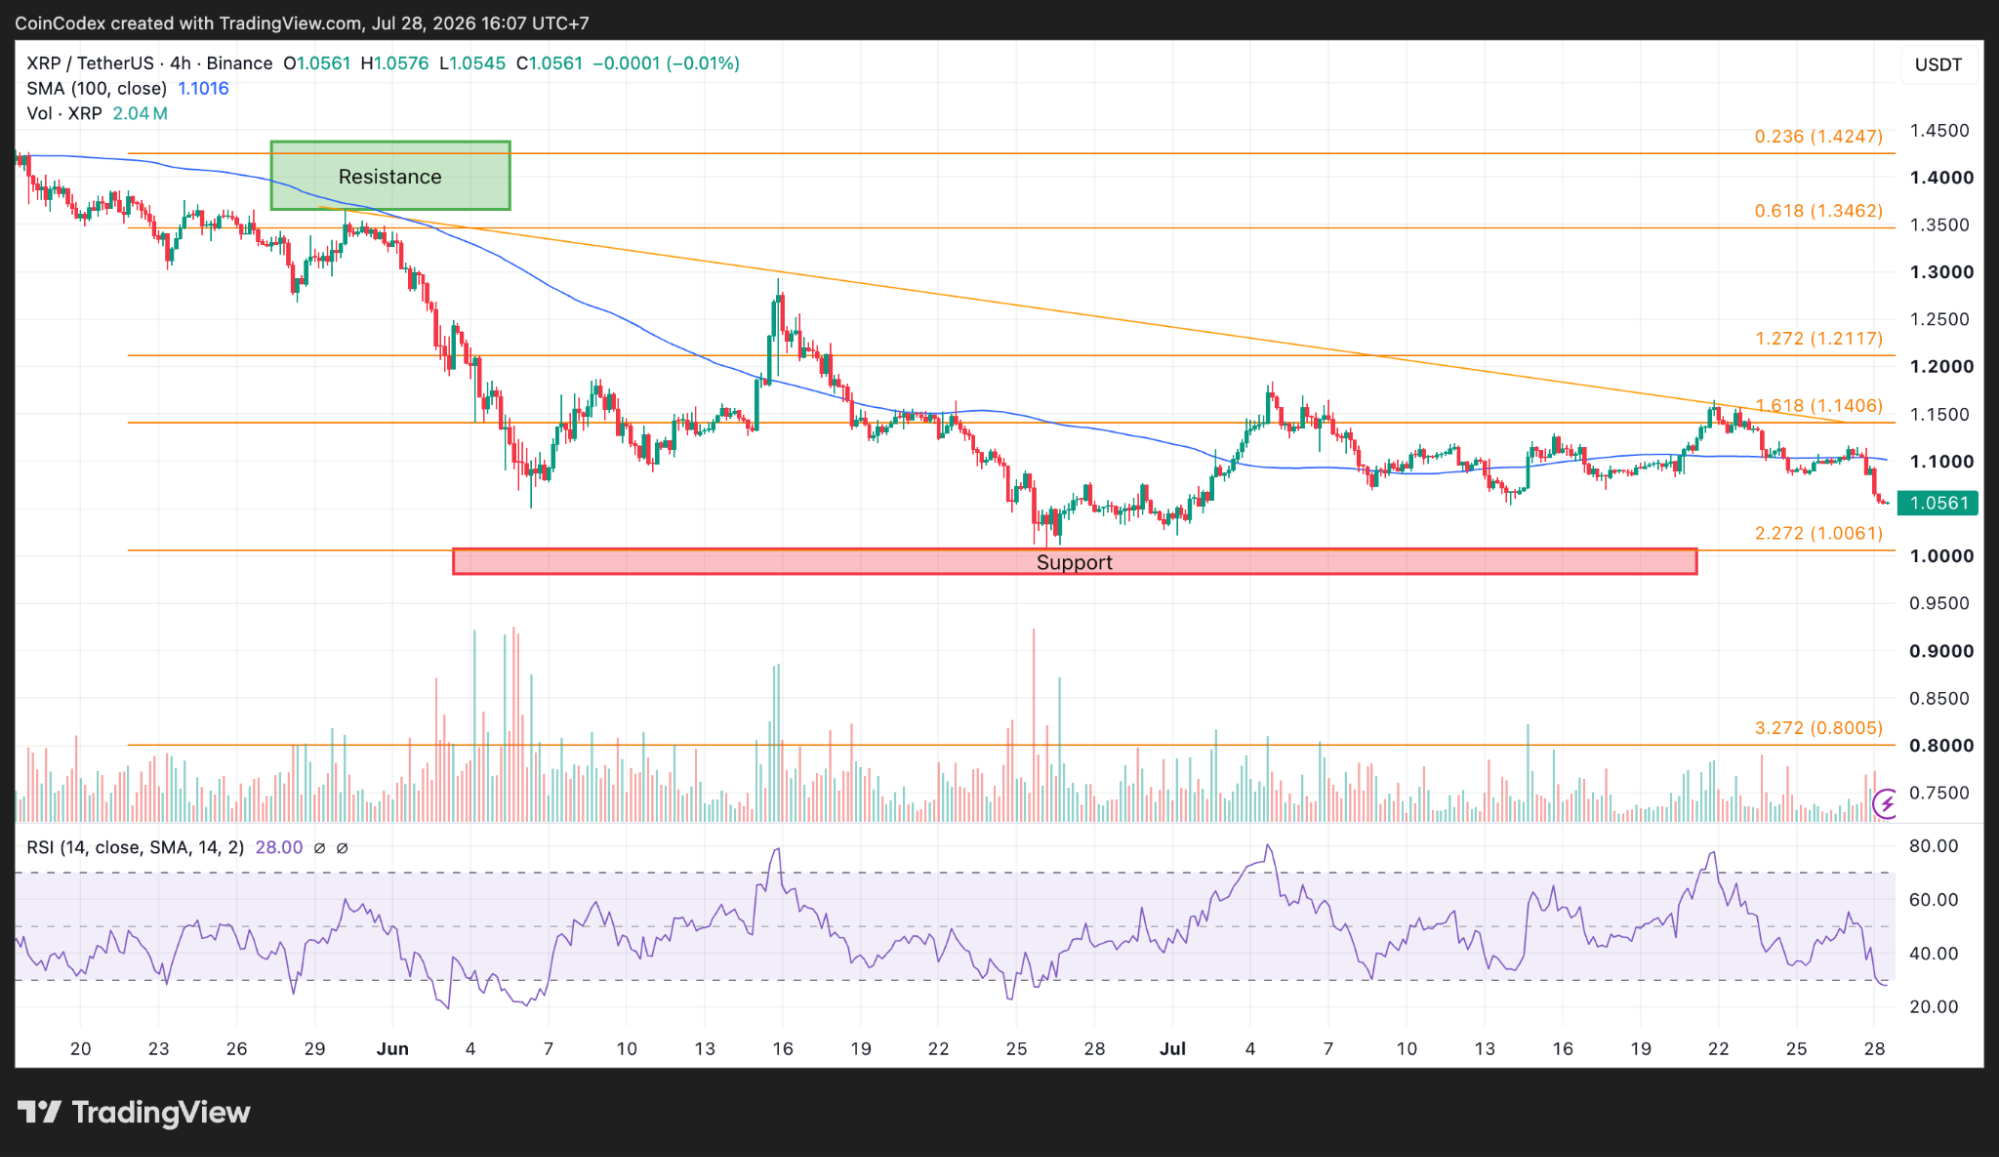
4-Hour XRP chart analysis
When combined, the two charts provide an even more interesting picture. On one hand, the daily chart shows that the rebound is possibly overdone, whereas on the other hand, the 4 hour chart indicates that the most recent selling may be getting exhausted.
Ripple is focusing more on institutions than retail traders
Ripple is spending more time building tools for financial institutions, and Ripple Mint is a good example of that. The platform lets banks, payment providers, and treasury teams mint, redeem, bridge, and manage RLUSD from one dashboard or through APIs.
Ripple has also connected RLUSD to Notabene Flow, a compliance-focused payments network that links more than 2,300 institutions and processes roughly $2 trillion in annualized transaction volume. That matters because it places RLUSD inside payment systems that companies already use instead of creating a separate crypto-only network.
For the XRP price, regulation is still the bigger driver. XRP was categorized as a digital commodity by the SEC and CFTC in March 2026, removing an important regulatory obstacle.
The Digital Asset Market CLARITY Act has already been approved by the House of Representatives and is pending in the Senate. Many analysts feel that an approval of the same could help larger institutions participate in the XRP market through investment products.
It should be remembered that Ripple Mint is a development that favors Ripple Payments and RLUSD more than anything else. It does not result in immediate demand for XRP at any cost, and this is the reason why there has been no change in the price of XRP despite Ripple expanding its payment network for institutions.
XRP on-chain activity is improving
One of the more encouraging signals is coming from the network itself. The number of XRP active addresses increased by about 22.5% to 24,500 from 20,000. The daily transactions also rose to 400,000 from 320,000, which is an increase of about 25%.
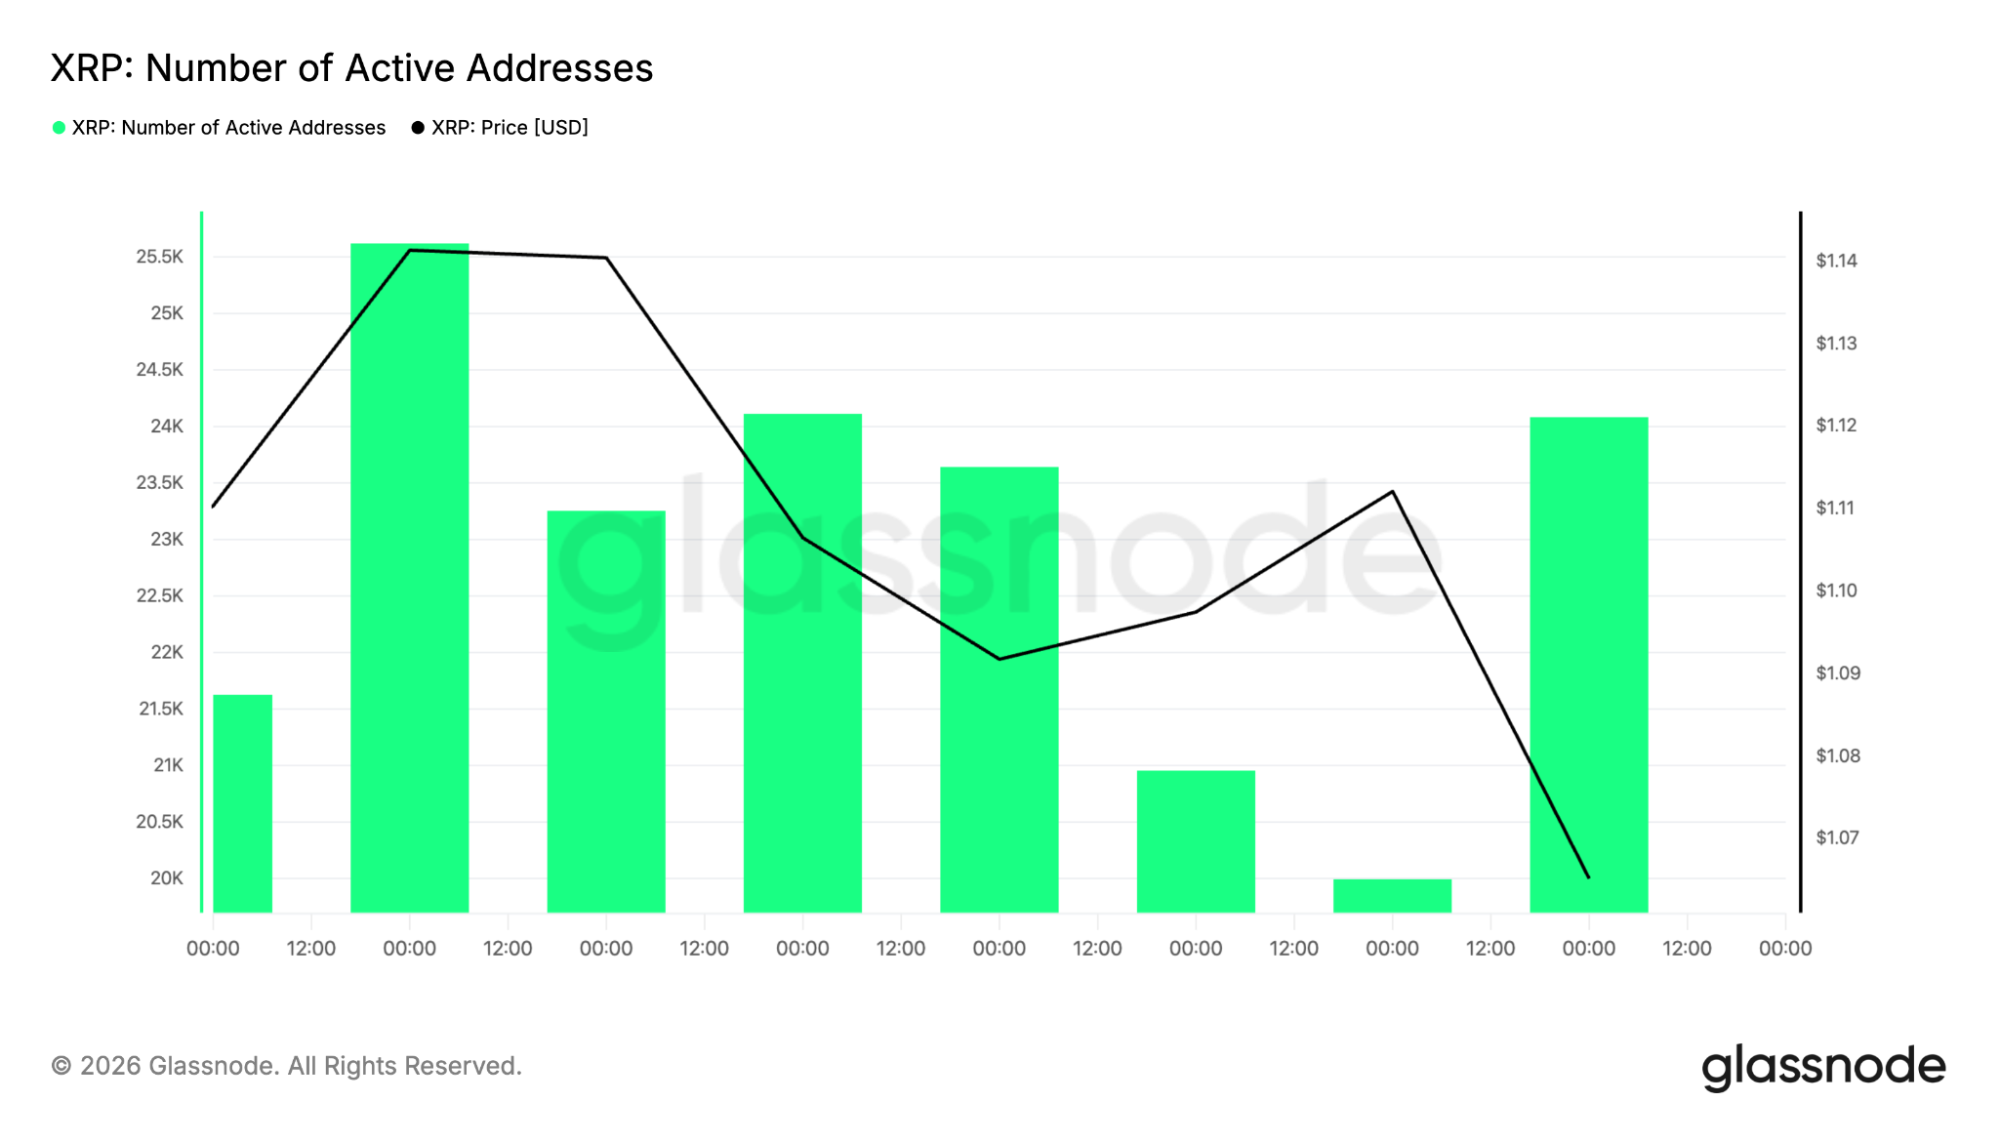
XRP price increased as well over the same period, going up to $1.14 from $1.07 before falling back. Price increases along with network activity are indicative of actual trading demand and not speculative trading.
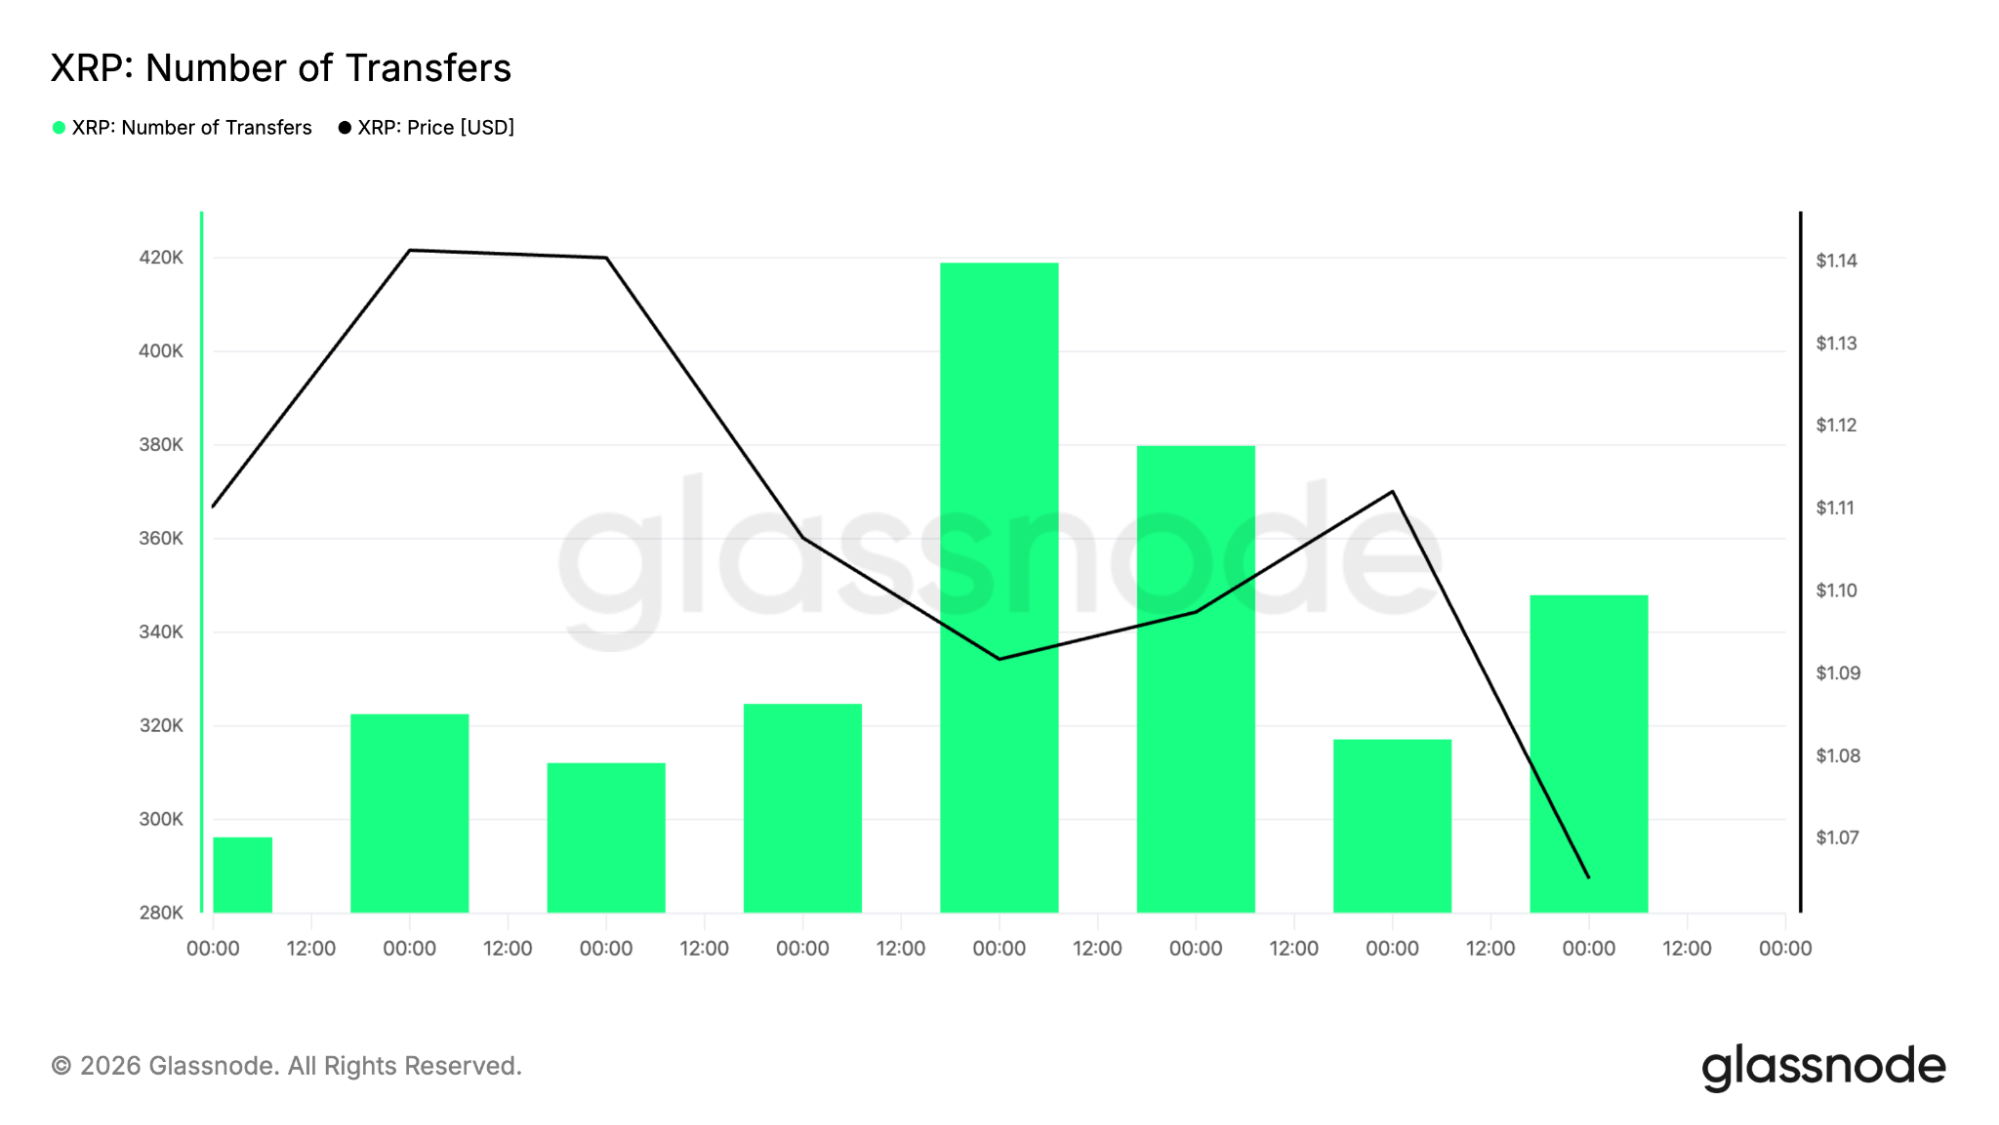
XRP has fewer active addresses than Bitcoin and Ethereum, but the trend is more important right now for traders.
What comes next for the XRP price?
The XRP price finds itself in an extremely tight situation. The buying pressure faces its first resistance at $1.10 and further at $1.14 and even the 100-day moving average at $1.2350. It will be a good indication of the start of recovery from the bigger trend when the daily chart closes above that level.
The sell pressure has its main trigger at $1.05. Breaking below that level would lead to fast targeting of $1.00 and possible $0.87. According to CoinCodex’s 1-month XRP price prediction, the XRP price could trade around $1.18 over the next month, indicating modest upside potential from current levels.
Source:: XRP Price Prediction: XRP’s Next Move Could Be Explosive as the CLARITY Act Nears August Deadline