Key highlights:
- The XRP price is testing a symmetrical triangle, with $1.13 acting as the key breakout level.
- XRPL’s fixCleanup3_2_0 upgrade has secured 85.7% validator support ahead of its expected July 29 activation.
- Stable active addresses and transfer volumes continue supporting the XRP price during consolidation.
XRP is entering a critical phase after trading under pressure for several weeks now. Technical traders are looking at the symmetrical triangle, while Ali Martinez thinks that the breakout over $1.13 can lead to further growth towards $1.35.
It is more than just charts going on. The XRP Ledger has initiated the two-week countdown for the implementation of the fixCleanup3_2_0 upgrade as the support from validators surpassed the required 80% mark.
The update will not affect XRP’s tokenomics; however, it will add crucial security features to the network before its blockchain technology gains institutional traction. On top of that, the on-chain activity remains strong. While XRP was consolidating recently, the active addresses and transfers kept growing.
The XRP price is nearing a breakout point
Ali Martinez believes XRP is approaching a decisive moment. His chart shows the token compressing inside a symmetrical triangle after a multi-week decline, with $1.13 acting as the breakout level.
We had a look at the chart, and XRP has dropped from about $1.30 in late June to the $1.03 region, a decline of roughly 20.8%. This resulted in several lower peaks and troughs, while the triangle formation is an indication of volatility reduction as the buyers and sellers fight to gain control.
XRP: BREAKOUT AHEAD!?
The monthly chart is flashing a TD Sequential buy signal, while the hourly chart shows $XRP consolidating inside a symmetrical triangle.
A breakout above $1.13 could open the door to a 20% rally toward $1.35. https://t.co/LSkn4NoAWP pic.twitter.com/8LtBFkCSOE
— Ali Charts (@alicharts) July 16, 2026
The first resistance is at $1.06, with the second one being at $1.13. If the buyers can break this resistance and trade with high volumes, the third resistance will be at $1.21, while Ali Martinez is eyeing $1.35.
Support remains around $1.03. Losing that level could expose the next downside area near $0.95, which has acted as the next major support throughout the correction.
Momentum is improving, but the broader trend has not changed
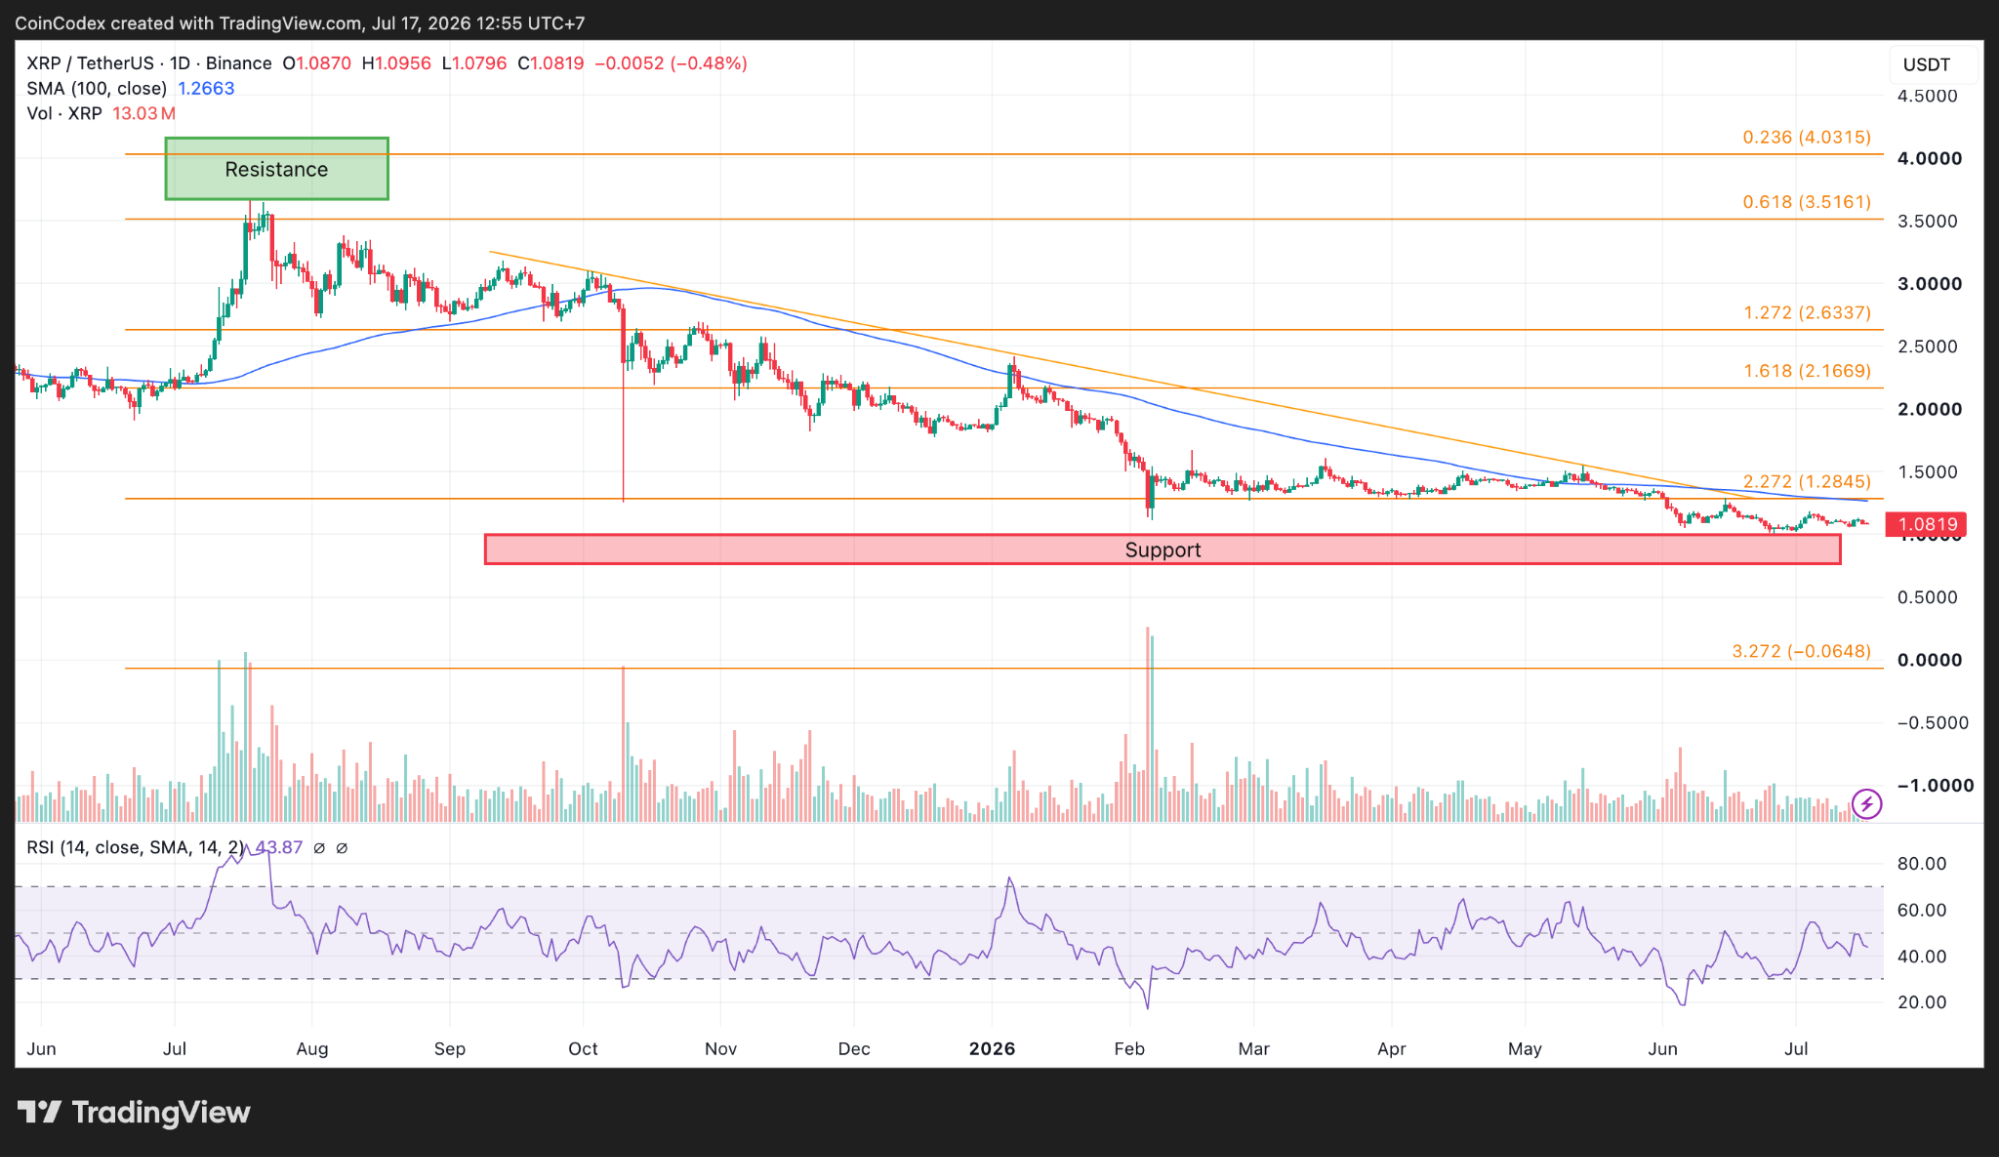
We also reviewed the native XRP charts, and they paint a mixed picture. On the daily chart, the XRP is trading close to $1.0819, 14.6% lower than the 100-day simple moving average of $1.2663. The XRP remains below the moving average line after early 2026, while the moving average line is still falling, which makes the overall trend negative.
Daily XRP chart analysis
However, there is one good sign. On the daily chart, the RSI is rising to 43.87 and is also making higher lows, despite the XRP price making lower lows. This bullish divergence occurs when the downside momentum starts to lose strength, but it does not mean a reversal on its own.
The shorter timeframe shows a similar pattern. We had a look at the 4-hour XRP chart, where the XRP price trades around $1.0806, about 2.1% below the 100-period moving average at $1.1033.
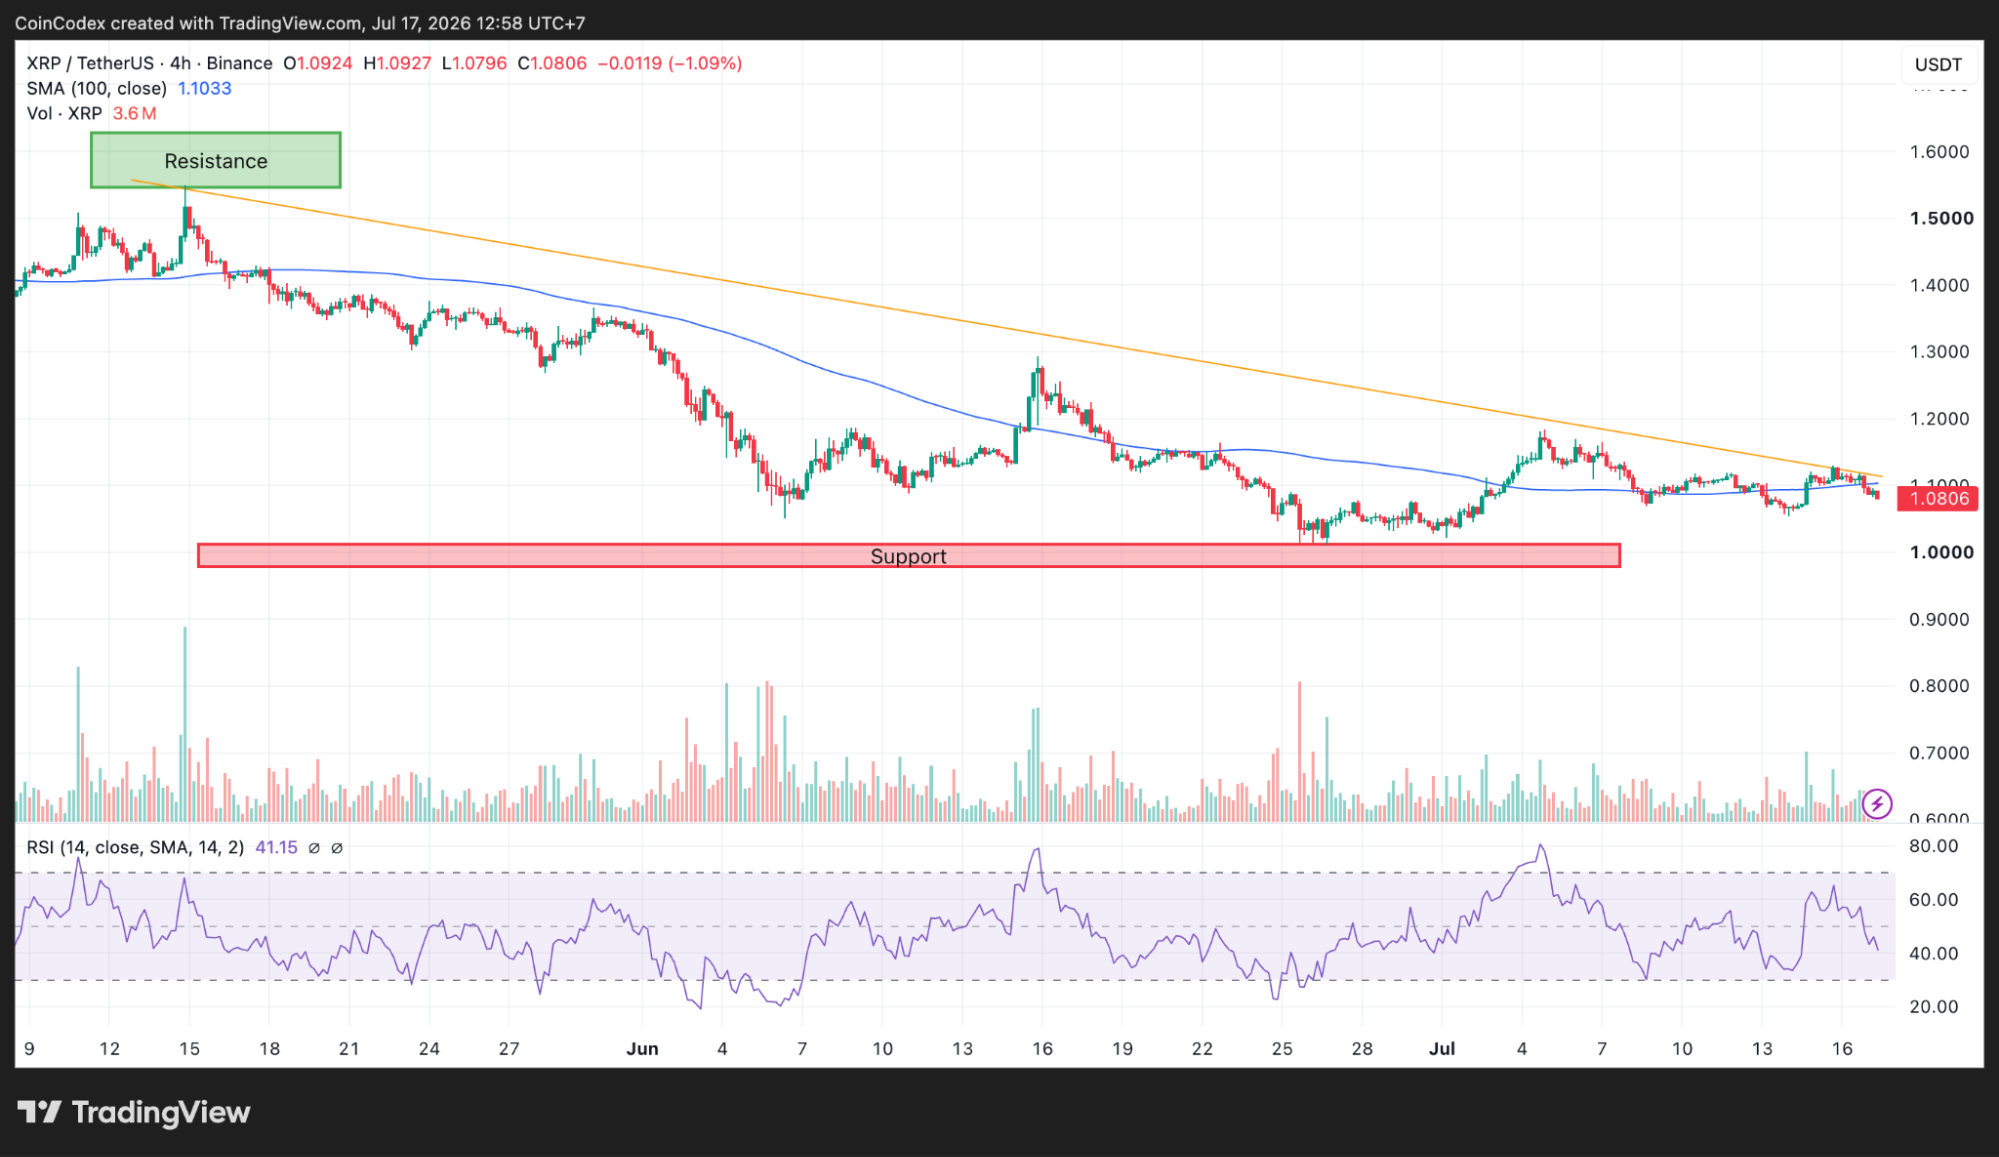
4-Hour XRP chart analysis
The 4-hour RSI stands at 41.15 and has also formed higher lows during the correction. Buyers still need to reclaim the 100-period moving average before momentum turns more constructive. If that happens, resistance comes into view at $1.20, followed by the daily moving average near $1.2663. If sellers stay in control, support remains near $1.0796, followed by the psychological $1.00 level and then $0.90.
On-chain activity continues supporting the recovery
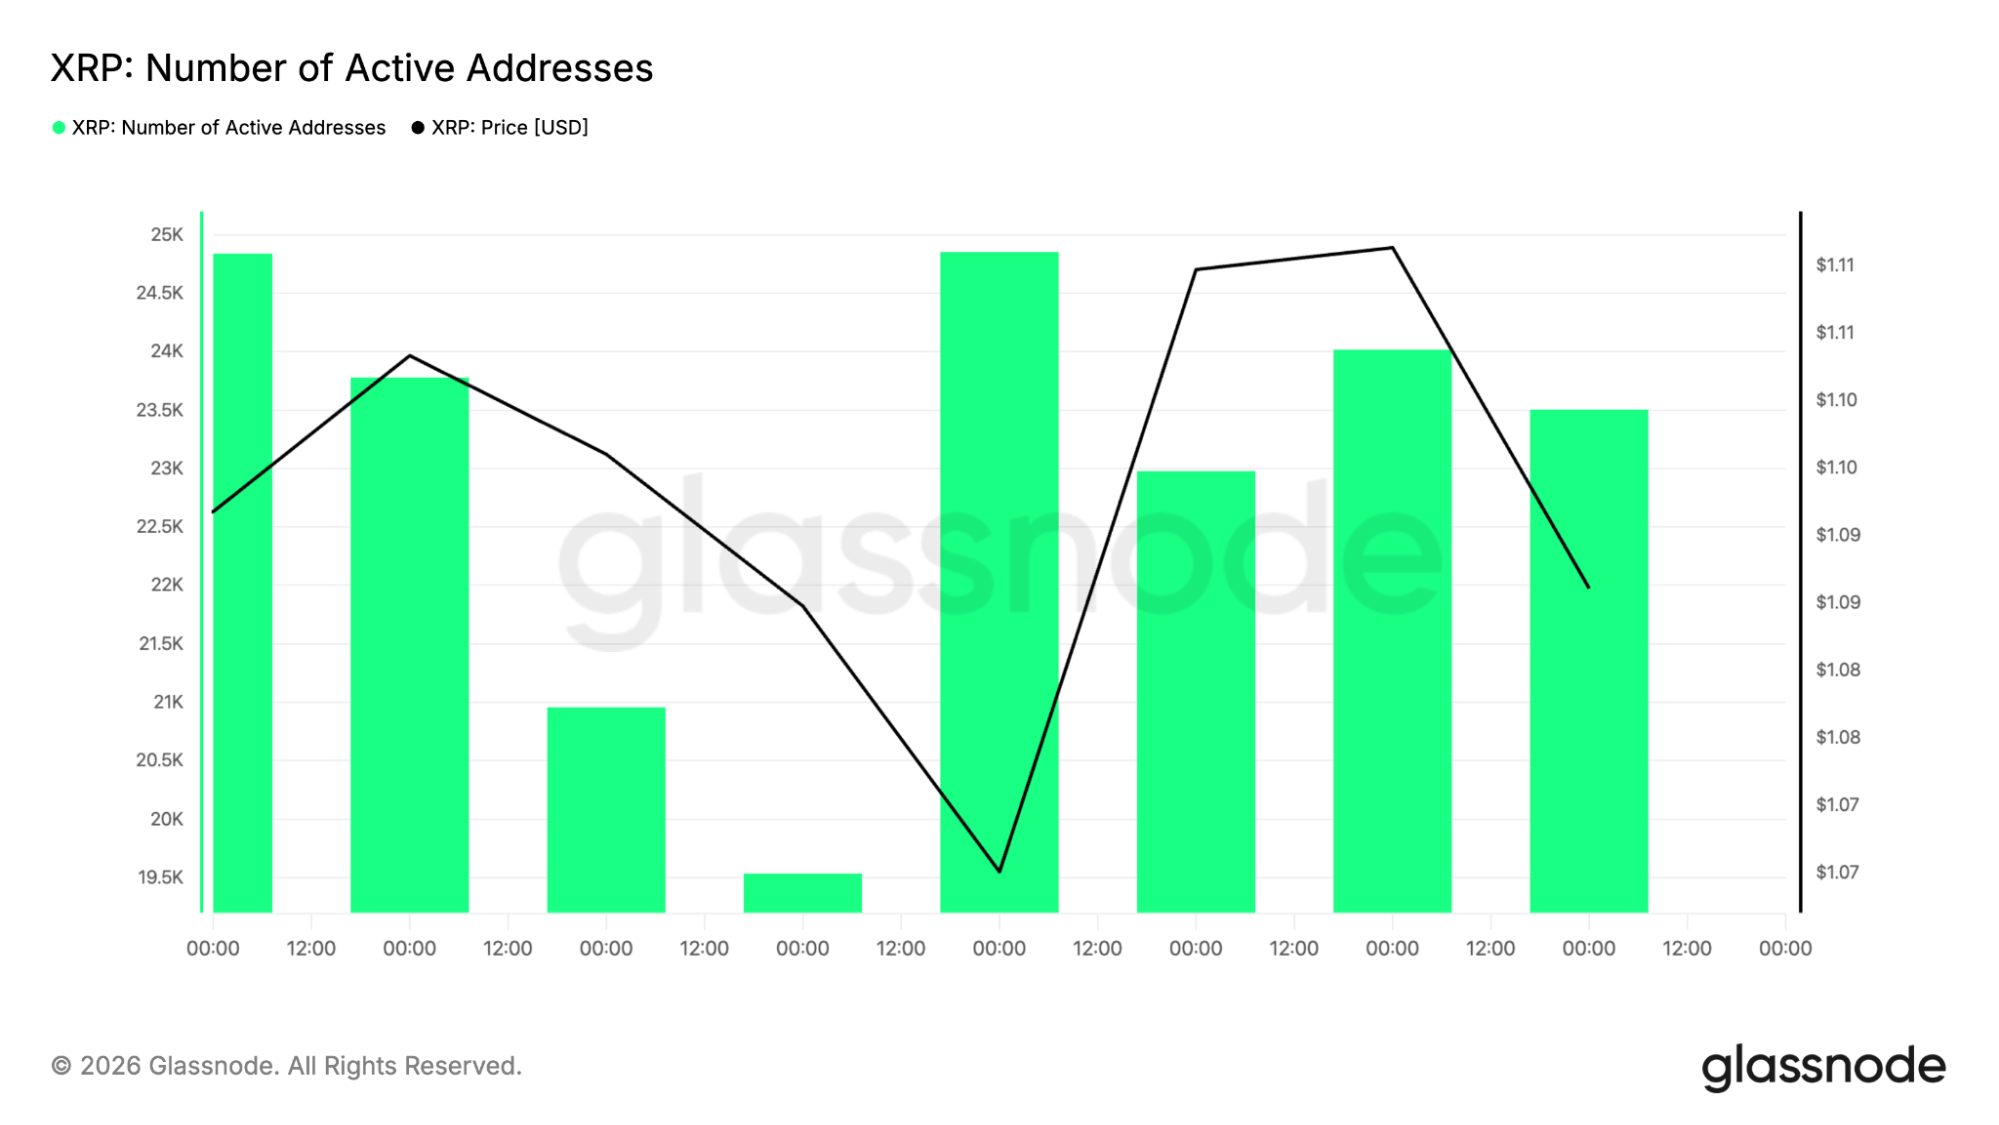
The on-chain picture remains stronger than price action alone would indicate. Daily active addresses have stayed between roughly 19,500 and 24,800 during the measured period. Activity has remained close to the upper end of that range, with about 23,500 to 24,000 active addresses even as the XRP price consolidated.
Transfer activity has also remained healthy. The daily number of transactions has been between 315,000 and 445,000, with the recent numbers remaining around 375,000. The good thing is that there is activity on the network regardless of the correction.
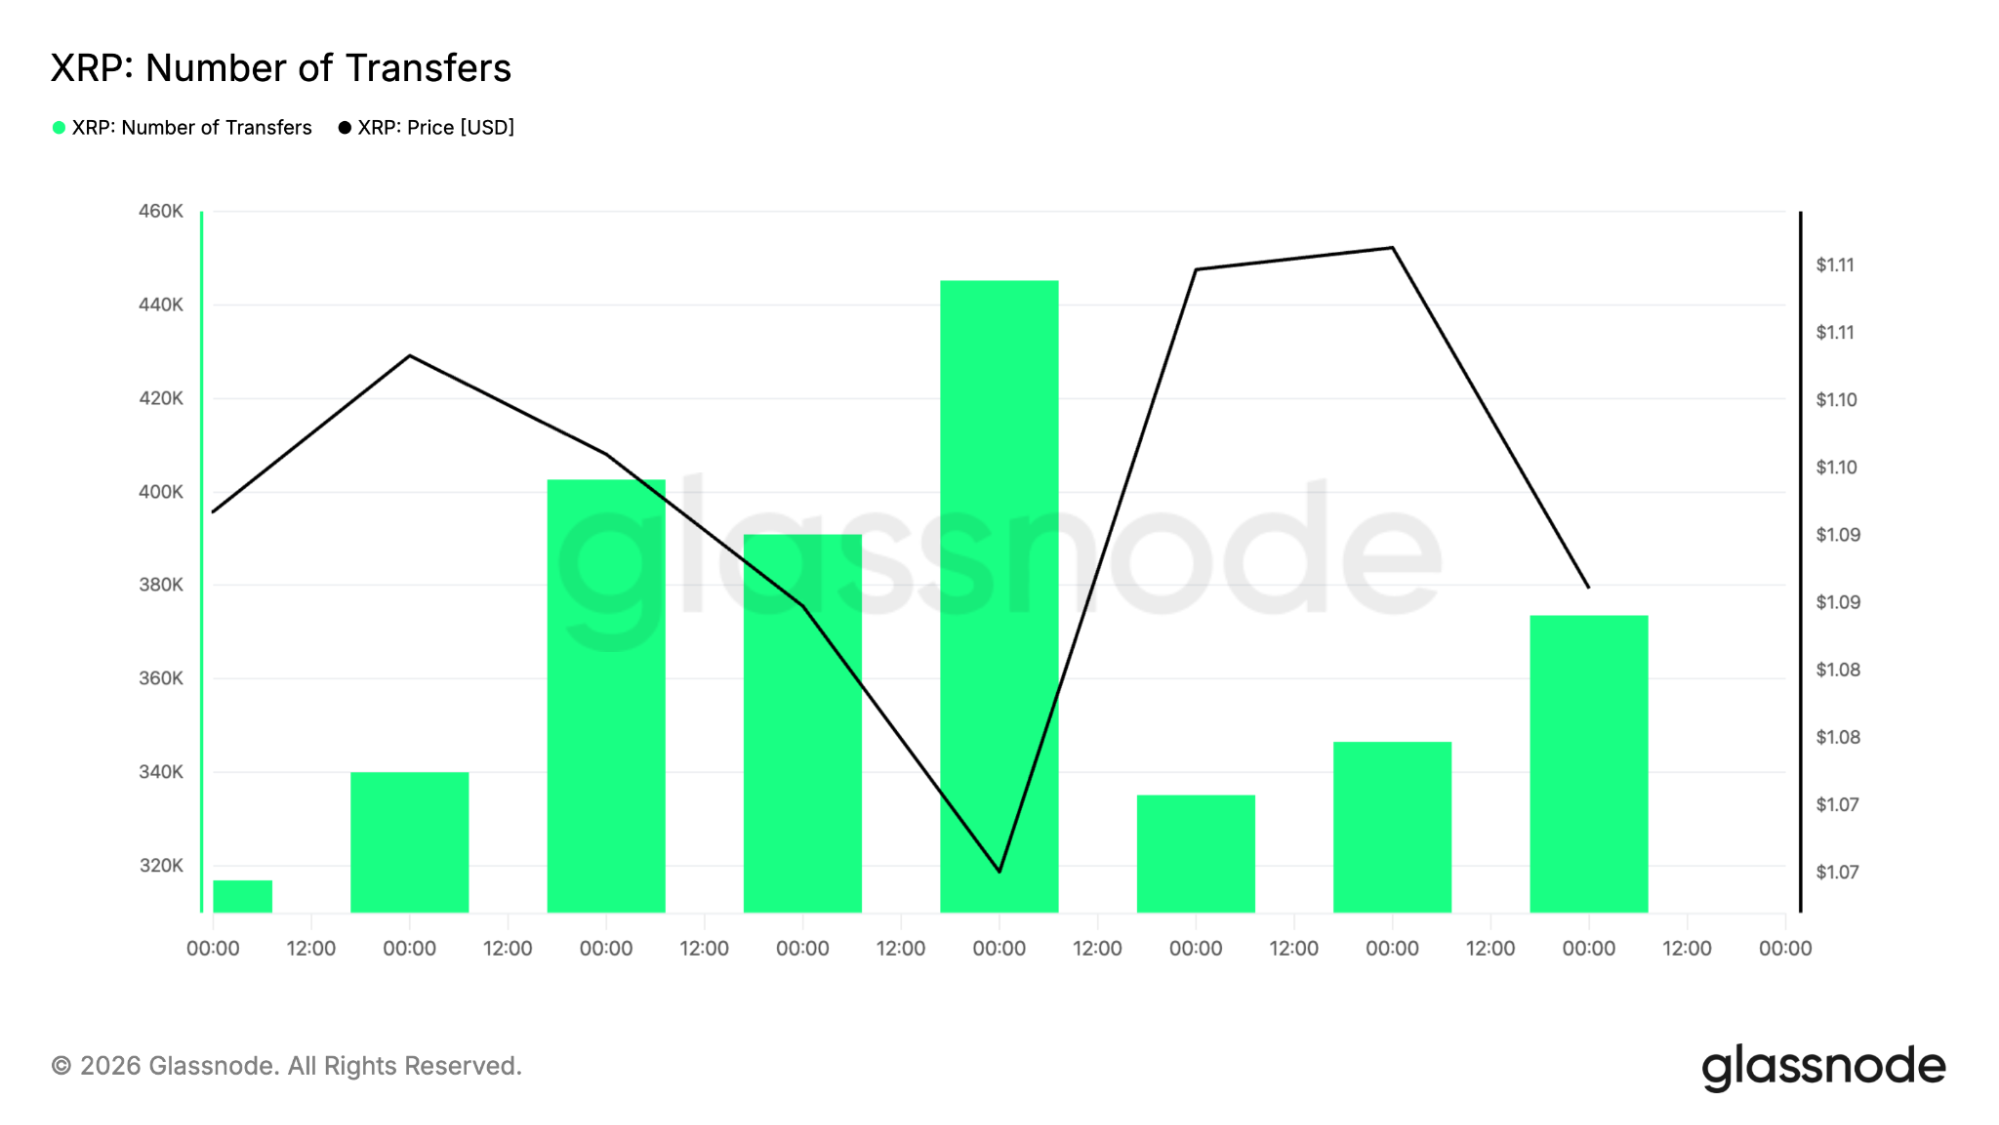
These metrics also line up with the improving technical picture. Bullish RSI divergence on both the daily and 4-hour charts is being accompanied by stable blockchain activity, reducing the likelihood of a deeper breakdown if buyers continue defending the $1.00 area.
XRPL moves closer to another network upgrade
The XRP Ledger is also preparing for an important network milestone. The fixCleanup3_2_0 amendment has reached roughly 85.7% validator support, with 30 validators voting in favor and five voting against.
According to the XRPL governance protocol, an amendment requires 80% consensus among validators for a period of two weeks consecutively to be effective. The proposed amendment is expected to be active on or around July 29, 2026.
The amendment introduces technical improvements across several parts of the network, including lending, Single Asset Vault precision, permissioned decentralized exchange functionality, Multi-Purpose Tokens, and ledger validation rules.
The benefits of the upgrade would be gained through improving the reliability of the network as the platform expands to include tokenized assets, stablecoins, decentralized finance, and even payment systems powered by artificial intelligence. The ledger has already reached the milestone of 8 million active accounts.
What comes next for the XRP price?
The XRP price has several important levels stacked closely together. The first challenge remains the 4-hour moving average near $1.1033. Above that, traders will watch $1.13, which also marks the breakout level identified by Ali’s triangle pattern.
Clearing both levels could bring $1.20 into focus, followed by the daily moving average near $1.2663. If buyers fail to break resistance, attention returns to support around $1.03. Losing that level could expose the psychological $1.00 area before the next support near $0.95 comes into play.
According to CoinCodex’s 1-month XRP price forecast, the price is predicted to be $1.20, indicating slight upside potential from the current level provided XRP manages to cross the $1.1033 resistance level and return to its 100-day moving average at $1.2663.
For now, the XRP price continues to trade within a larger downtrend pattern. It all depends on whether bulls manage to retake resistance levels and translate increasing momentum into a breakout pattern.
Source:: XRP Price Prediction: Analysts Eye $1.35 as XRP Tests Key Breakout Zone