Key highlights:
- HYPE rebounds from $37 support, with traders eyeing a potential push toward the $42–$44 resistance zone.
- Market cap and price show a V-shaped recovery, signaling strong buyer interest and stable circulating supply.
- A breakout above $41 could open the path to $50, while a drop below $37 risks renewed bearish pressure.
HYPE price has been trying to recover after a steep pullback, moving from about $37 to just over $39 in the last few sessions. That rebound started right after HYPE tapped a support zone between $37 and $38, an area that has been defended multiple times.
Now, the price is sitting just under $40, where sellers have stepped in before. This level also lines up with the first resistance area on the 4-hour chart, making it a key battleground for bulls and bears.
HYPE Charts and on-chain data from Glassnode show that while Hyperliquid isn’t in a confirmed uptrend, it’s stabilizing and trying to form a short-term base. The token is still facing resistance from its downtrend off the $53 peak, but the bounce off support gives buyers a chance to push toward the next target if momentum builds.
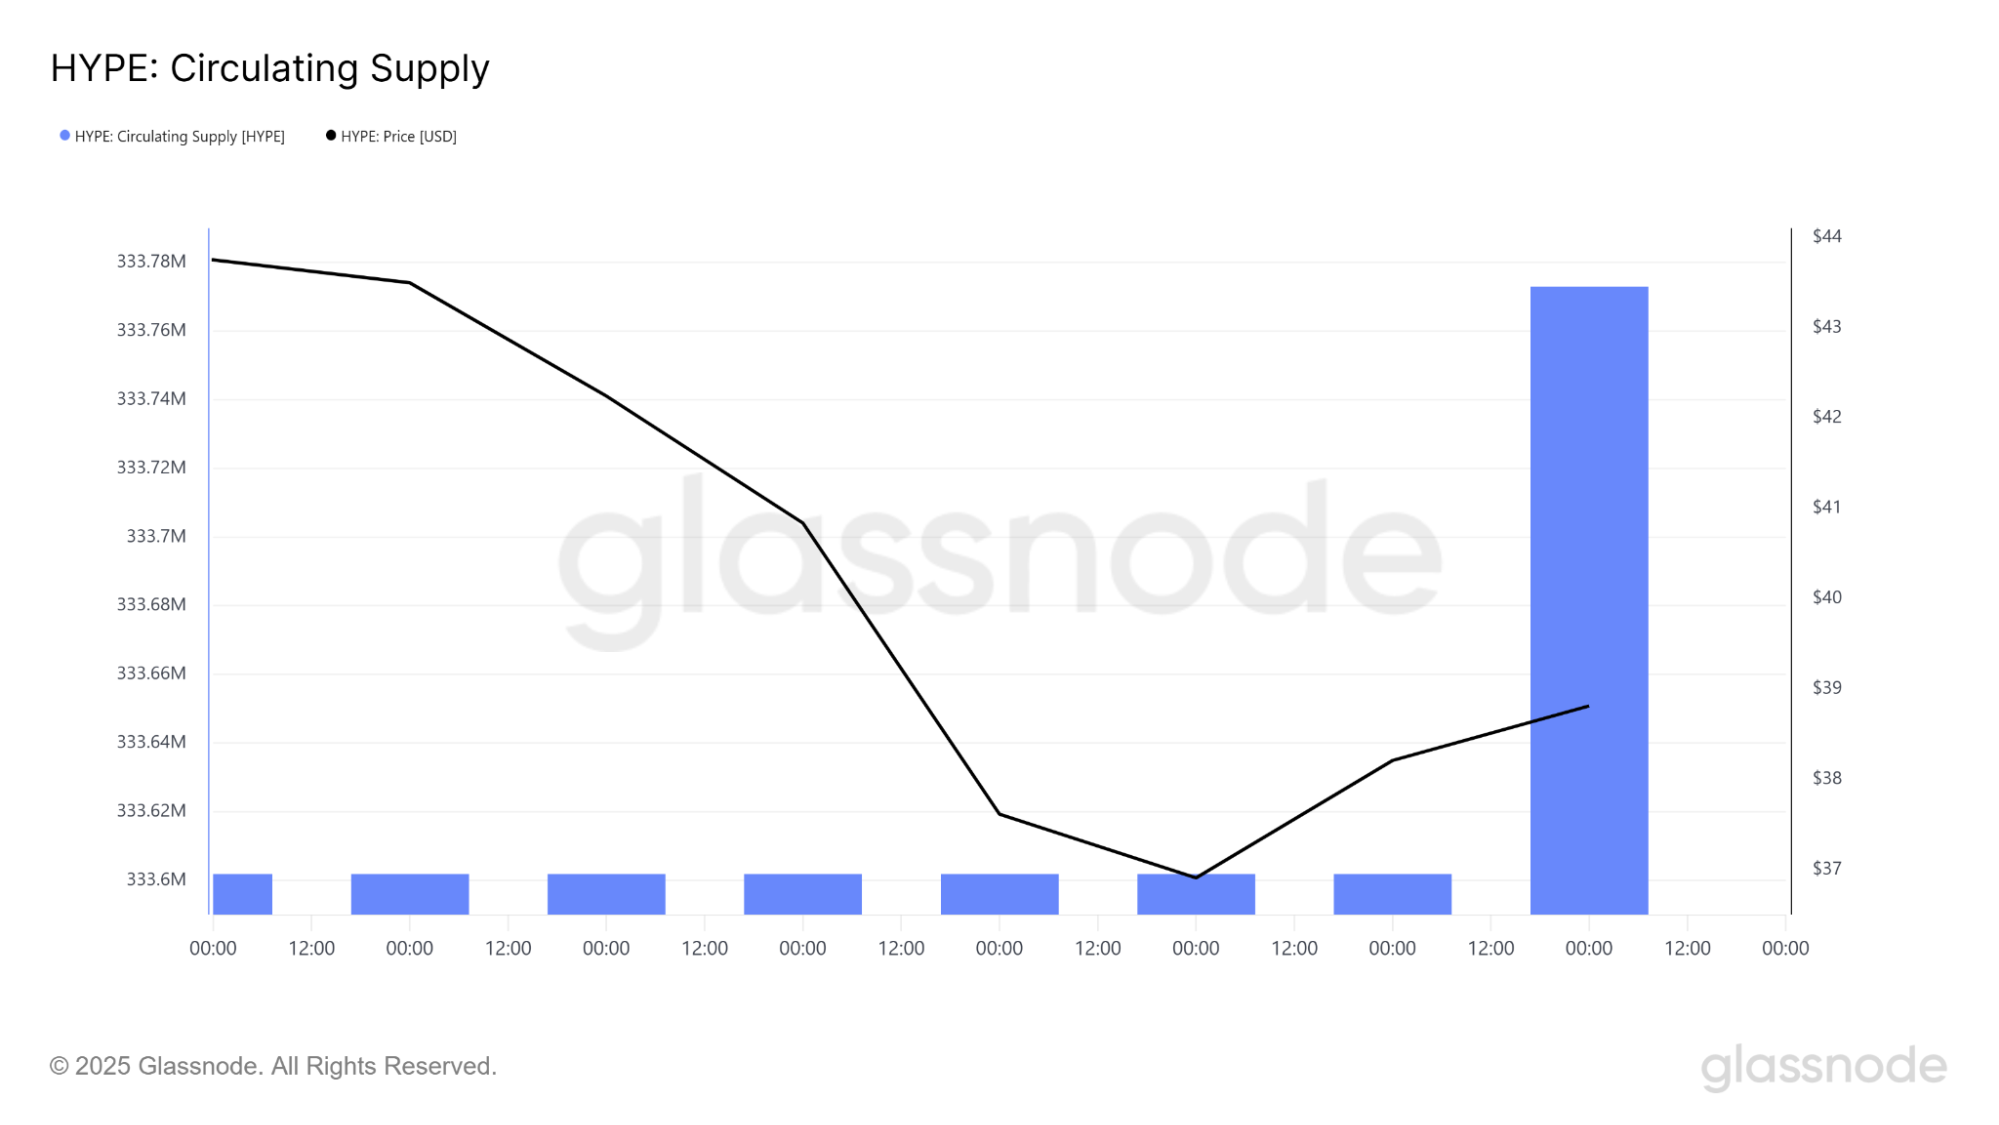
HYPE circulating supply stable as price rebounds
Glassnode data shows HYPE circulating supply stayed almost flat at around 333.6 million tokens for most of the recent drop. This means the decline from $44 to $37 was mostly market-driven, as opposed to being due to fresh supply hitting exchanges.
There was a temporary spike to circa 333.78 million tokens on the bounce, indicative of a minor token release, but the market absorbed it without triggering further selling.
HYPE price responded with a V-shaped reversal from $37 to $39, indicating that the buyers came in quickly at easy support. This type of action generally indicates short-term demand dictating the price action while supply is fairly balanced.
The real test now sits at $40–$41. If HYPE can break and hold above that zone, a move to $42–$44 becomes more likely. On the other side, $37 is still the level to watch if the price slides again. A break below could open the path toward $35 and then $32–$33.
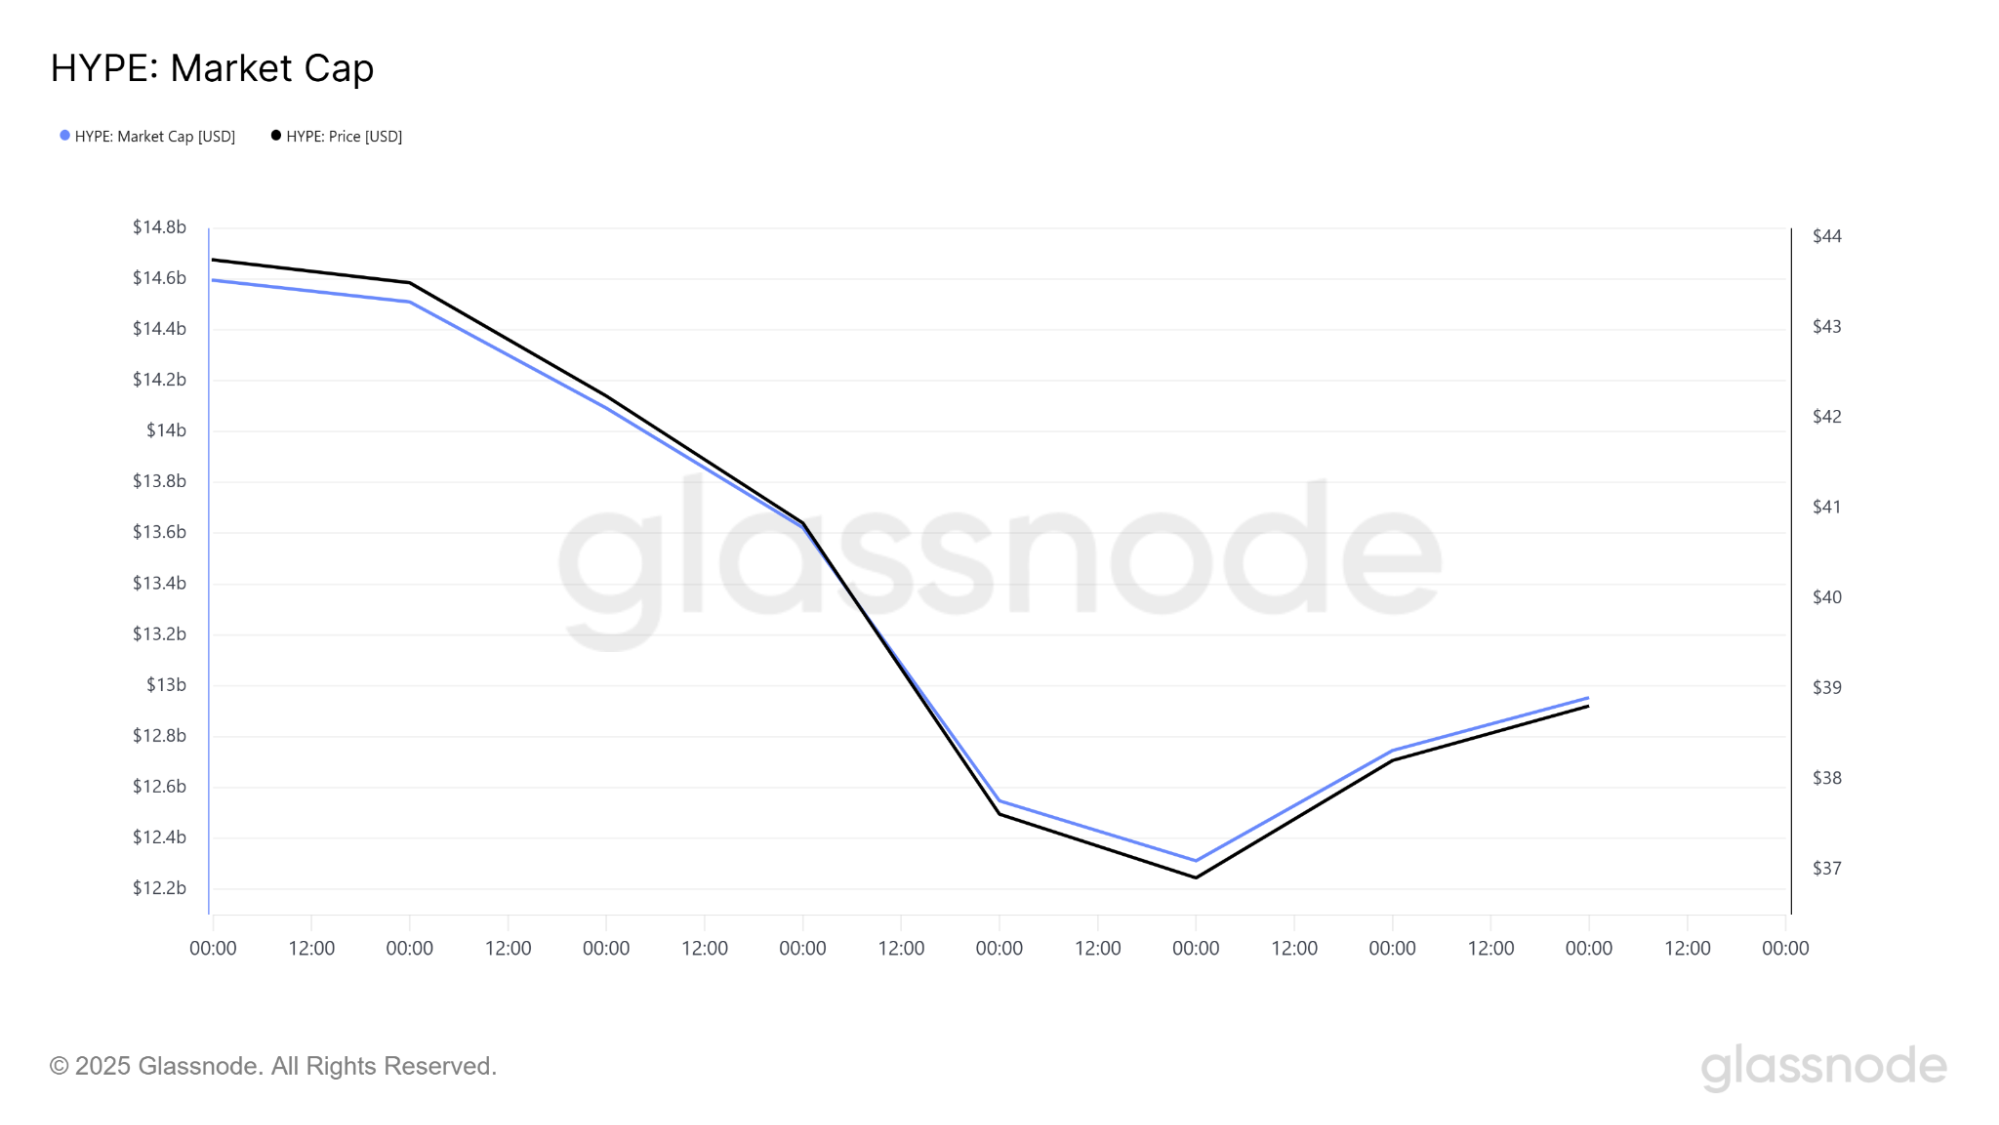
HYPE market cap mirrors the bounce
Market cap has followed HYPE price closely, dipping from approximately $14.6 billion to $12.3 billion during the sell-off. As price hit $37, buyers entered, and market capitalization bounced back to approximately $12.9 billion.
This is a classic V-shape recovery pattern, with price and market capitalization both recovering simultaneously. It also signals that the rebound is coming from market buying rather than any big supply events.
For traders, that means the $37 floor has held up well so far. If Hyperliquid price can push past $40–$41 and the market cap climbs toward $13.5 billion, it would mark the first sign of a stronger recovery. Until then, the market remains in a relief phase rather than a confirmed uptrend.
HYPE price still down over 20% from its ATH
Even with the current bounce, HYPE price remains about 21% below its all-time high, based on Glassnode drawdown data. The lowest point of this pullback was a -26% drawdown when price touched $37, before improving slightly on the climb toward $39.
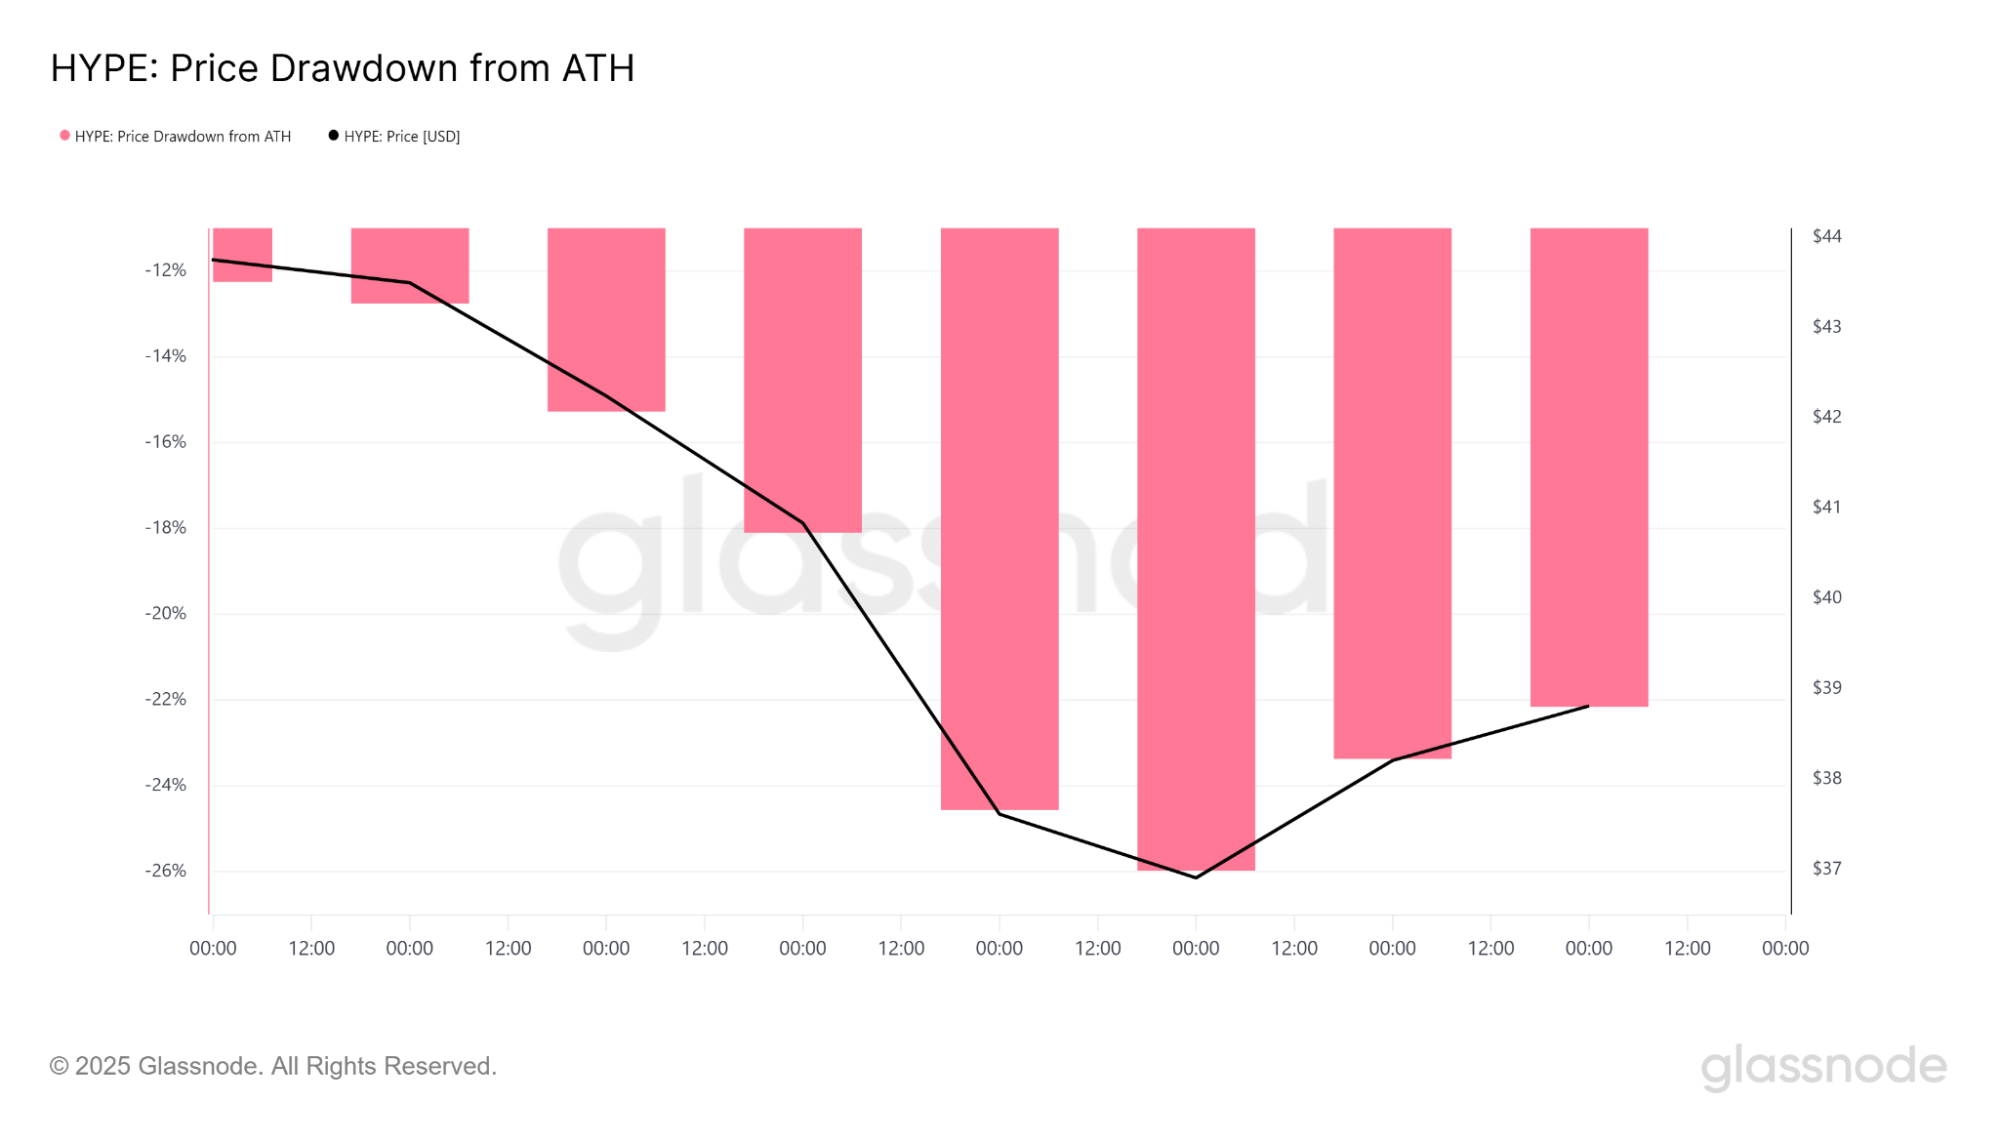
The big breakout target remains $50, which is also the zone that swing analysts like Astekz are watching. His post, “$HYPE – I’m long,” reflects the bullish sentiment among traders who see this setup as a 3:1 reward play, with stops under $36 and a target near $50.
$HYPE – I’m long pic.twitter.com/zDF9P6dEHQ
— Astekz (@astekz) August 5, 2025
This partial recovery is encouraging for holders, but the token still has work to do. A sustained move above $40–$41 would start reducing the drawdown toward 15–18% and open the door for a retest of $43–$44.
HYPE price analysis
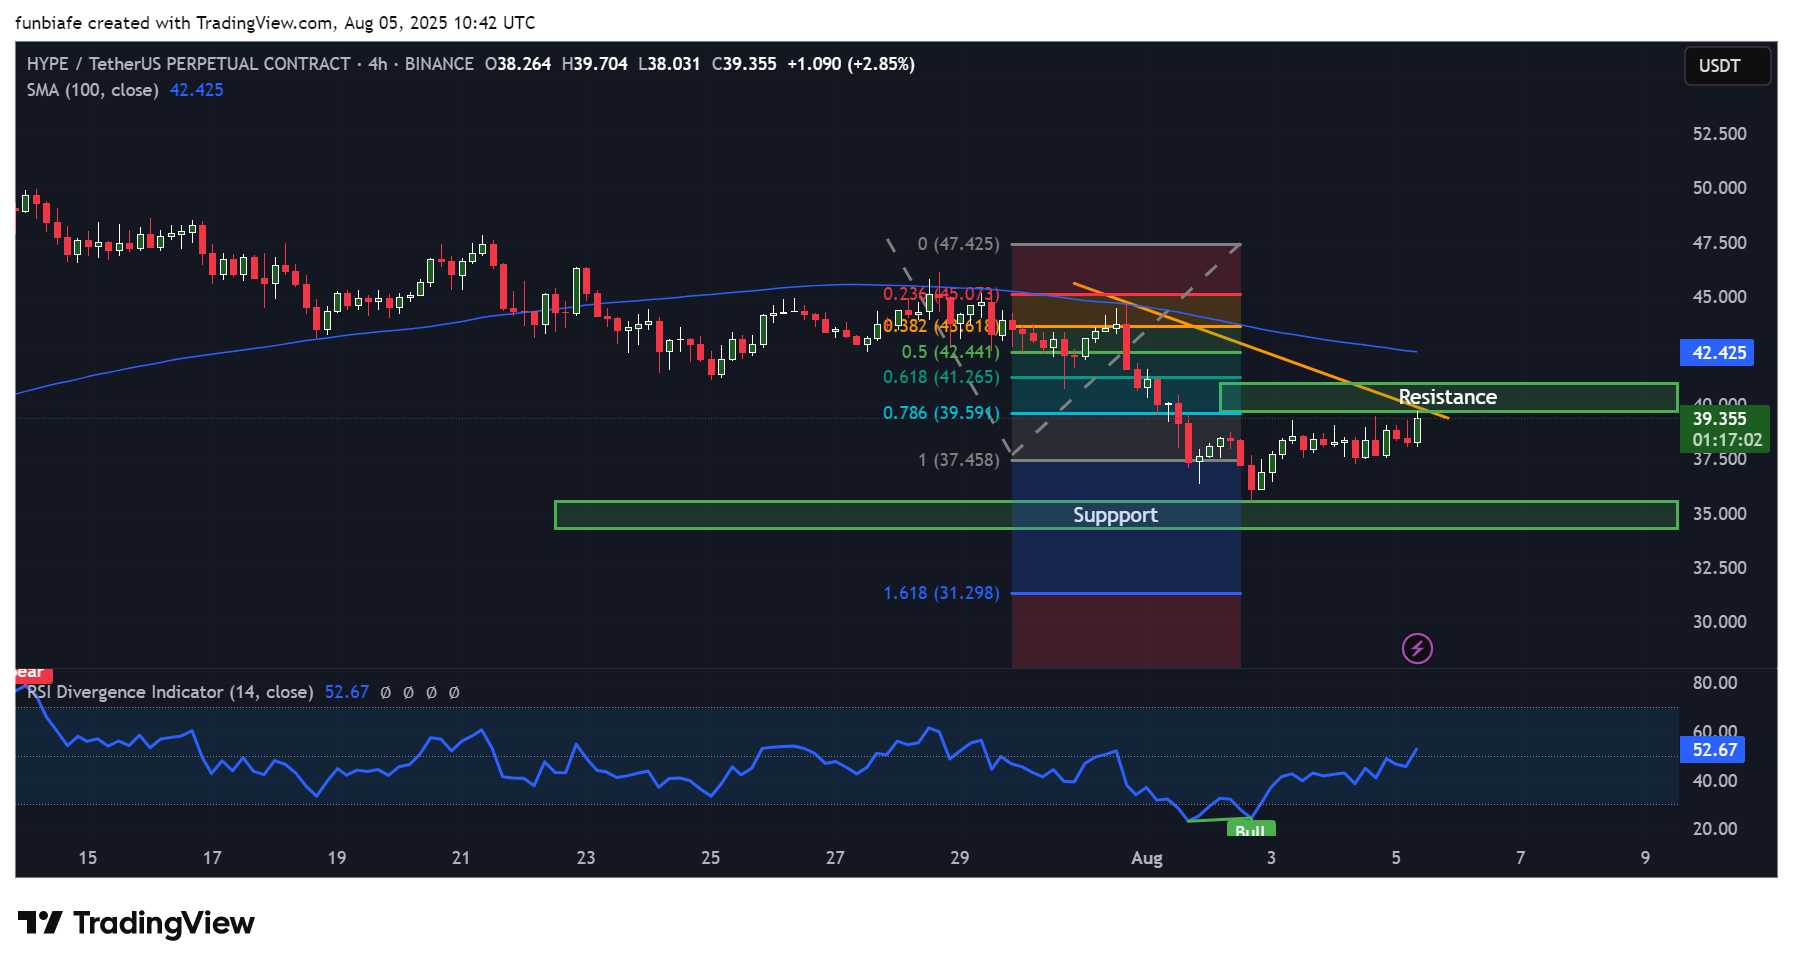
HYPE 4h chart. Source: Tradingview
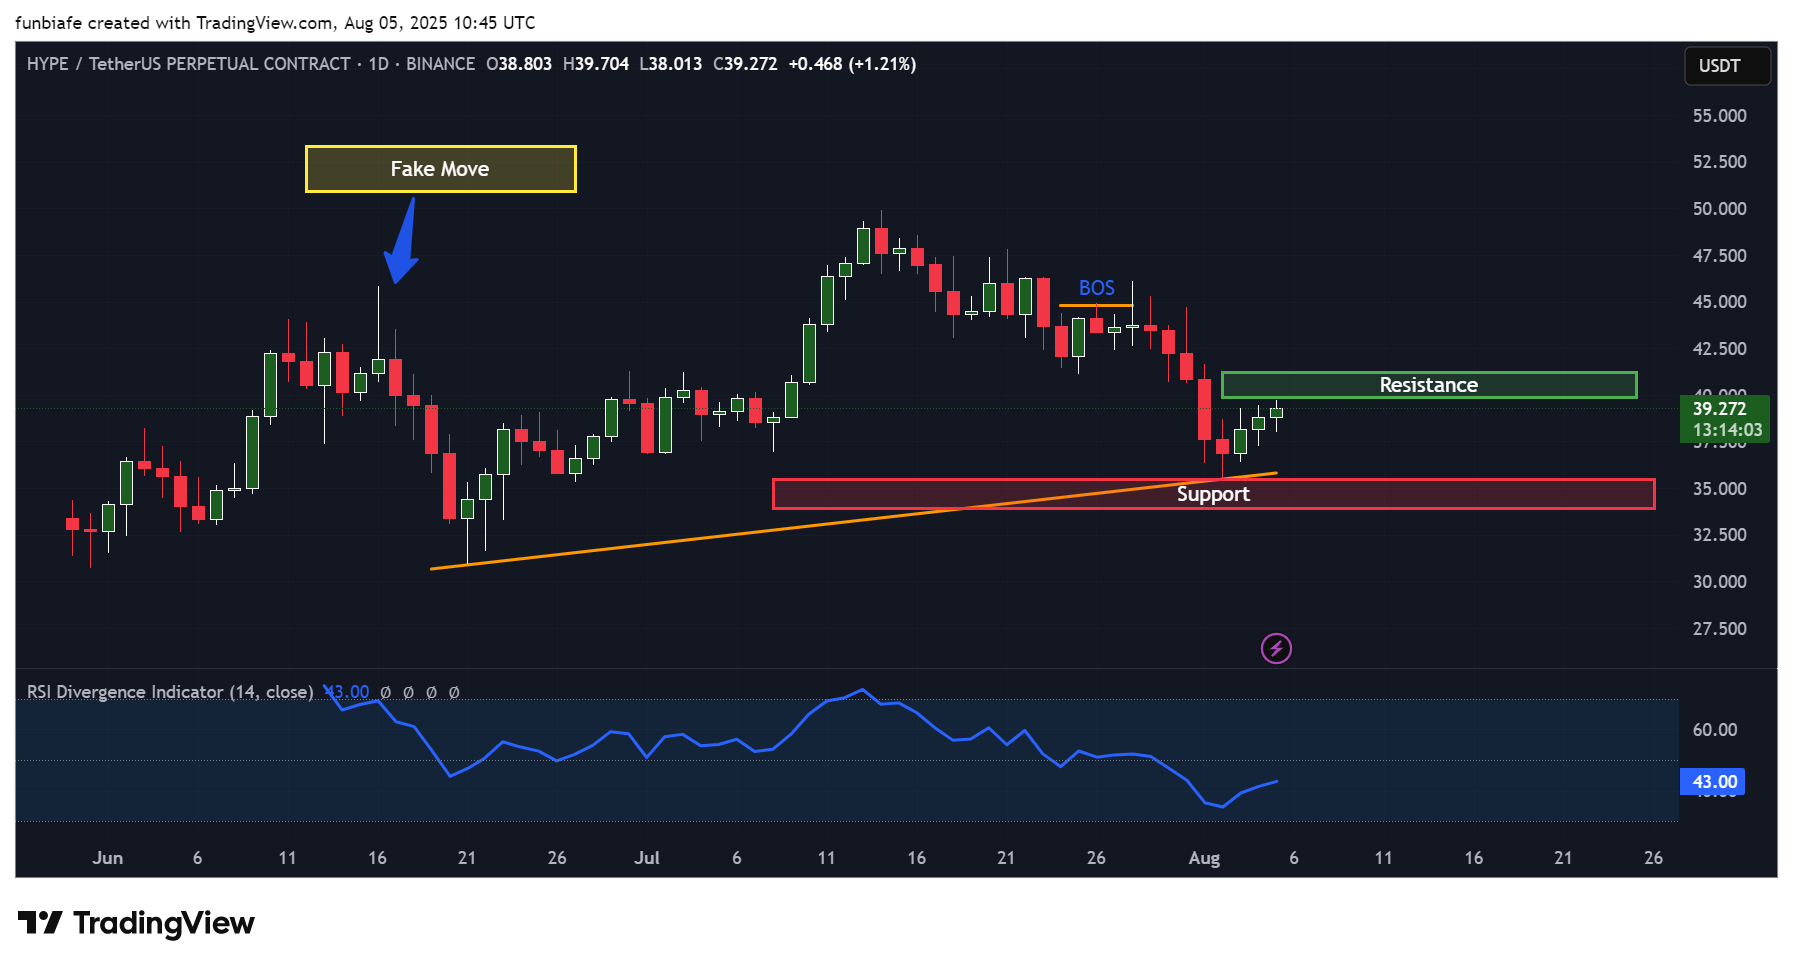
HYPE daily chart. Source: Tradingview
Structurally, HYPE is trying to build a base after weeks of selling pressure. Buyers are defending $37–$38, and the short-term RSI around 50 shows that momentum is slowly turning in their favor.
But this is not a confirmed breakout yet. HYPE price is still below the descending trendline and the 100-day moving average around $42.4. A clean break above $41 followed by $42–$44 would flip short-term momentum more decisively to the bulls.
If price loses $37 support, however, the structure turns bearish again, with $35 and $32–$33 as the next areas to watch.
For now, HYPE short-term forecast is cautiously optimistic. The market is coming into balance, with an opportunity to probe higher levels, but the road to $50 is contingent upon the buyers forcing above $40–$41 and maintaining that break.
Broader market context and scenarios
HYPE price action is also reflecting overall market sentiment. The majority of mid-cap alts are seeing similar relief rallies after hard corrections, with their strong support levels acting as a trampoline for short-term trades.
In a neutral scenario, HYPE can go sideways in between $36 and $41 for a while, establishing a solid base before any larger move. This kind of consolidation has a tendency to reset technical indicators, giving a lot more hope to the buyers to experience a sustainable breakout in the future.
HYPE is in rebound mode, but the market hasn’t confirmed yet. Traders are eyeing the $40–$41 resistance zone for the next significant move, while longer-term investors are waiting to see whether the token will reclaim $50 in future sessions.
eToro: Best platform for beginners and social trading
- Trade cryptocurrencies, stocks, ETFs, and commodities on one easy-to-use platform
- Follow and copy top-performing traders with eToro’s unique social trading tools
- Earn passive income with staking on popular coins like ETH, ADA, and TRX
- Fully regulated in multiple jurisdictions with strong security protocols
- 0% commission on real stock trading and competitive spreads on crypto
- 30+ million registered users across 100+ countries
eToro is a multi-asset investment platform. The value of your investments may go up or down. Your capital is at risk. Don’t invest unless you’re prepared to lose all the money you invest. This is a high-risk investment and you should not expect to be protected if something goes wrong.
Source:: HYPE Price Analysis: Analyst Eyes a Realistic $50 Breakout For Hyperliquid