Key highlights:
Hedera may finally be showing signs of life after months of heavy selling. The HBAR price is trading at around $0.071 after a fall of over 77% since its late-2025 peak of $0.317 and 88% since its record high of $0.57.
Despite such losses, it seems that even now buyers have started fighting back and are looking whether this rally is strong enough to persist. One analyst believes it could. World of Charts says the HBAR price is closing in on a breakout above a long-standing descending trendline that has rejected every rally throughout the downtrend.
At the same time, fresh money has started flowing back into Hedera spot ETFs after more than a week of inactivity, giving the market another reason to pay attention.
The HBAR price is testing a key breakout level
World of Charts believes Hedera is nearing one of its biggest technical tests in months. The HBAR price has climbed back to a descending trendline that has acted as resistance throughout the bear market, and a breakout above it could change the short-term picture.
The overall outlook still favors the bears. HBAR has gone down from the visible high of around $0.34 to roughly $0.0707, representing a total loss of around 79.2%. Throughout this process, there have been prints of lower highs and lows.
$HBAR #Hbar On Verge Of Counter Trendline Breakout, Breakout Can Send It Towards Major Trendline pic.twitter.com/dCMzU5d8YJ
— World Of Charts (@WorldOfCharts1) July 22, 2026
What makes this configuration unique is that there have been no new lows printed in the HBAR price as the buyers were able to defend the price from going lower while taking it higher towards resistance levels instead. A breakout above the trendline means that the initial target is located at $0.10, followed by $0.115 and $0.13.
A breakthrough above $0.15 would indicate the end of the downtrend. On the other hand, a failure to do so would mean support at $0.0707 while a breach of that level would take the price lower to $0.06 before reaching the next support level at $0.053.
HBAR short-term momentum is starting to improve
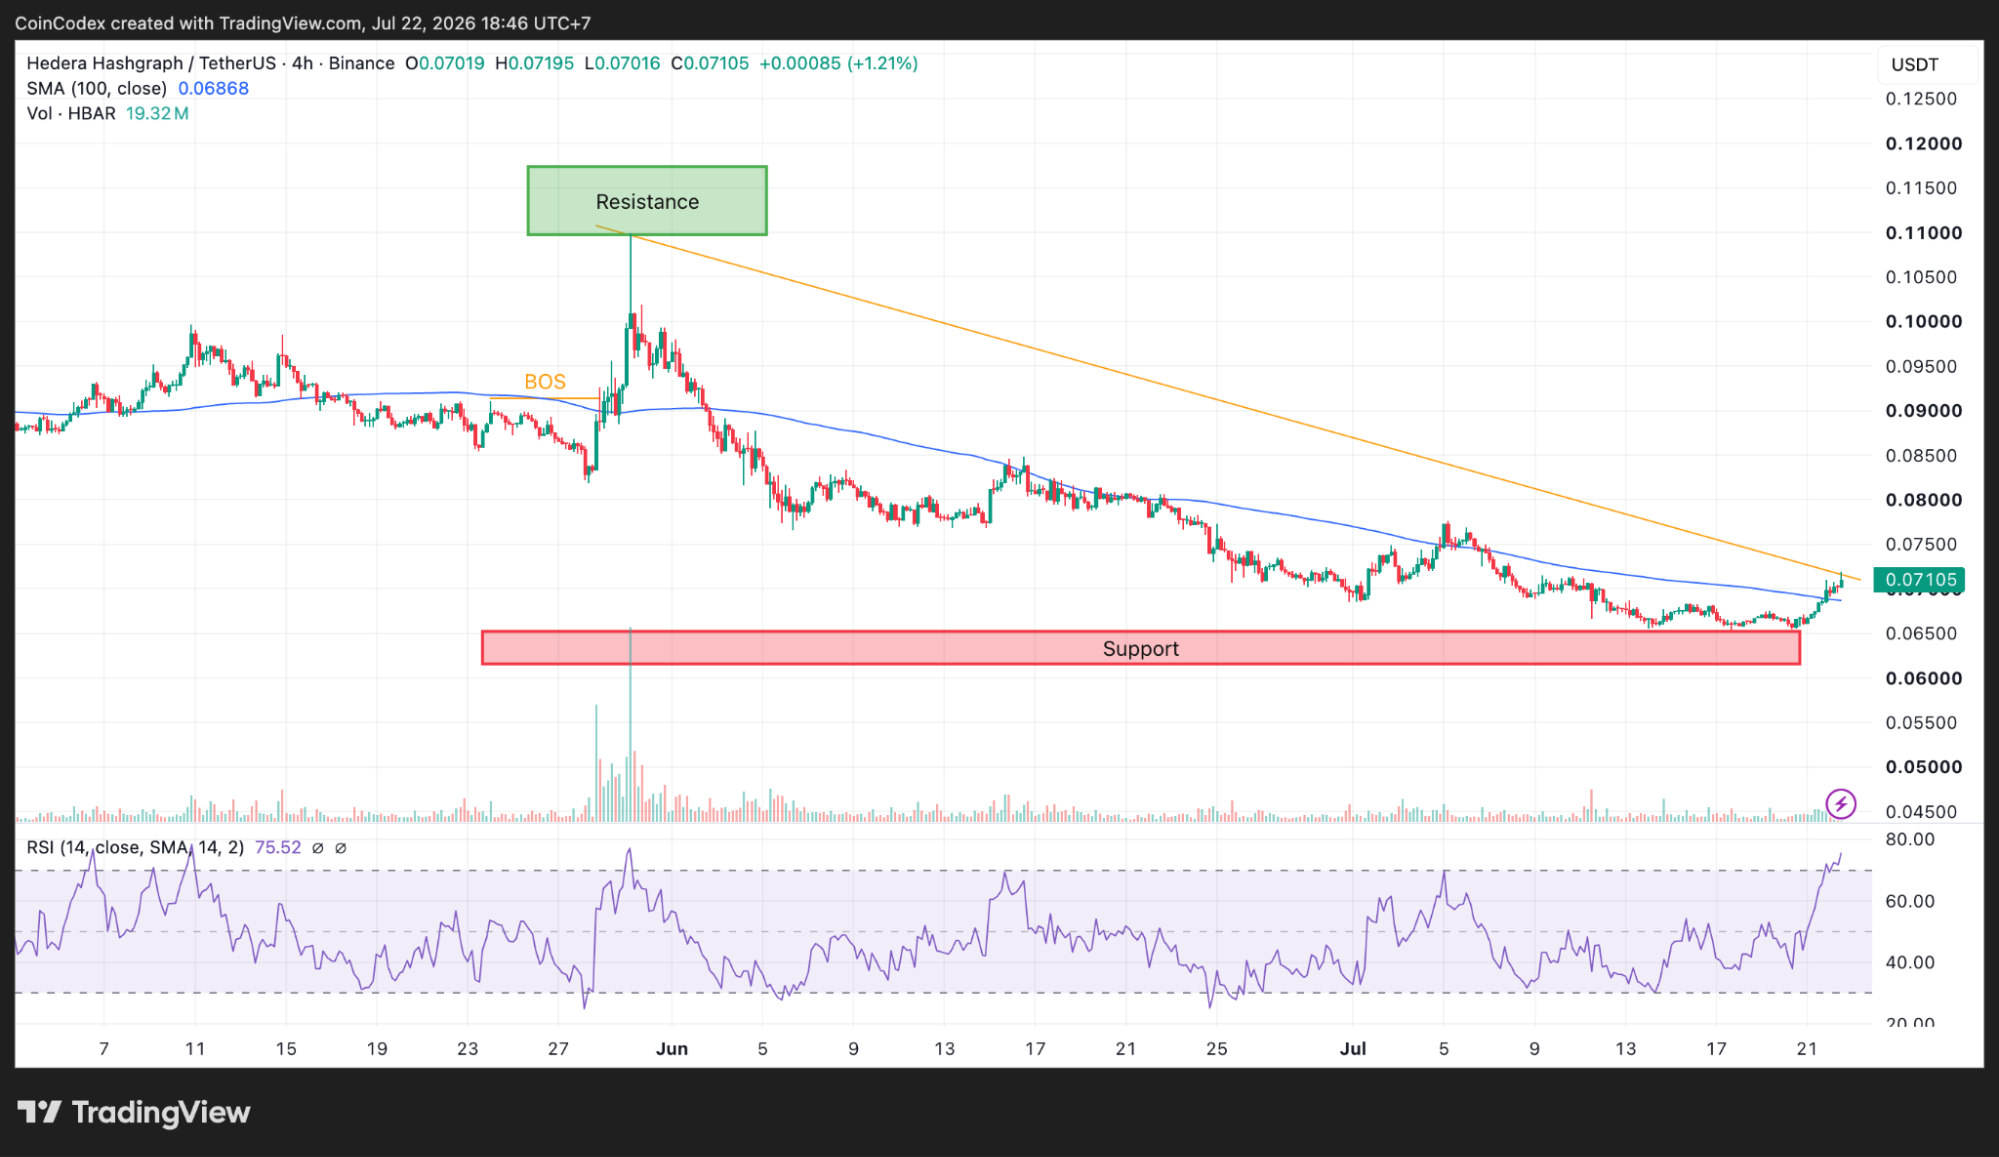
The lower timeframes are already looking stronger than the bigger picture. As we can see from the HBAR chart within the 4-hour time frame, the HBAR price is trading near $0.07105 and gained 1.21% within the recent session.
The price is currently 3.4% higher than the 100-period simple moving average of $0.06868 and this makes the buyers have an upper hand for now. There is another positive development on the chart, which is the Break of Structure, that occurs in the $0.070-$0.075 area. This normally occurs when the price crosses a previous swing high point.
4-hour HBAR chart analysis
Also, momentum is improving. The 4-hour RSI has risen to 75.52 and is now overbought. It doesn’t mean that the uptrend is about to end; it just means that buyers might be looking for some rest after that move up.
The first resistance is close to $0.07195, while the following resistances are at $0.075 and $0.08. In case of a profit taking move down from the current level, the nearest support will remain close to the 100-period SMA of $0.06868, while the second one is located at $0.065.
Daily HBAR chart analysis
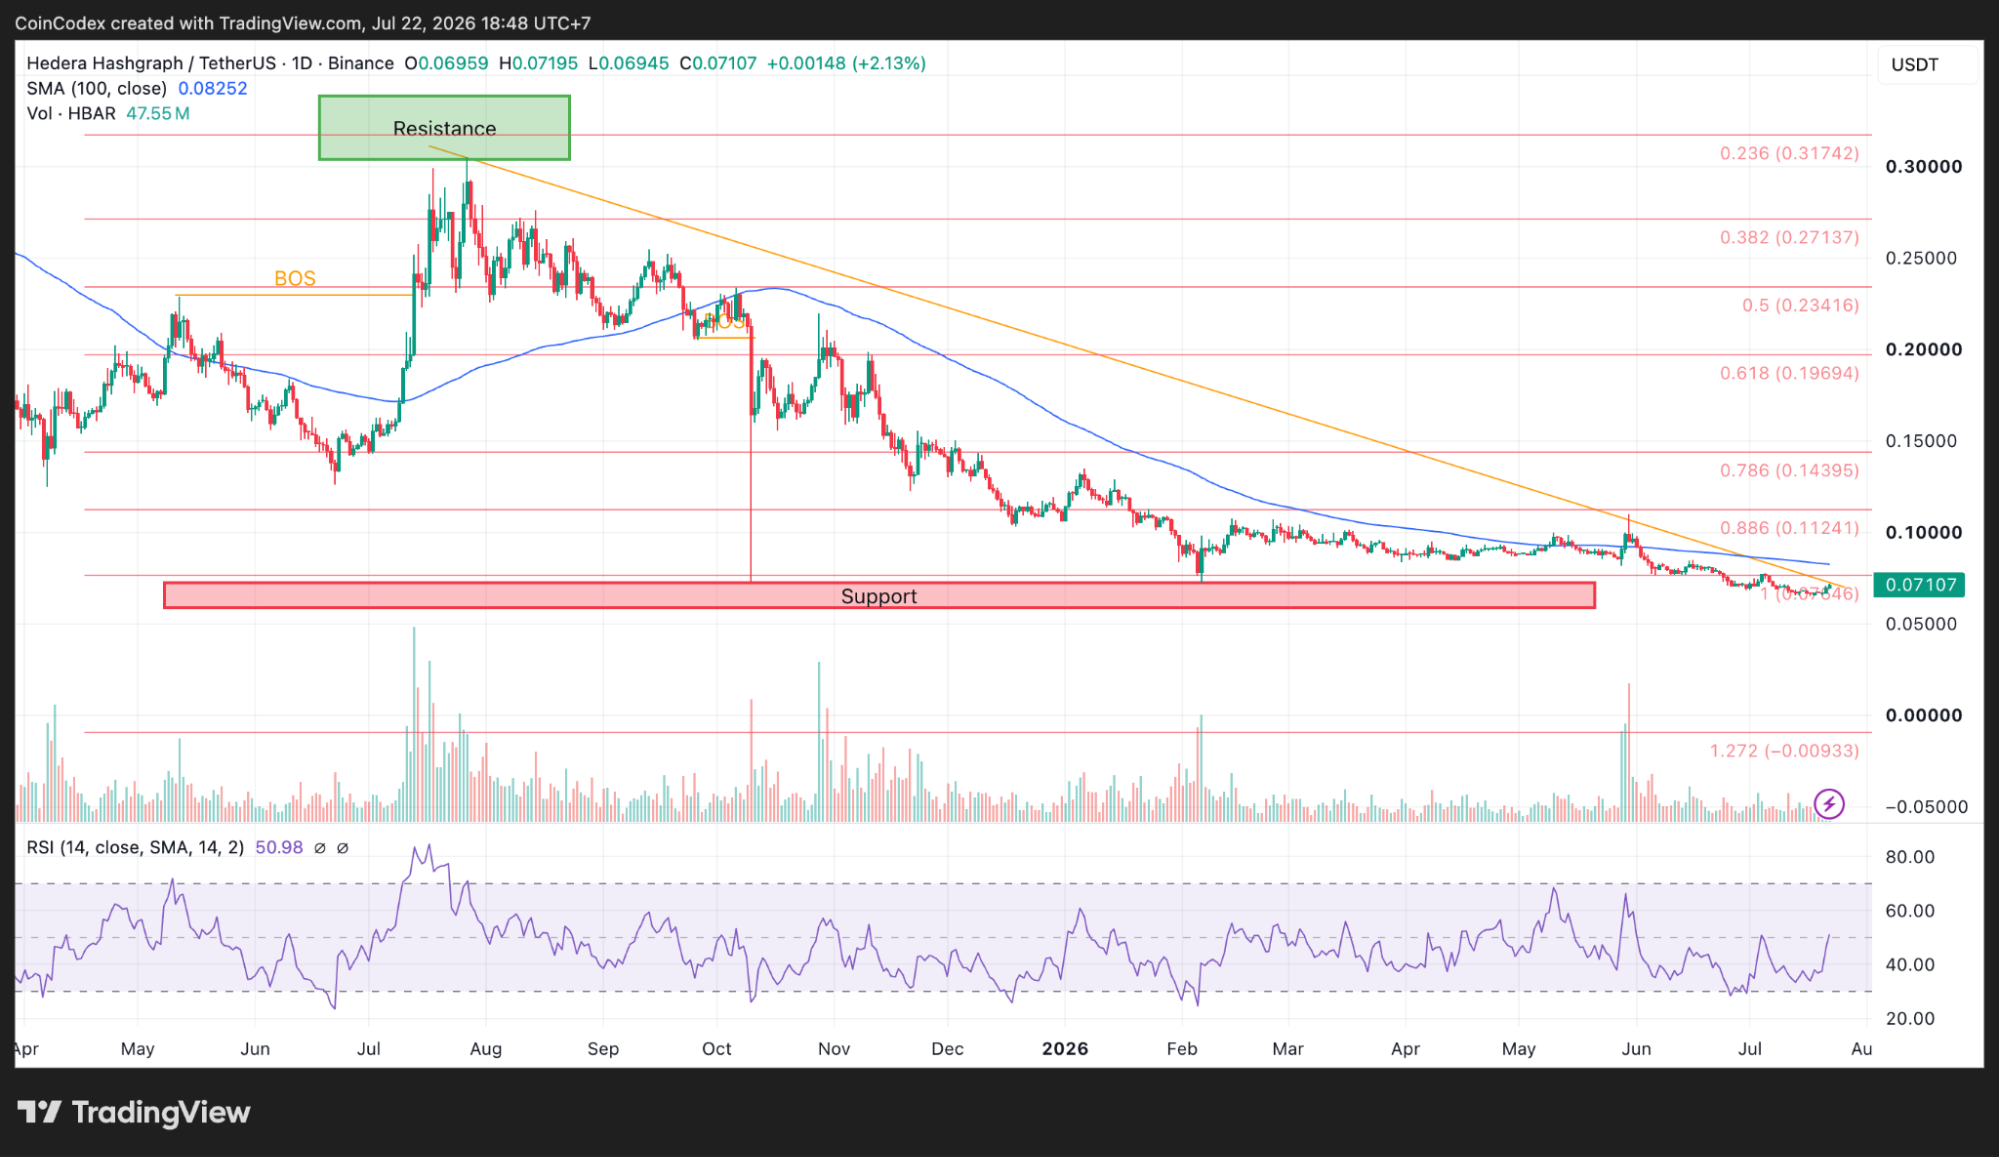
The daily chart needs to improve. The HBAR price is trading around 13.9% below the 100-day SMA at $0.08252. Still, the daily RSI has recovered to 50.98 after spending months near oversold levels. It has also continued making higher lows even as price made lower lows, creating a bullish divergence that often appears before larger recoveries.
Hedera on-chain data shows the market is stabilizing
The on-chain data from Glassnode lines up with what the charts are showing. The market cap of Hedera has fluctuated between $2.88 billion and $3.04 billion over the last reporting period before stabilizing at around $2.96 billion.
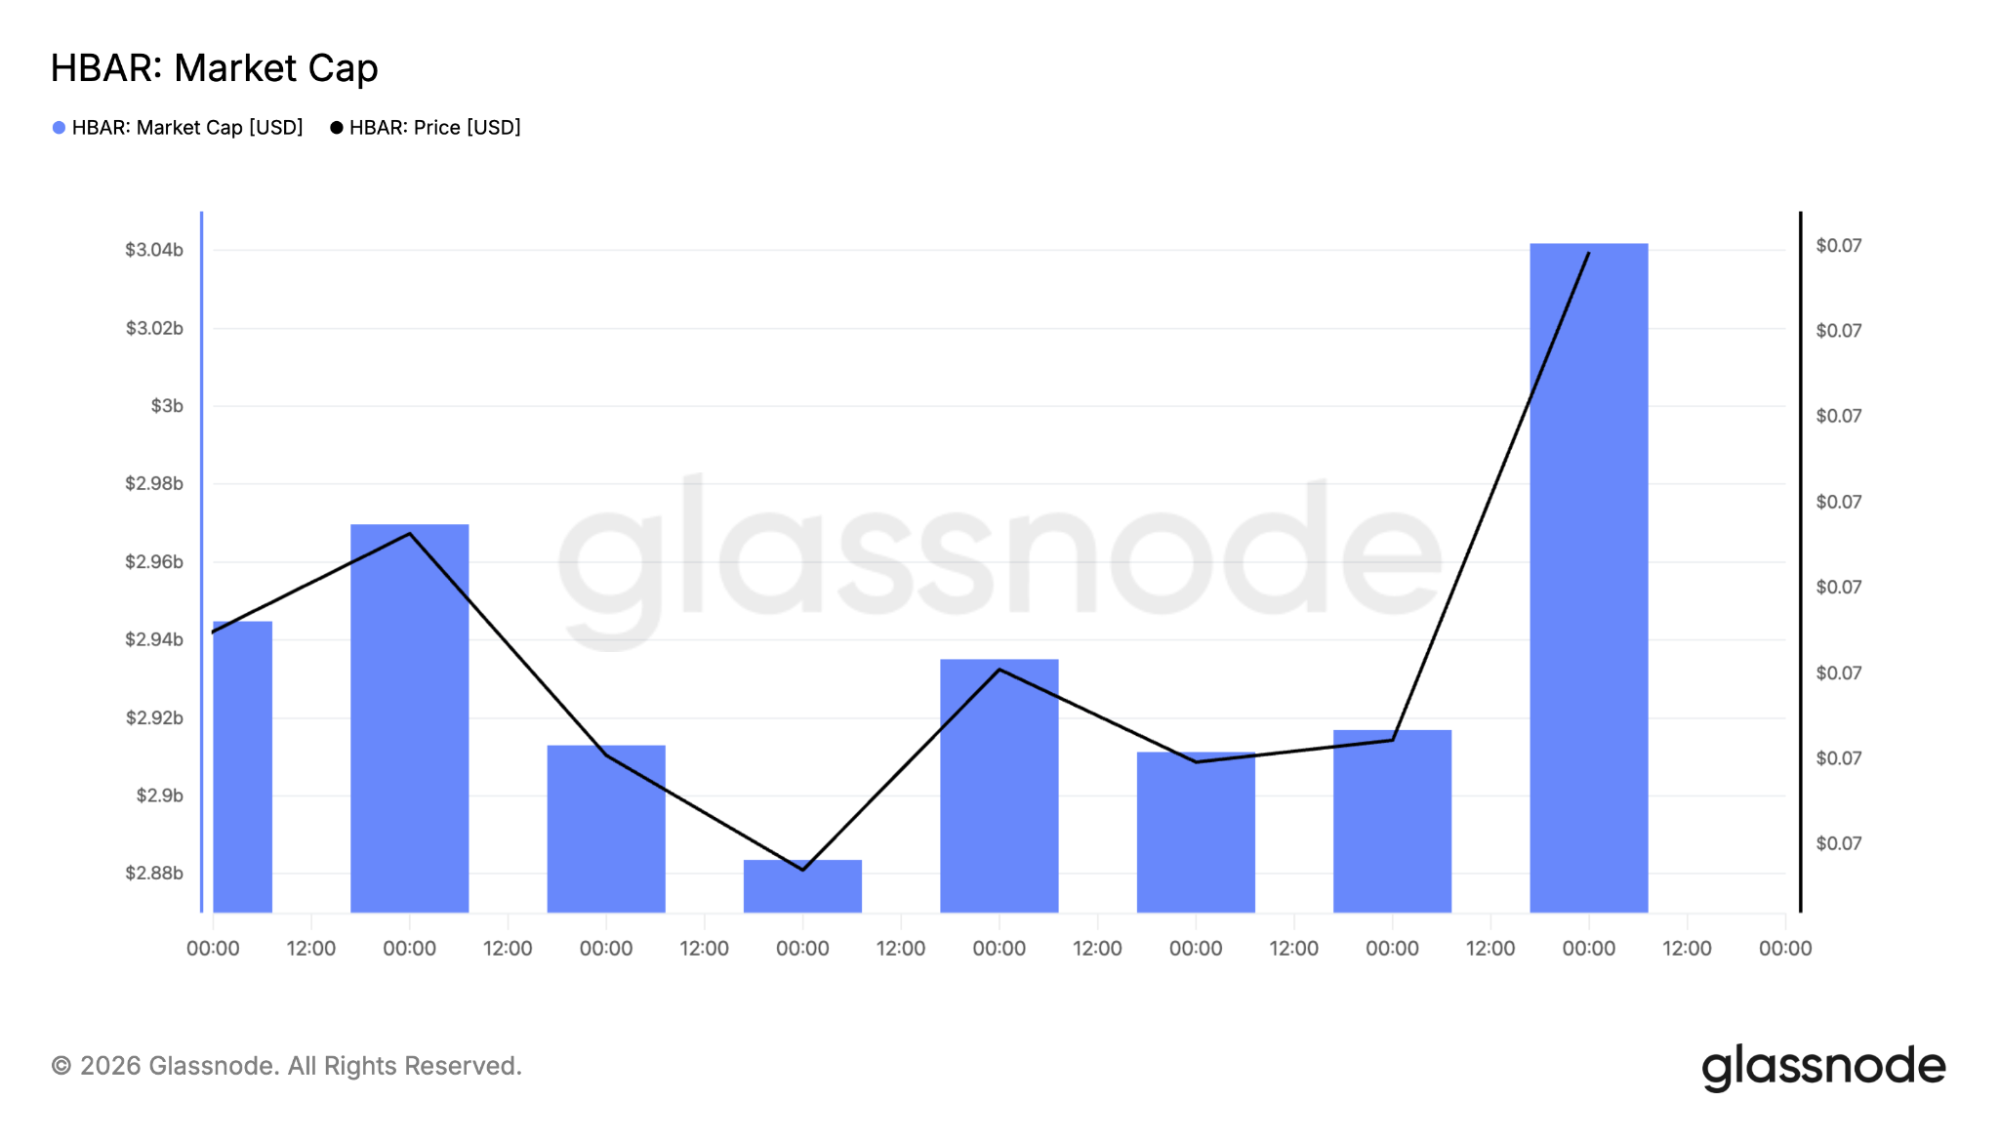
This may not be at the high point recently reached, but the stabilization is a good sign considering that it has been accompanied by HBAR staying above $0.07. The bigger picture is one of a massive correction; Hedera has lost 87.9% to 88.5% from its all-time high, making it one of the most impacted major cryptocurrencies.
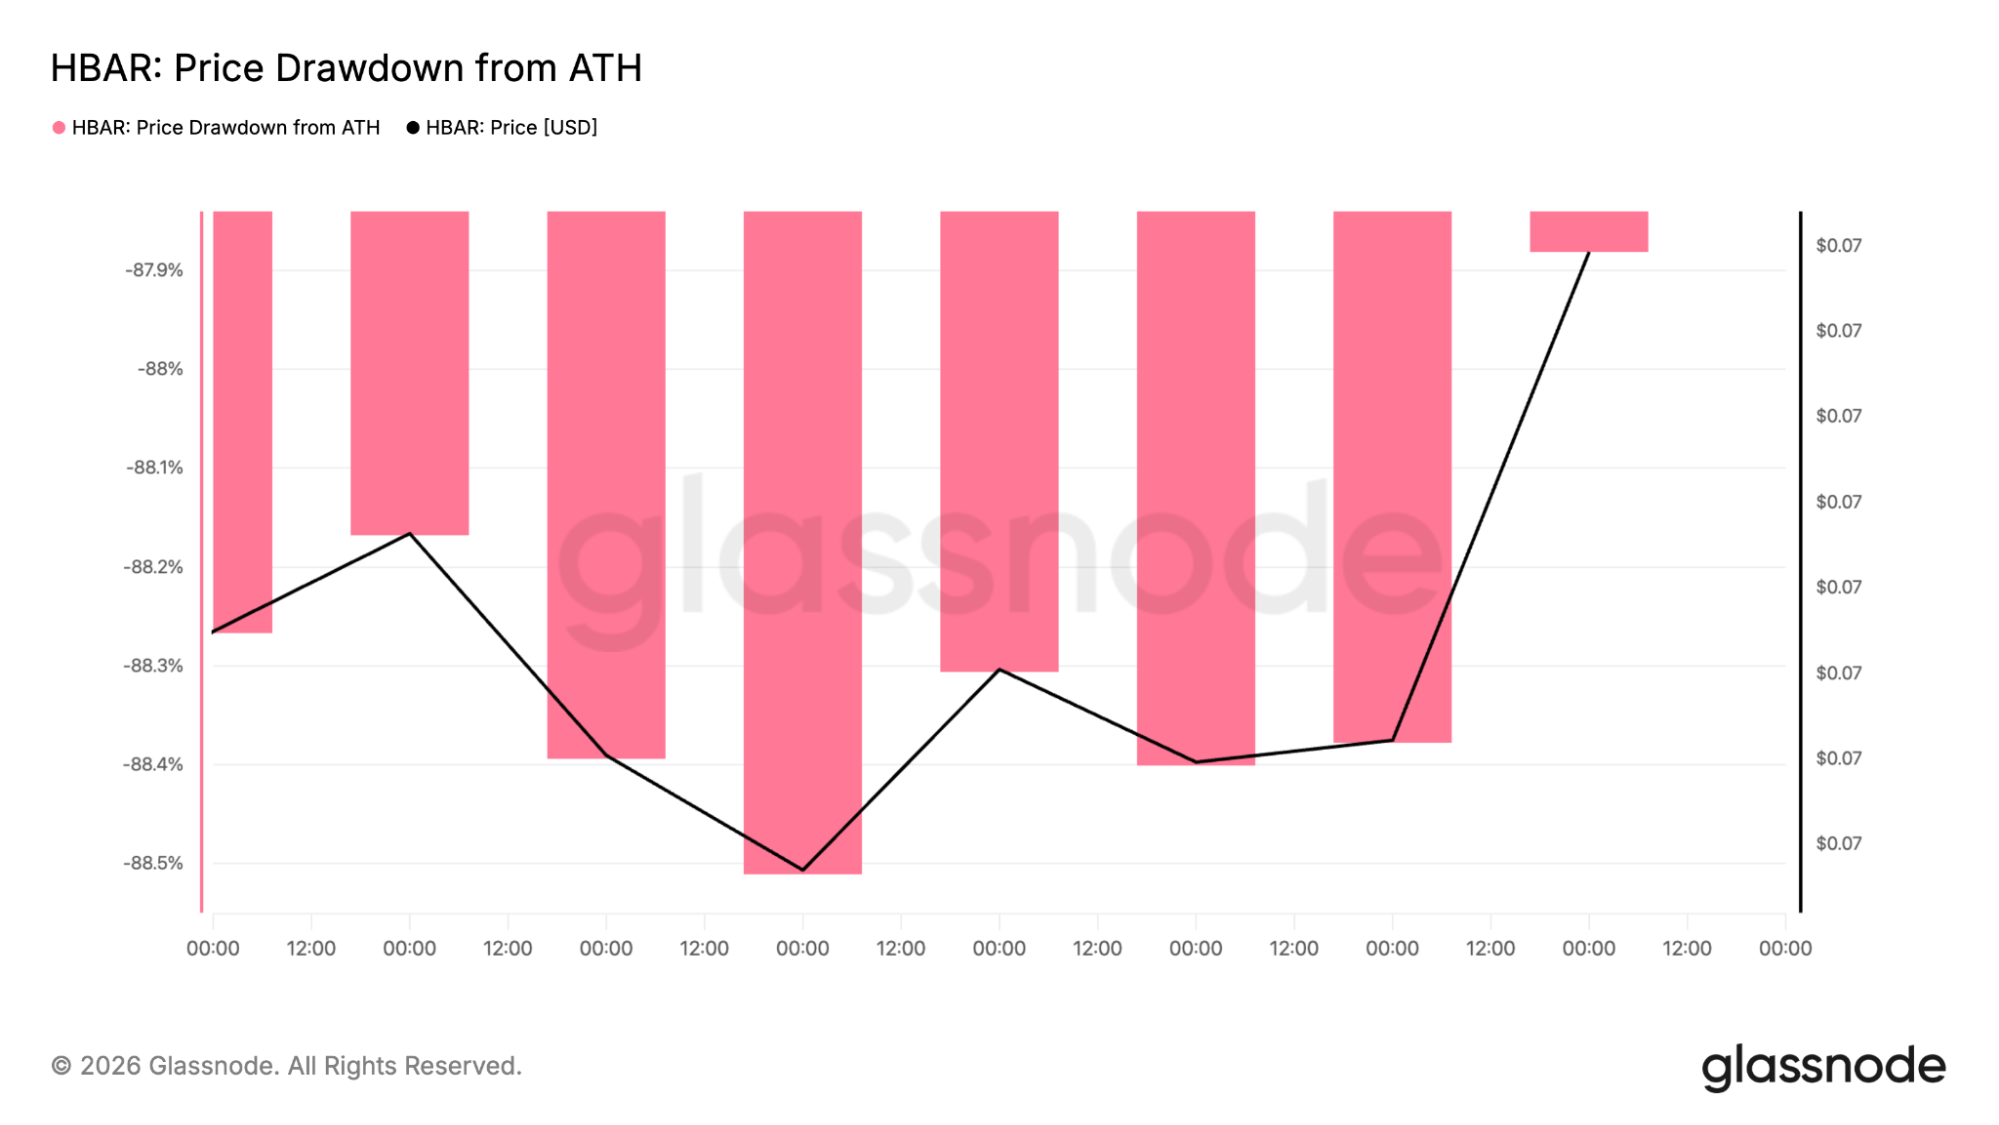
For instance, Bitcoin has dropped by 51.6% while Ethereum has lost 72% from their respective all-time highs over the same period. That puts HBAR much deeper into bear market territory.
ETF investors are showing renewed interest
Institutional money has also started flowing back into Hedera. HBAR spot ETFs recorded roughly $539,964 in net inflows after nine straight sessions without new capital. This has taken cumulative inflows up to almost $104.85 million, while total ETF assets increased to about $46.17 million.
Trading volume on those products has been close to $191,128 per day. While these are small figures compared to Bitcoin, Ethereum, XRP, and Solana ETF flows, they have their significance since they now account for 1.57% of the market capitalization of the Hedera network.
The next few sessions will be important. If ETF inflows continue, they could improve liquidity and provide extra support for the HBAR price. If they fade again, this may turn out to be nothing more than a short-term allocation.
What comes next for the HBAR price?
The HBAR price has reached a level that could determine its next major move. The long-term chart reveals the price making contact with the downward trend line which has consistently turned away all rallies in the current downtrend. A breakthrough could result in the HBAR price rising to $0.10, $0.115, $0.13, and potentially $0.15.
The shorter timeframes already favor buyers. The HBAR price remains above its 4-hour SMA 100, the BOS confirms improving market structure, and the daily RSI continues showing bullish divergence even though the broader trend remains below the 100-day moving average.
According to CoinCodex’s 1-month HBAR price prediction, the price is projected to reach $0.1061, implying upside potential from current levels if the HBAR price breaks above the $0.07195 resistance, reclaims the 100-day SMA at $0.08252, and sustains its recent recovery.
Source:: HBAR Price Prediction: Hedera Price Tests Key Breakout Zone as ETF Demand Rebounds