Key highlights:
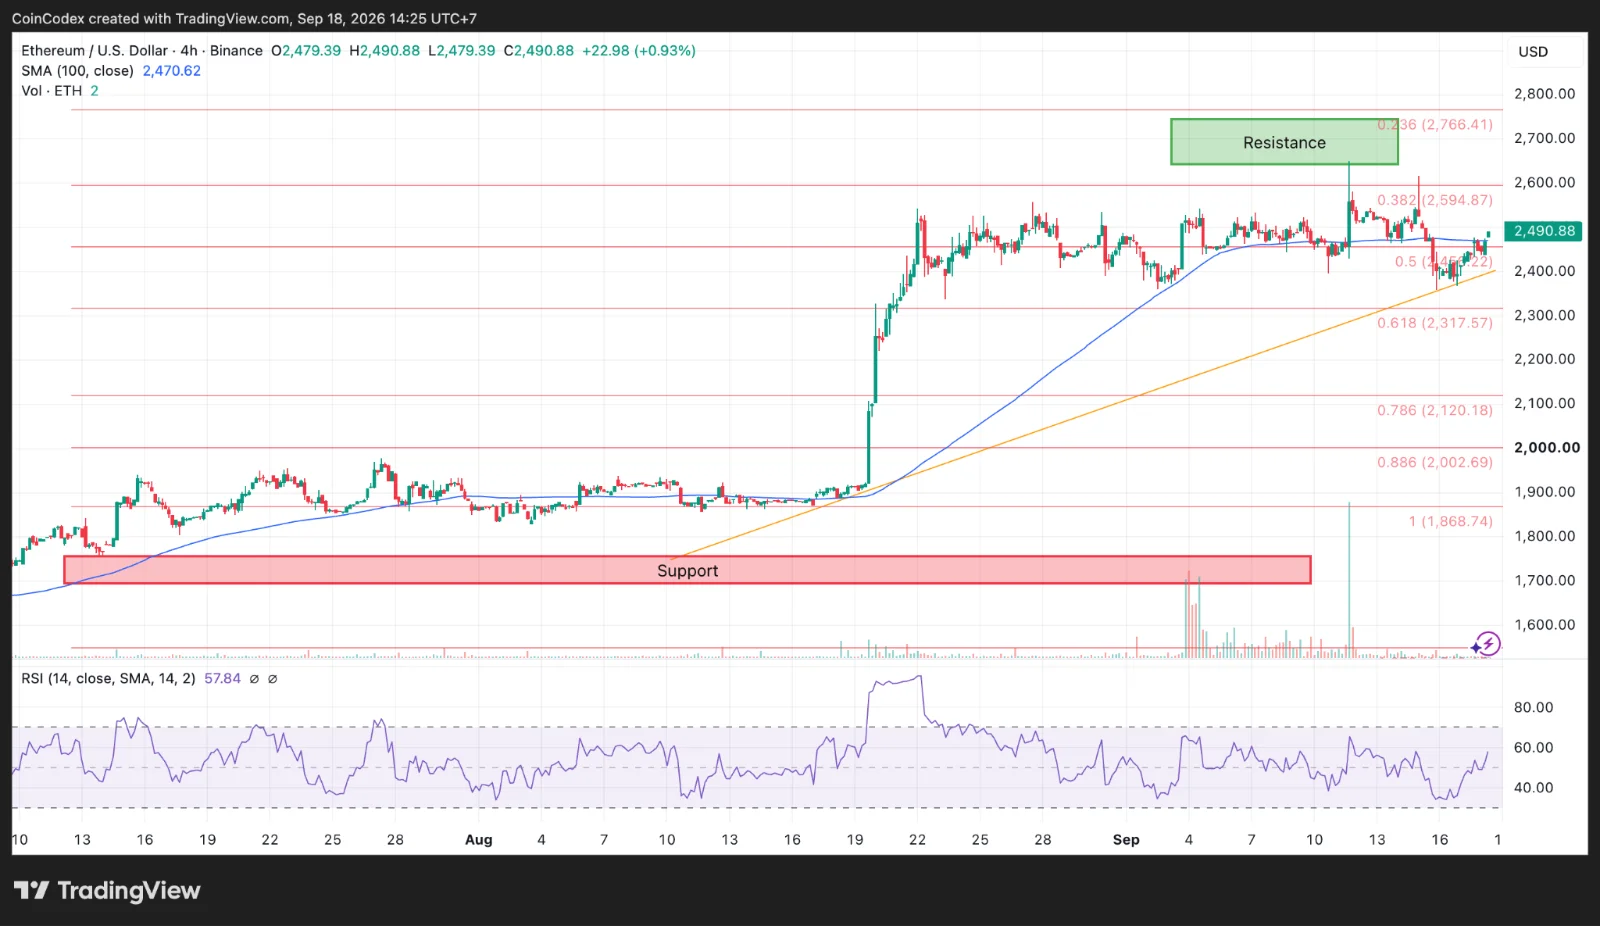
Ethereum is trading around $2,490, but it hasn’t really escaped its recent range. For now, the ETH price is stuck between $2,357 and $2,560, leaving traders waiting for a clear break before the next big move takes shape.
Crypto analyst Altcoin Sherpa pointed to the same range, noting that ETH needs to break out in either direction before the market gets a clearer signal. There are some encouraging signs underneath the price action.
Ethereum is trading above its 100-period moving averages on both the daily and 4-hour charts, network activity has recovered, and average transaction fees have dropped 86.8% from their April level. Still, the picture is far from one-sided. Spot Ethereum ETF demand has weakened, U.S. crypto regulation remains uncertain, and the ETH price still has several resistance levels to clear.
$ETH still the same range here, waiting for a break in either direction. Honestly it might just keep staying here pic.twitter.com/D1zPjNQlPl
— Altcoin Sherpa (@AltcoinSherpa) September 17, 2026
The ETH price is stuck in a range
We had a look at the Ethereum daily and 4-hour charts, and the setup is pretty straightforward. Ethereum is trading near $2,490, almost dead center in the $2,357–$2,560 range on the 4-hour chart. That makes the next breakout especially important.
4-hour ETH chart analysis
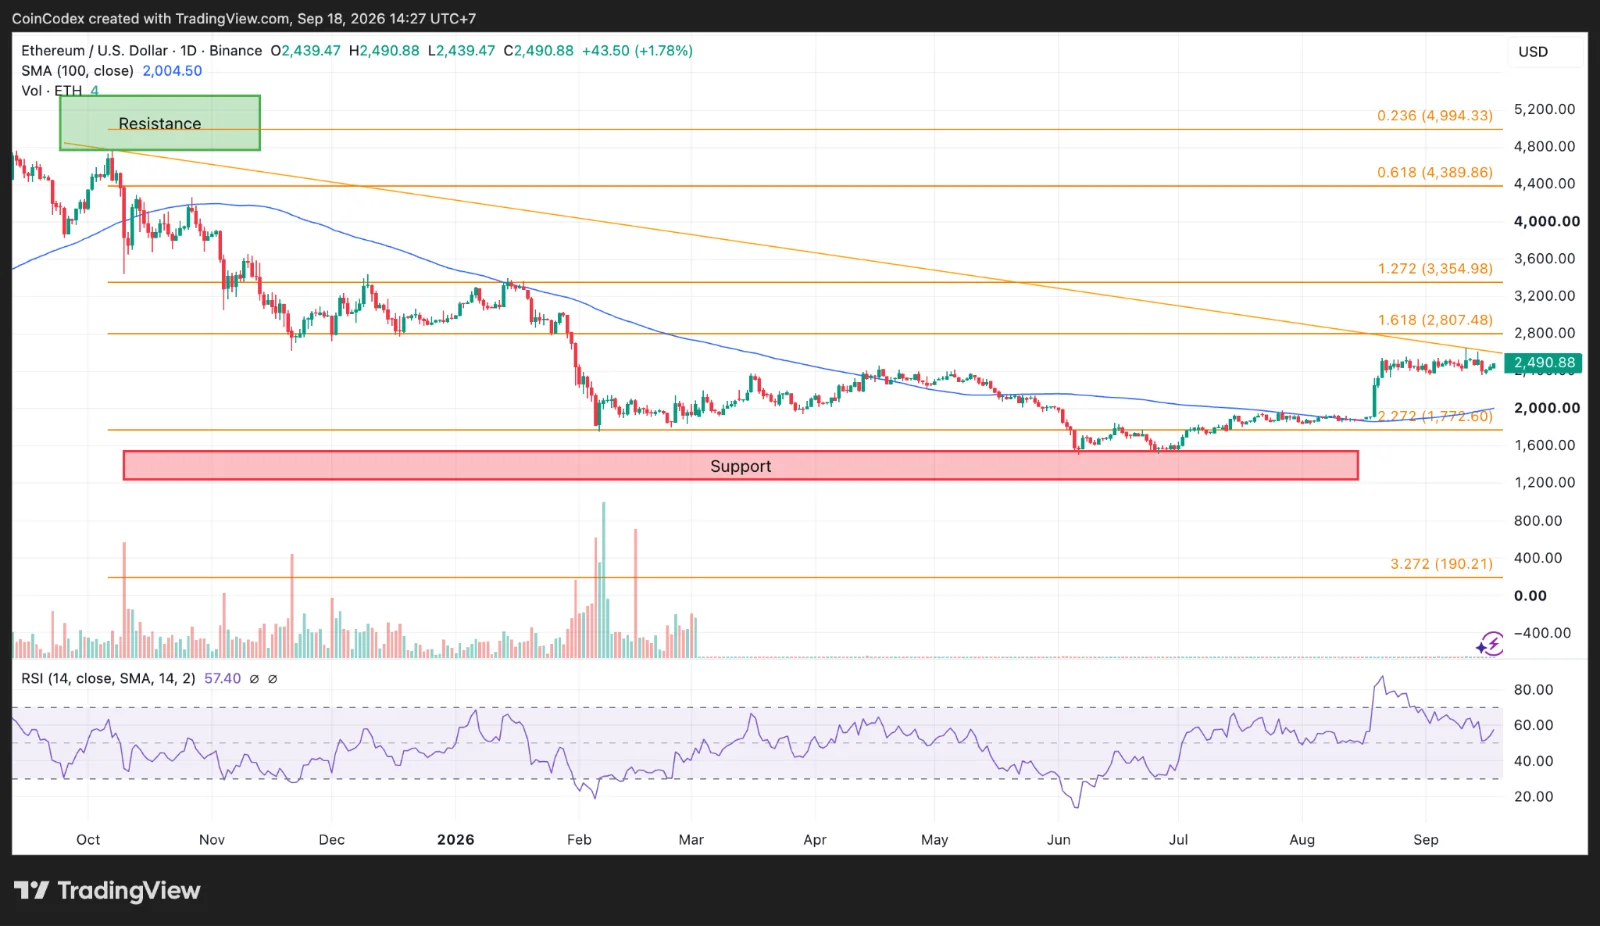
The first major resistance is the $2,594 level and it lines up with the 0.382 Fibonacci on the 4-hour chart. If the ETH price gets above it, attention shifts to $2,766 and $2,807. That $2,807 level is also the 0.618 Fibonacci on the daily, making the zone between $2,594 and $2,807 a key hurdle. Break through that, and the door opens toward $3,354, then $4,389 and $4,994.
The downside has clear levels too. The 4-hour 100-period SMA sits around $2,470, just below the current price. A move under it could bring $2,317 and $2,120 into play, with the daily 100-period SMA around $2,004 sitting below those.
Daily ETH chart analysis
Momentum isn’t stretched. The daily RSI is 57.40, and the 4-hour RSI is 57.84. Both are above 50, but neither is close to overbought. So there’s room to move in either direction.
Ethereum fees have dropped as the ETH price recovered
One of the more interesting parts of Ethereum’s recent performance is what has happened to transaction fees. Santiment data shows the average Ethereum transaction fee falling from $0.715 on April 21 to $0.094 on September 17. That works out to an 86.8% decline.
💸 Ethereum transaction costs have dropped considerably. Since the year’s peak fees of $0.72 per transfer back on April 21st, $ETH costs just $0.095 per transfer today, even with ETH trading at a higher market value now.
📉 Softer mainnet demand through the bearish summer helped… pic.twitter.com/gaWkEKUN25
— Santiment Intelligence (@SantimentData) September 17, 2026
At the same time, the ETH price climbed from roughly $1,497 to around $2,452, a recovery of about 63.8%. The lower fees are tied to improvements in Ethereum’s capacity, including Fusaka, higher blob throughput, a 60 million gas limit and greater use of Layer 2 networks.
These developments allow more activity to take place without putting the same pressure on Ethereum’s mainnet. That is good news for users, but there is another side to the equation. Ethereum also burns part of its transaction fees through EIP-1559.
With fees falling, the amount of ETH burned in dollar terms has dropped from roughly $1.37 million in April to about $83,000 in September. So cheaper transactions make the network more accessible, but they also mean less ETH is being removed from circulation through fee burning.
Ethereum’s network activity is moving higher
The on-chain numbers give the ETH price another interesting piece of context. Active addresses have recovered from around 280,000 to roughly 465,000. Ethereum transactions have also climbed from about 1.45 million to approximately 1.93 million.
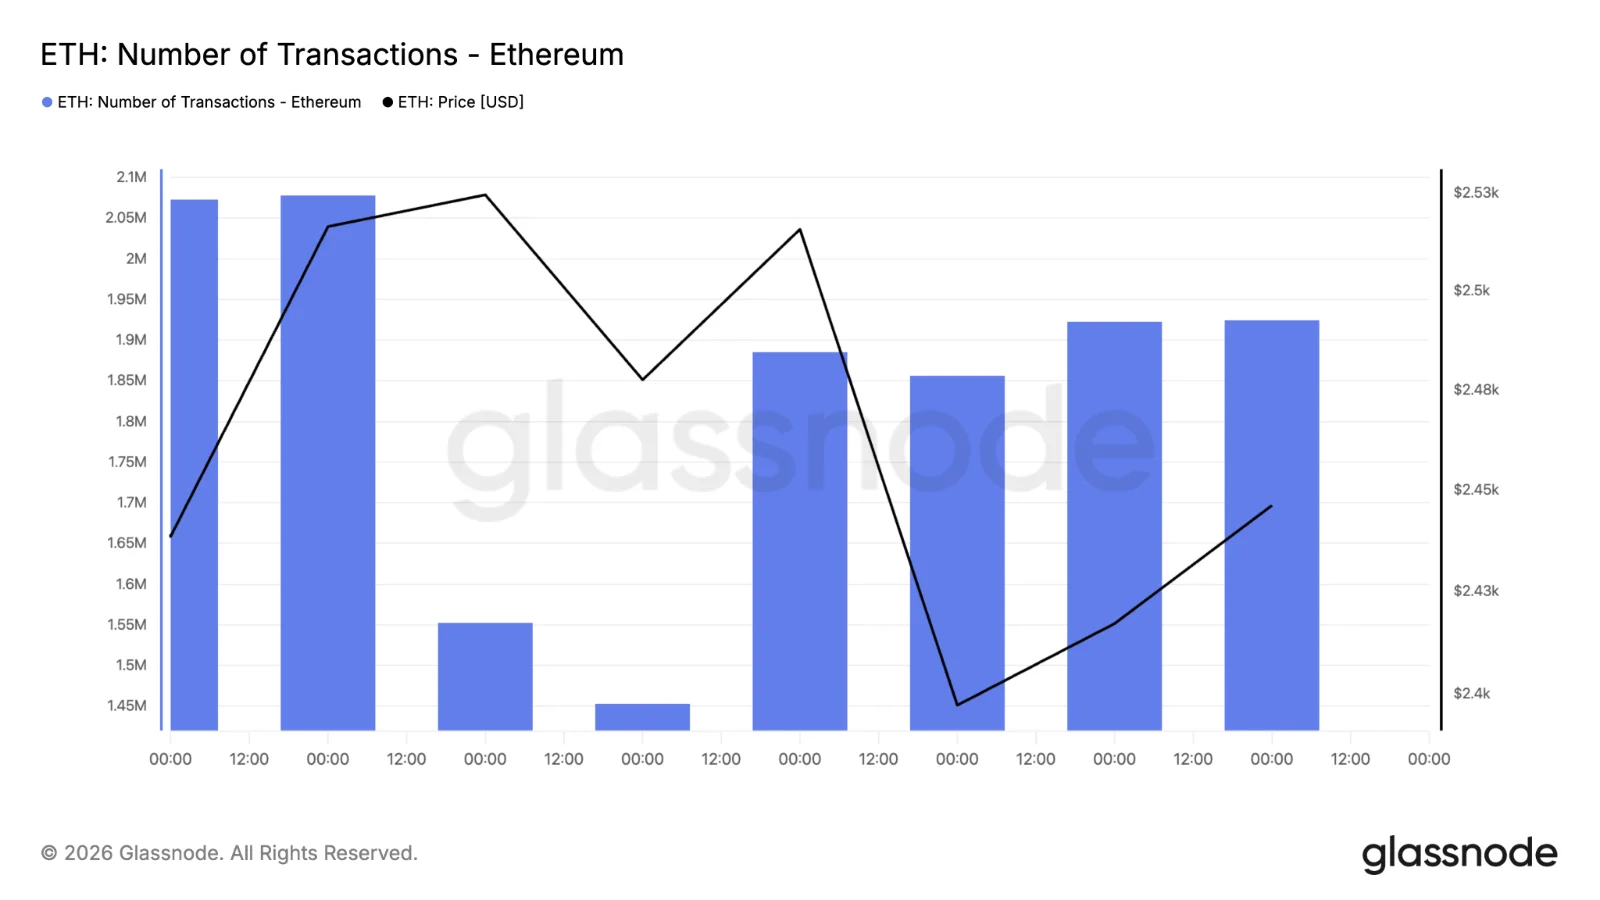
The numbers have been higher during this period. Active addresses reached roughly 480,000, and transactions climbed to around 2.1 million before easing back. Still, the latest recovery is worth watching because network activity has improved alongside the ETH price.
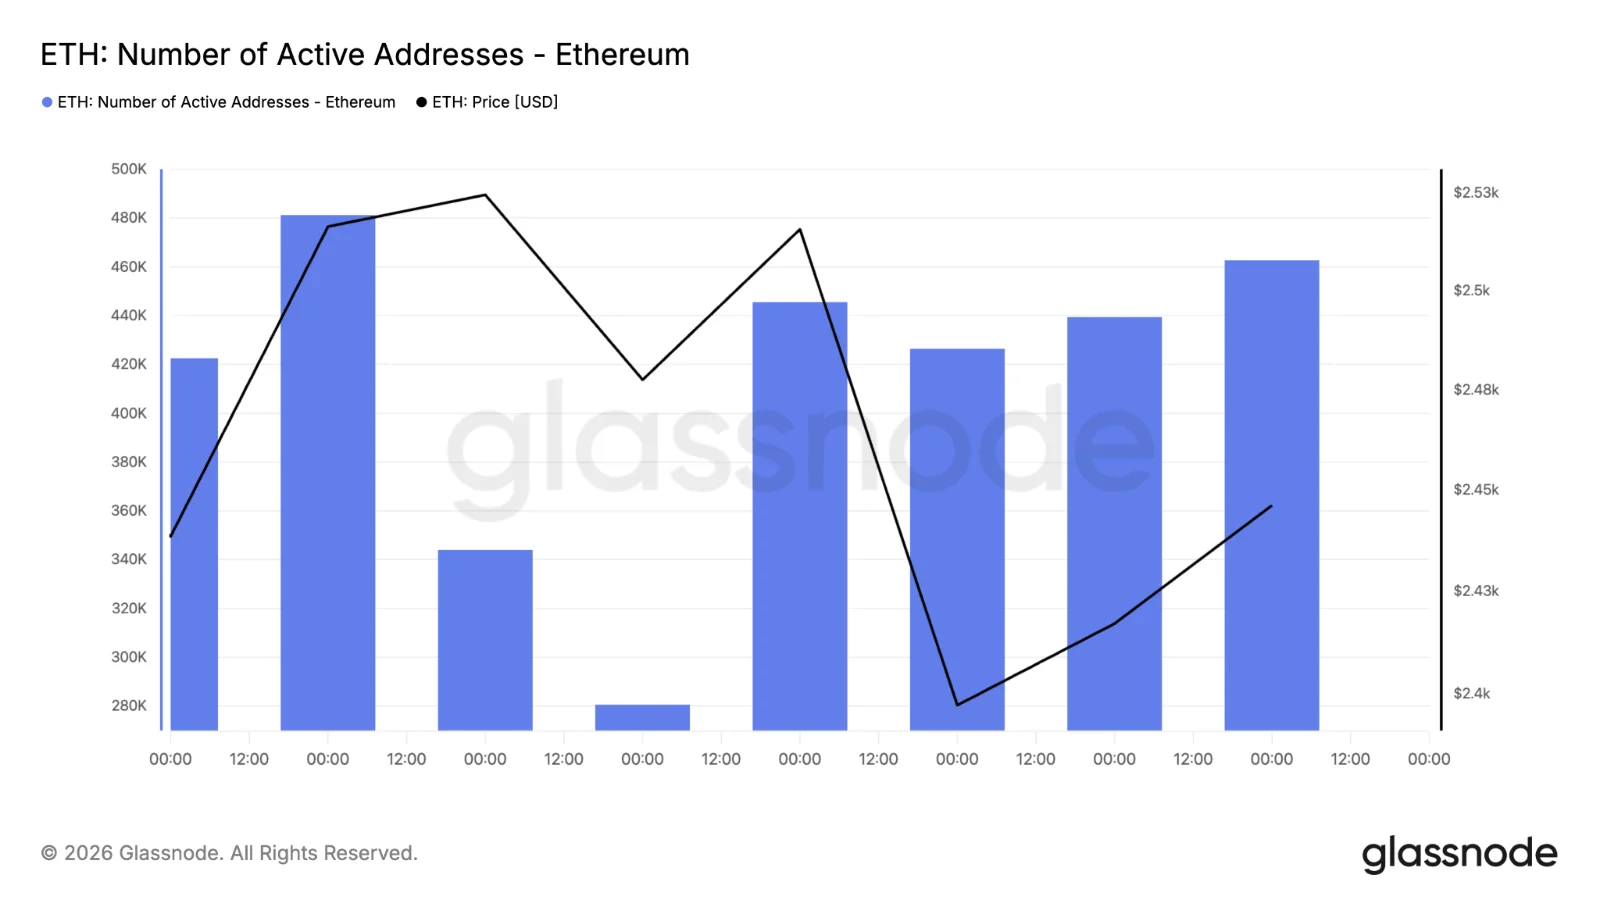
That does not mean higher activity automatically leads to a higher price. It simply gives the current recovery more fundamental context. If active addresses move above 500,000 and transactions return above 2 million, Ethereum would be back near the stronger end of its recent activity range. If active addresses fall toward 350,000 and transactions decline, that would point to weaker network usage. For now, the data points to recovery, but not yet a major breakout in activity.
Ethereum has catalysts, but there are risks too
Ethereum’s roadmap gives investors plenty to watch beyond the current price range. Vitalik Buterin’s updated Strawmap outlines development targets extending through 2029, including post-quantum security, native privacy and deeper rollup integration.
The roadmap also targets around 10,000 transactions per second on Ethereum’s base layer and as much as 10 million transactions per second across Layer 2 networks. These are targets rather than current performance figures, so execution will be important.
Institutional infrastructure is also developing. Coinbase’s partnership with Stablecore is designed to help U.S. community banks access crypto infrastructure. At the same time, recent spot Ethereum ETF outflows show that demand through that channel has weakened.
The U.S. Senate’s failure to advance the Digital Asset Market CLARITY Act leaves important crypto market-structure questions unresolved. Restrictive Federal Reserve policy also remains a potential source of pressure for risk assets such as ETH.
What comes next for the ETH price?
For now, the ETH price is still stuck between $2,357 and $2,560. The market needs a decisive move outside that range. A break above $2,594 would bring $2,766 and $2,807 into focus. If Ethereum clears those, the next major targets on the daily chart are $3,354, $4,389, and $4,994.
On the downside, losing the $2,470 level could send ETH toward $2,317 and $2,120. Below those, the daily 100-period SMA around $2,004 becomes an important support area. CoinCodex’s 1-month ETH price prediction places the price at $ 2,428.28, implying that analysts expect Ethereum to trade below current levels over the coming weeks.
Source:: Ethereum Price Prediction: ETH Fees Fall 87% While the Price Climbs 64%