Santiment also pointed to continued demand from U.S. spot Bitcoin ETFs during September. Strategy added another 1,665 BTC to its treasury during the month, providing another source of Bitcoin demand.
These flows do not guarantee that the BTC price will continue higher, but they form part of the market backdrop heading into Q4. The macro data supplied by Santiment also showed cooler-than-expected August inflation.
That briefly pushed Treasury yields lower and reduced expectations for another Federal Reserve rate hike. Crypto responded more strongly than stocks during that period, helping Bitcoin post a stronger September performance.
The Bitcoin monthly chart puts $83,507 under the microscope
More Crypto Online pointed out that Bitcoin closed September above its 50-week SMA and above the May high. The monthly chart places the BTC price around $83,507, right at the upper boundary of a broad Fibonacci zone stretching from $38,200 to $83,507.
Inside that range, the key Fibonacci levels include $78,600, $61,800 and $50,000. These levels become important if Bitcoin fails to hold the current structure and starts moving lower. The chart also uses an Elliott Wave count that labels the present phase as a possible Wave (c) correction inside a larger cycle.
The broader count tracks Bitcoin’s previous major market phases through the 2011, 2015, 2018 and 2022 lows. For the bullish scenario, the chart places $83,507 at the top of the marked resistance zone.
A sustained break above this level would put $120,000 into focus. From there, the chart’s larger projection reaches toward $240,000. The bearish scenario looks different. A rejection from the current area could send the BTC price toward $61,800, which represents the 61.8% Fibonacci level.
Bitcoin’s on-chain activity sends mixed signals
The on-chain data from Glassnode gives us another part of the BTC price picture, and this is where things become less straightforward. Active Bitcoin addresses have recovered from roughly 555,000 toward 710,000.
At the same time, the BTC price has remained around the $83,600-$84,400 area. That means active addresses have picked up even though Bitcoin has been trading inside a relatively tight price range.
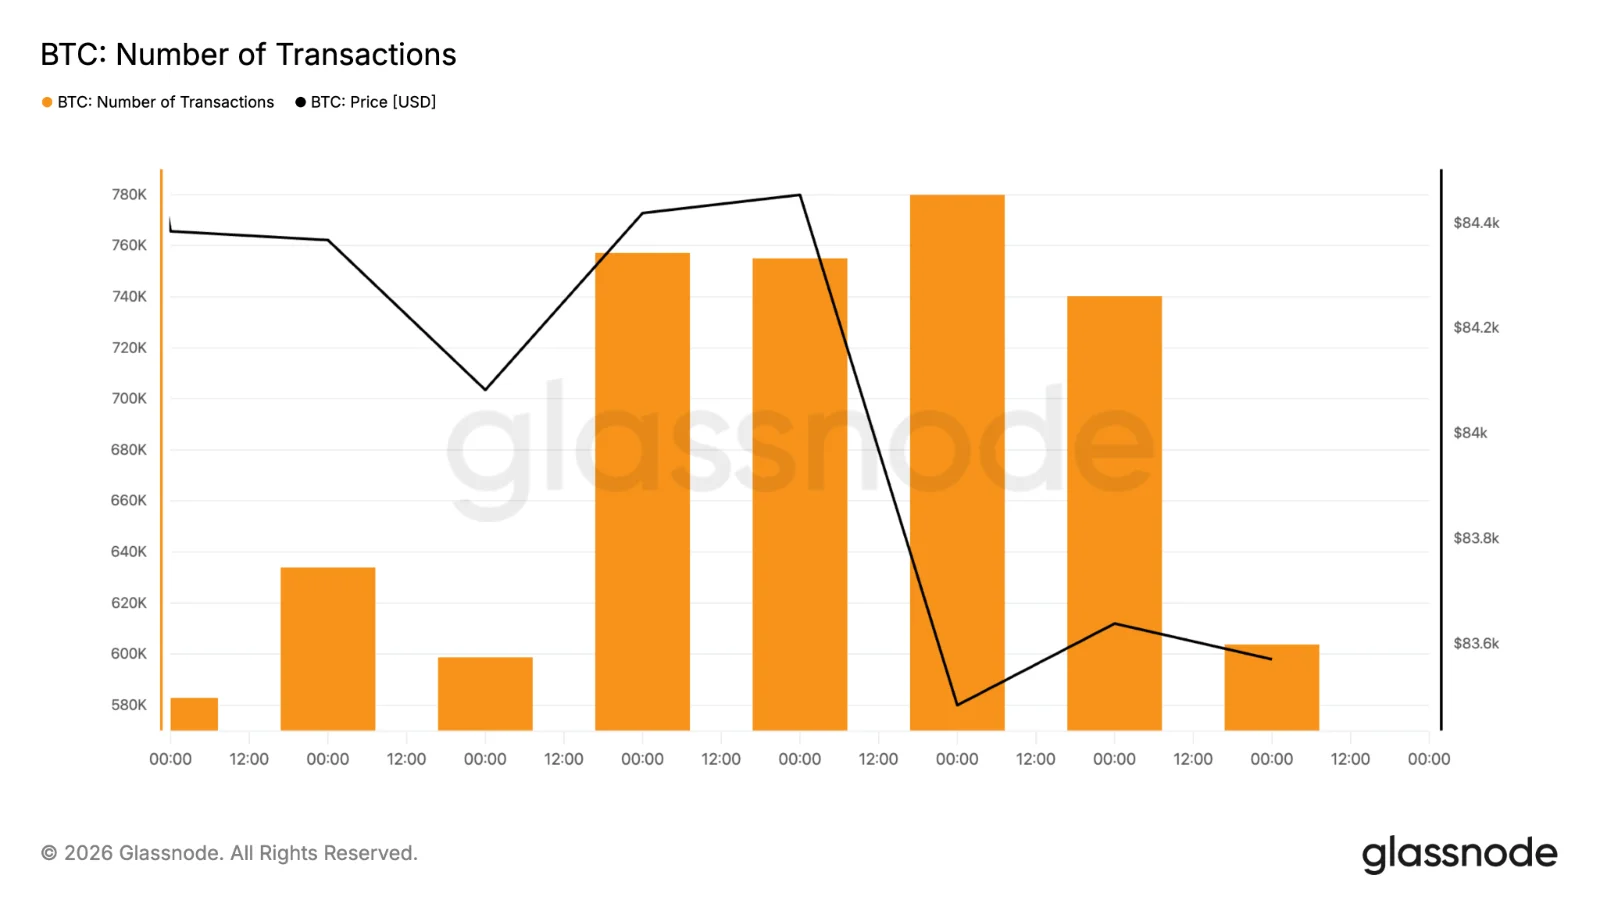
Transaction activity tells a different story. The supplied data shows Bitcoin transactions falling from roughly 780,000 toward 605,000. So, the number of active addresses has recovered, but the total number of transactions has moved lower.
Where could the BTC price go next?
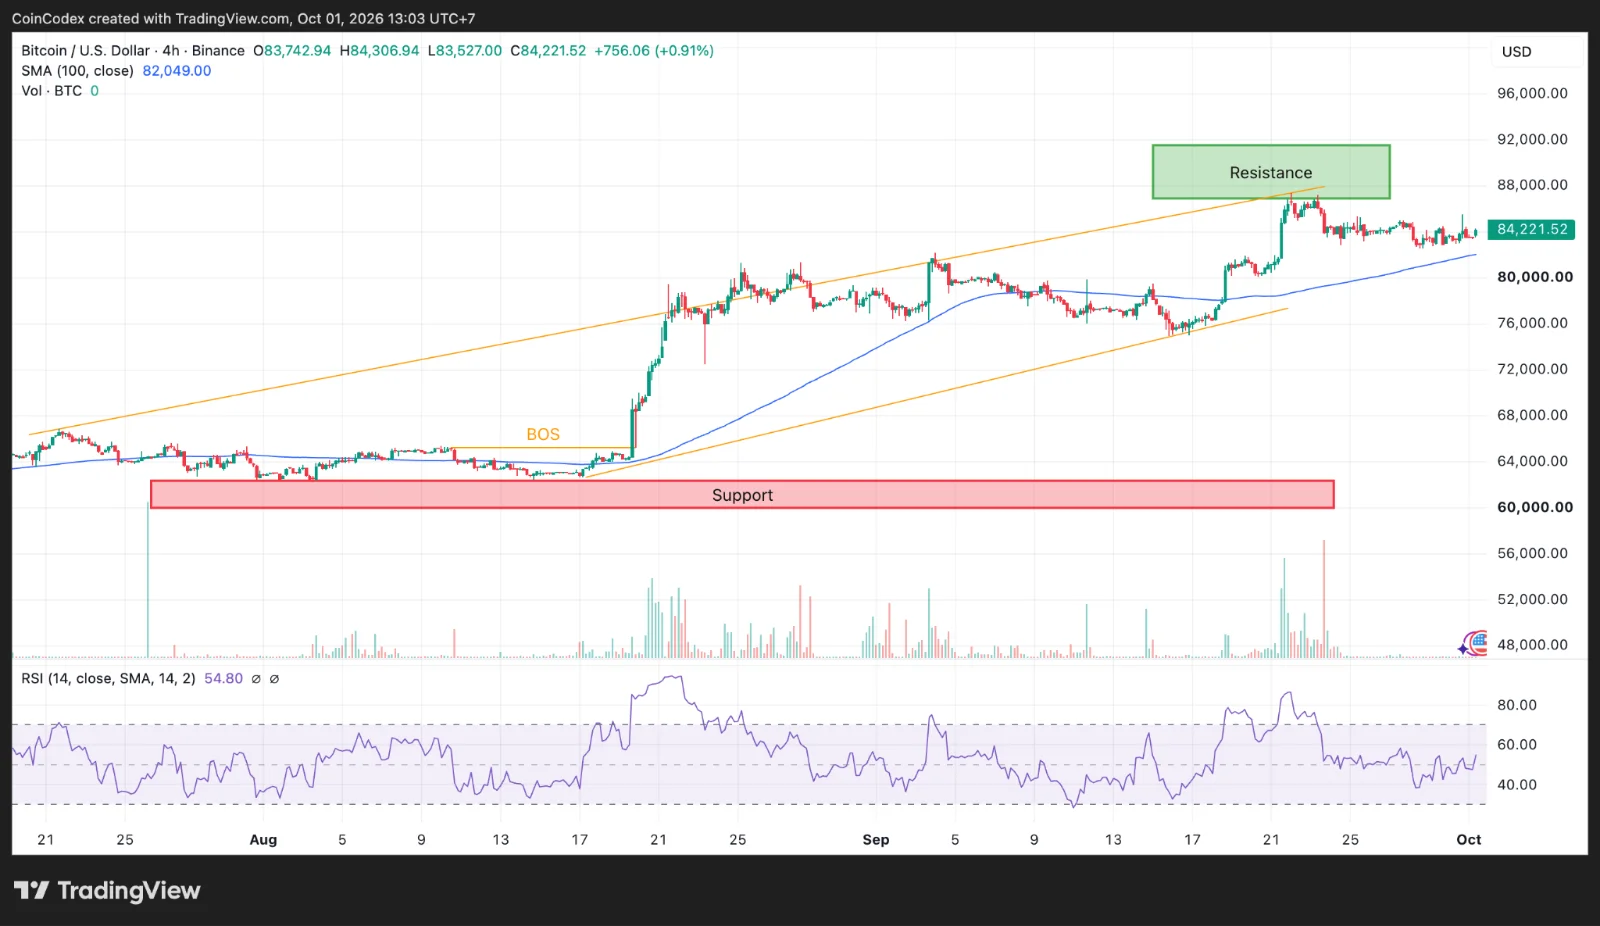
The first major technical test for Bitcoin is the $88,000-$89,785 zone. A break above $89,785 would put $108,738 and $121,980 on the radar. The bearish scenario starts with a loss of $82,049. If Bitcoin falls below the 4-hour SMA, $80,000 becomes the first major support to watch.
For now, the BTC price remains above its key moving averages, Bitcoin has outperformed gold and the S&P 500 during September, and BTC closed the month above its 50-week SMA and May high.
CoinCodex’s 1-month Bitcoin price prediction places the price at $83,040, implying that analysts expect the BTC price to trade slightly below current levels over the coming weeks.
Source:: Bitcoin Price Prediction: BTC Nears $88K as Network Activity Sends Mixed Signals