Key highlights:
- The SUI price finally broke above a year-long downtrend after a massive 45% weekly rally.
- Traders are watching the $1.50 resistance zone closely as momentum indicators turn bullish again.
- Despite strong momentum, overbought RSI levels hint that short-term consolidation could happen before another move higher.
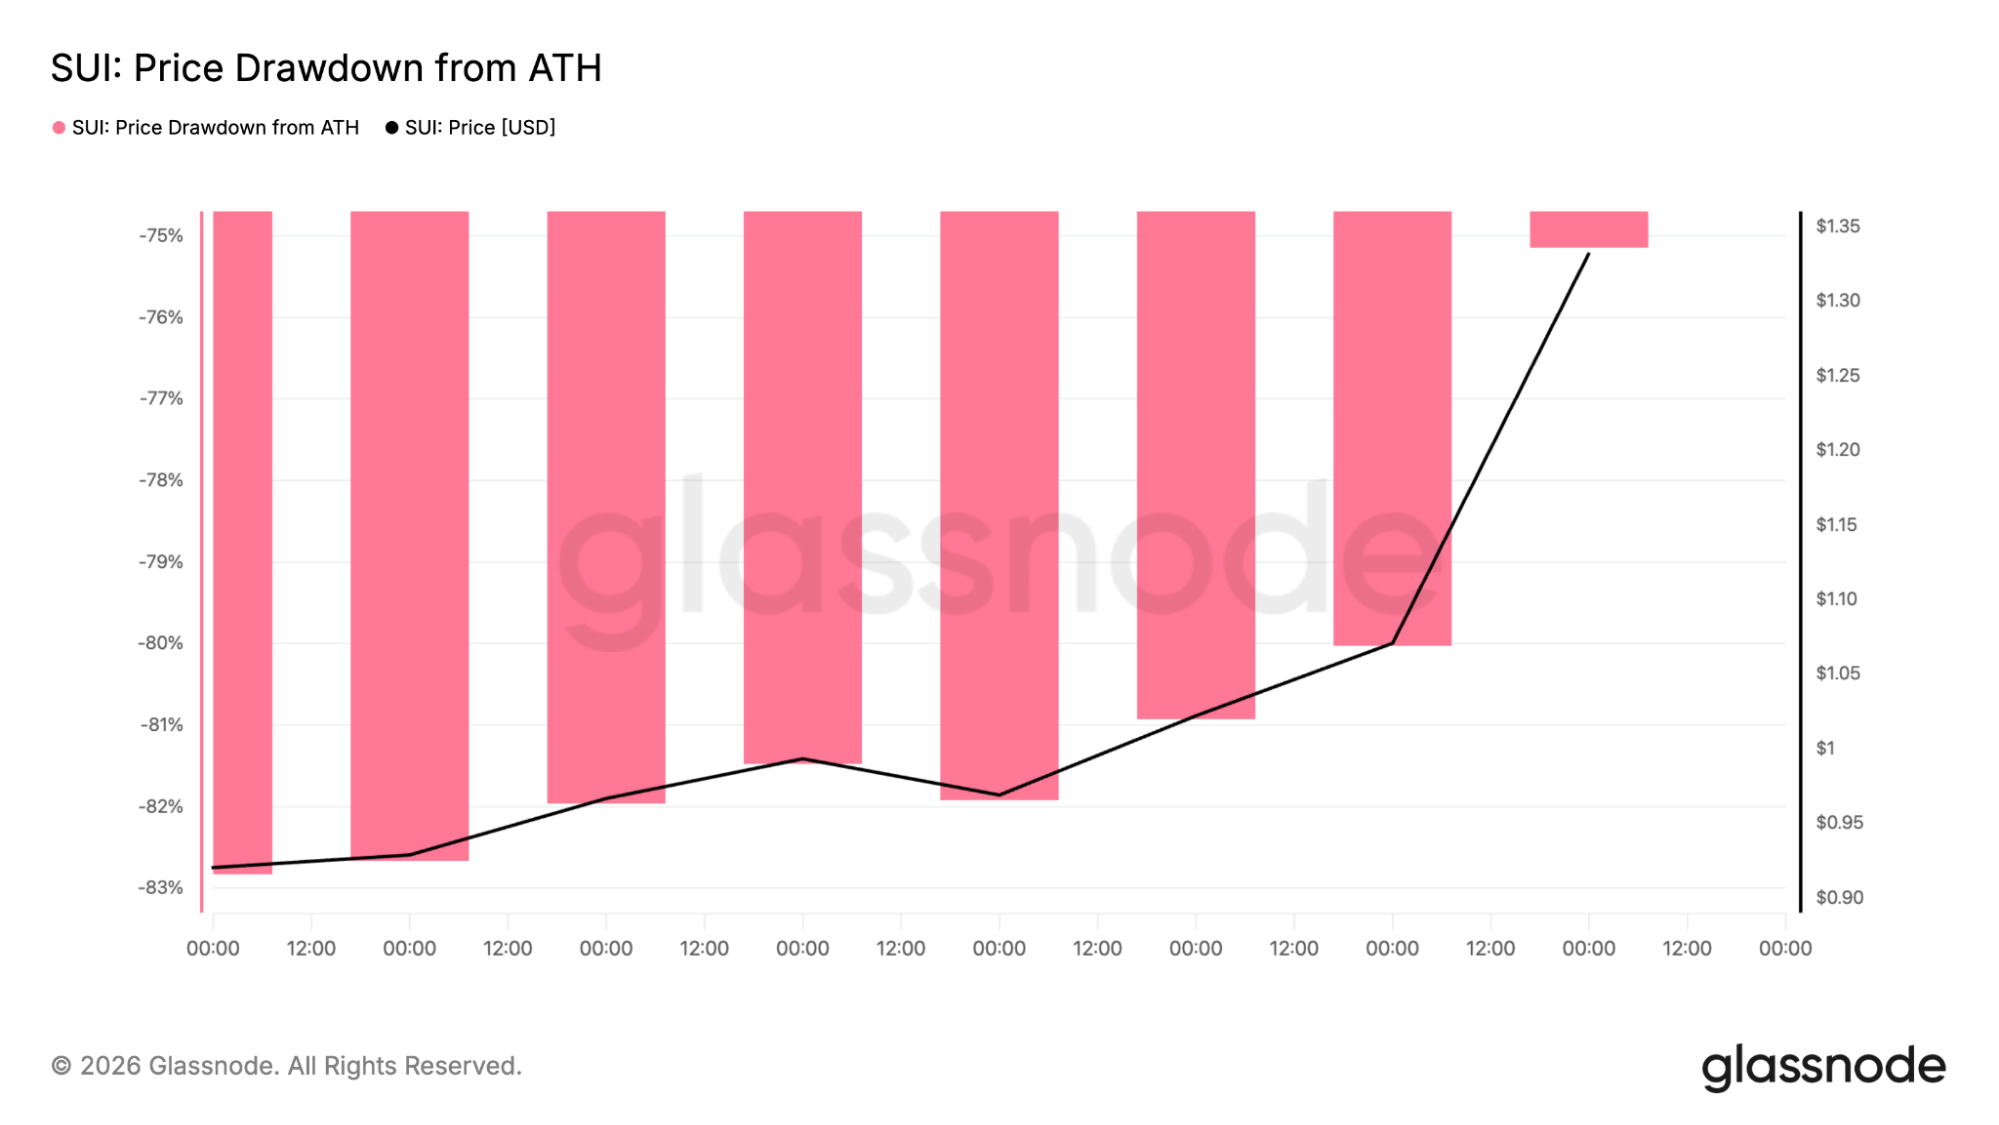
SUI spent most of the past year frustrating traders. Every rally attempt failed, momentum kept fading, and the market slowly lost confidence after the massive collapse from its highs. At one point, SUI was down roughly 77% from its all-time high, which pushed many traders to completely move on from the project.
But things suddenly look very different now. Over the past few days, the SUI price moved higher with one of its strongest weekly moves in months. Volume flooded back into the market, bullish momentum indicators started turning upward again, and traders immediately noticed something very important on the chart.
The SUI price finally broke above the downtrend that had been controlling price action for almost a full year. That breakout is why people are talking about SUI again.
Analyst thinks the SUI trend has finally changed
Crypto analyst Dami-DeFi posted a SUI chart this week after pointing out that the token finally pushed through its long-term descending trendline. This was not some tiny breakout either. The SUI price climbed nearly 45% in a single week, which completely changed the structure traders had been watching since the July 2025 highs.
While you were sleeping, $SUI broke a trendline that held for almost a year$SUI just broke above the descending trendline that’s been capping it since the July 2025 highs and it did it on a 45% weekly candle.
That’s not a quiet breakout.
The weekly MACD just flipped bullish… https://t.co/8IvcUGl9AQ pic.twitter.com/Vslw1RbaQg
— Dami-Defi (@DamiDefi) May 11, 2026
Dami also pointed out that momentum indicators are starting to recover together for the first time in months. The weekly RSI bounced from deeply oversold territory near 34 and climbed back toward neutral levels, showing buyers are returning after a long period of weakness.
The MACD is also starting to curl upward on the weekly chart. That matters because weekly indicators move slowly, and reversals on higher timeframes often attract much more attention from swing traders and investors.
At the moment, the immediate hurdle to the SUI price is at the $1.50 level. Should the bulls be able to overcome this level decisively, then we should see sellers eyeing the next resistance level at $2.20 to $3.00. The bullish trend remains intact as long as SUI does not fall below the $1.10 level.
SUI is recovering from one of the deepest altcoin drops
Glassnode data shows just how brutal the previous decline was. The SUI price dropped roughly 77% from its all-time high near $5.50 before finally finding support around the $1 region. In crypto, though, that kind of collapse is not unusual for layer-1 projects. Several major altcoins went through similar crashes before eventually recovering during the next market cycle.
What traders are watching now is whether SUI can rebuild momentum fast enough to attract fresh capital again. SUI’s market cap still sits around the mid-tier layer-1 range near $4 billion. That leaves plenty of room for expansion if the altcoin season keeps improving. Traders are already comparing SUI to projects like Avalanche and NEAR during earlier growth phases.
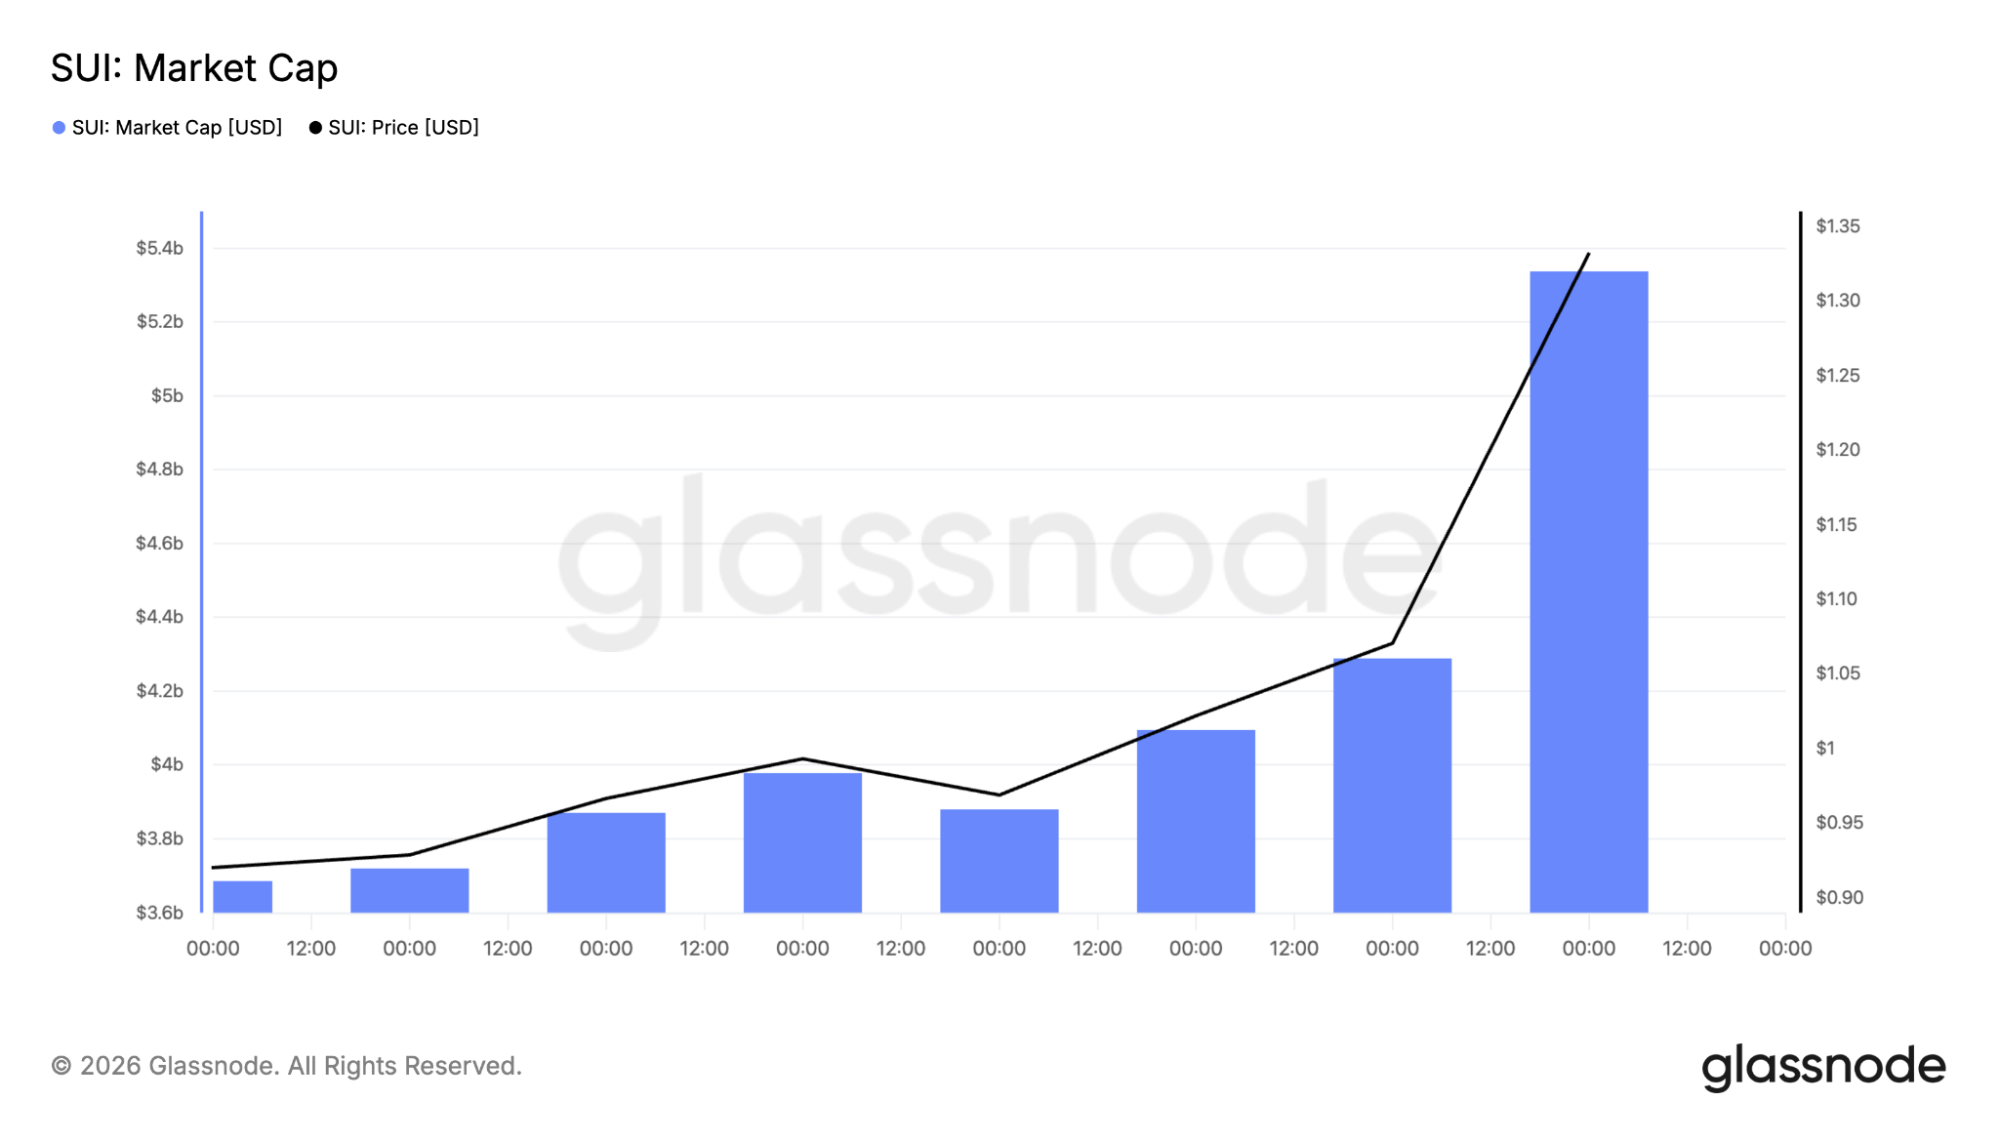
If the SUI price eventually pushes the market cap toward $10 billion, the token could trade somewhere near the $3 area. That lines up closely with the resistance targets traders are already discussing.
The SUI charts still show some short-term risks
We had a look at the SUI daily chart, and the bigger picture still looks bullish. The SUI price is currently trading much higher than its 100-day moving average at $0.95, which indicates that the buyers might still be controlling the price action. The previous resistance level at $1.00 has become a strong support level now, but only if the momentum starts to ease off after the breakout.
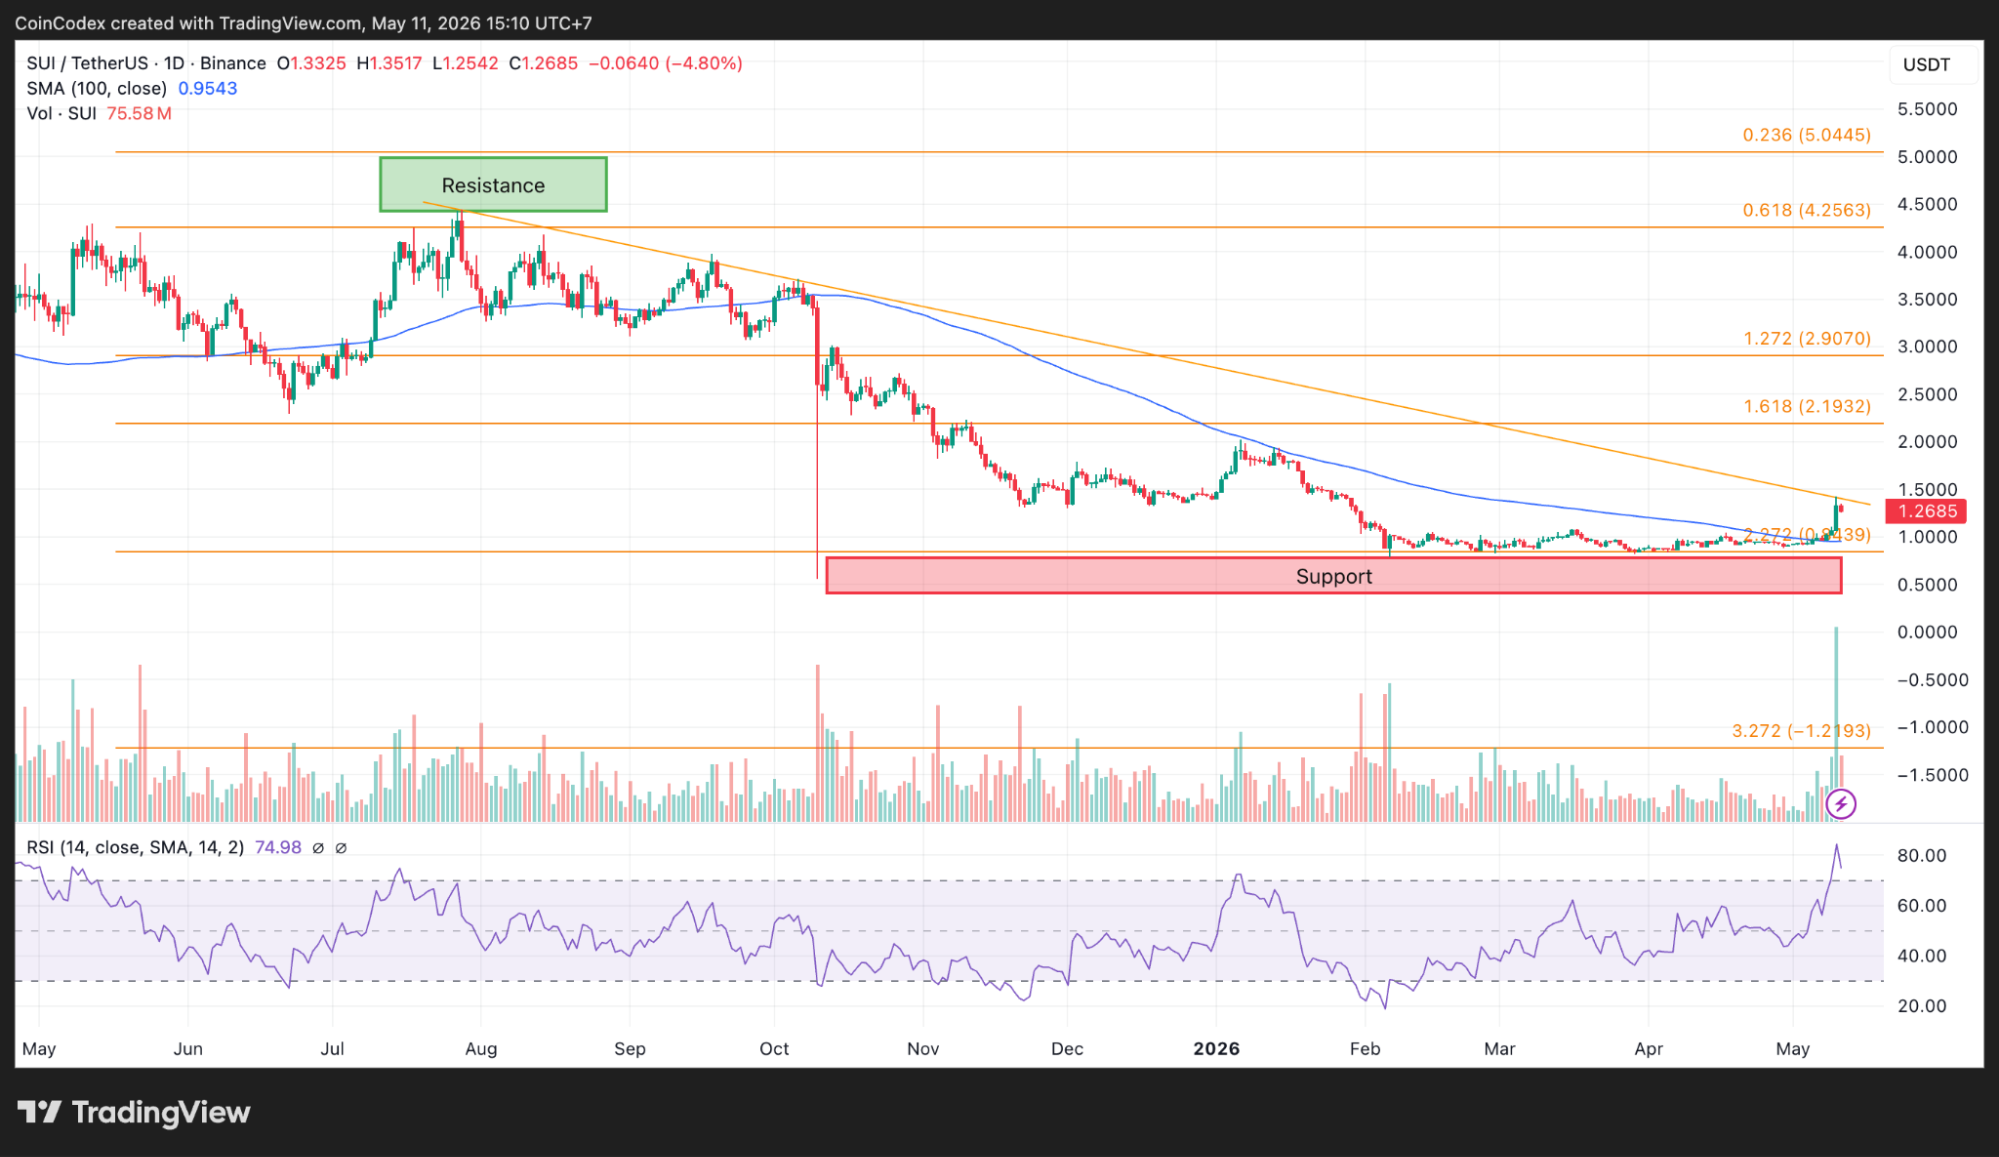
Daily SUI price chart analysis.
Investors should keep in mind some of the critical Fibonacci levels drawn on the chart as well. The first significant resistance level appears between $1.50-$1.60. Once the price breaks out of this resistance, the investors would aim for the next levels at $2.20 and even $3.00.
On the other hand, the Relative Strength Index (RSI) is already close to being in overbought conditions, so some consolidation is expected before proceeding with the next move.
As seen in the 4 hour chart, the SUI price still manages to maintain itself well above the 100-period moving average around $0.97, maintaining the uptrend, but at the same time, traders need to be aware that profit-taking may occur following such an enormous surge.
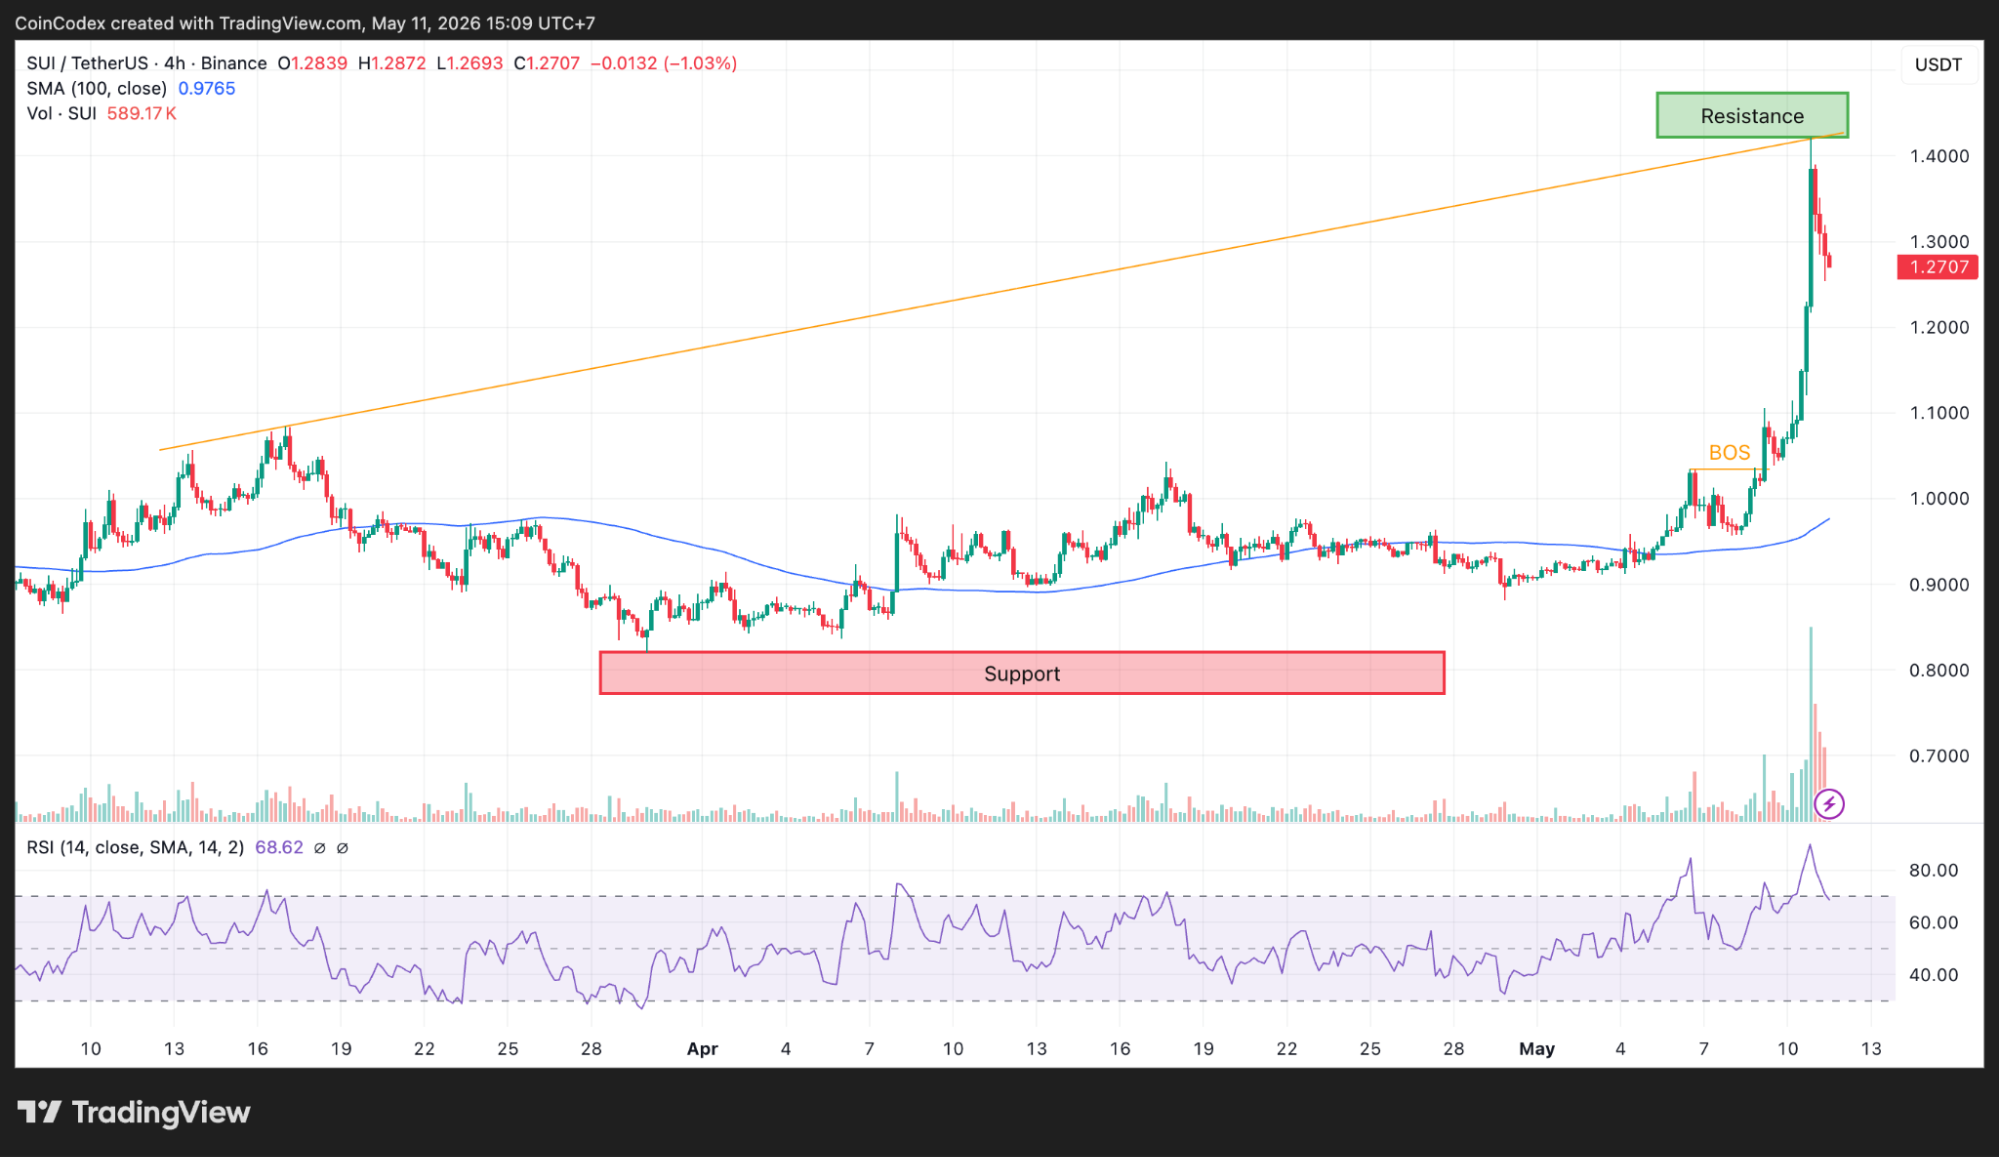
4-Hour SUI price chart analysis.
As long as the $1.00-$1.20 area remains defended by buyers, the bullish setup will remain intact. On the upside, the next critical area to consider will first be $1.40 before considering a more substantial level near $2.20, and $3.00.
For now, the difference is simple: SUI finally broke the trendline that trapped the market for months. After a long period of weakness, traders are finally seeing momentum return, and that alone is enough to put the SUI price back on the radar again.
Can the SUI price keep running?
Right now, the SUI price is one of the stronger charts in the altcoin market. A break above this trendline marked a shift in sentiment regarding SUI, particularly after several months of sluggish price action. The on-chain metrics have been improving rapidly, volumes have surged, and traders have become much more interested in the SUI token once again.
However, market cycles do not always follow an upward trajectory without any pauses. After this strong upward price movement, many traders now anticipate that the SUI price may pause for a while before the next wave begins to form. For this to happen, buyers must be able to hold on to the important support levels at $1.20 and $1.00.
CoinCodex’s 1-month SUI price prediction places the price at $0.9932. The price is lower than the current market price and hence ranks amongst the more conservative forecasts considering the positive trader sentiment after the breakout.
Kraken: Best crypto exchange for security & reliability
- Buy, sell, and trade 400+ cryptocurrencies with industry-leading security
- Spot, Futures & Margin trading – leverage up to 5x for advanced traders
- Earn rewards with staking on top cryptocurrencies
- 24/7 customer support and high liquidity for fast trades
- Regulated in the US with strong compliance and security measures
- 13+ million users worldwide
Disclaimer: This content is for informational purposes only and does not constitute financial, investment, or other advice. Nothing on this page is a recommendation or solicitation. Always seek independent professional advice before making investment decisions. Some links may earn us a commission at no extra cost to you.
Source:: SUI Price Prediction: SUI Breaks the Trendline That Held Since 2025