TRON has been one of the quietest performers in the top 20. No hype. No headlines. Just a chart that has been building something massive for six years. Crypto Patel says TRX is quietly forming one of the cleanest charts in the market.
A 6-year support trendline holding strong. Two solid accumulation zones backing the price. And a structure that points toward a much bigger move ahead. As long as $0.22 holds, the path to $3 remains wide open. That is a 9x move from current levels.
The TRX price is at $0.33 today. $3 would be an 800% gain. The chart says it is possible. The on-chain data says the network is ready. The only question is patience.
The chart that has been building since 2020
We had a look at the weekly chart from Crypto Patel. The structure is a textbook. A long-term rising support trendline has been in place since 2020. Each major correction over this period has respected this line. That confirms a consistent base of demand across multiple market cycles. The TRX price is trading at $0.3287, up 2.30% on the week, sitting well above that trendline.
$TRX Is Quietly Forming One Of The Cleanest Charts In The Market.
A 6-Year Support Trendline Holding Strong, Two Solid Accumulation Zones Backing The Price, And A Structure That Points Toward A Much Bigger Move Ahead.
As Long As $0.22 Holds, The Path To $3 Remains Wide Open 🚀… pic.twitter.com/xT4J2GKwQv
— Crypto Patel (@CryptoPatel) April 21, 2026
Two accumulation zones are visible on the chart. The first is located around $0.10 to $0.15, where the TRX price spent a long consolidation phase before breaking higher. The second zone is between $0.22 and $0.28, which is where the TRX price is currently holding.
This progression shows that accumulation is occurring at higher levels over time. That is a sign of strength. The TRX price is not falling back to old lows. It is building new floors at higher prices.
On the upside, the chart shows a multi-stage move. The first target area is $0.50 to $0.60, then $1.00, then $1.30, then $1.70, then $2.20, then $3.00. The full structural goal is the $3 region. That is the 9x move. The chart has been building this structure for six years.
Each accumulation zone has led to a breakout. The TRX price is now sitting in the second accumulation zone. The breakout has not happened yet. The expansion is still in the future.
What the TRON daily and 4-hour charts show
The daily chart gives us a closer look. The TRX price closed the latest day at $0.3325, down 0.18% on volume of 38.64 million. The 100 day SMA sits at $0.3001, which means the TRX price is well above its longer-term average. That is a bullish signal.
Daily TRON price chart analysis.
The daily chart shows a break of structure to the upside, with resistance now acting as support. The Fibonacci levels on the daily chart point to $0.3650 at the 0.618 level and $0.3851 at the 0.236 level. The daily RSI is at 72.45, which is overbought. That is a yellow flag. The TRX price has moved hard and fast. A pullback or consolidation would be normal.
The 4-hour chart shows the short-term picture. The TRX price is trading at $0.3324, flat on the session. The 100 period SMA sits at $0.3231, and the TRX price has been holding above that level for several candles.
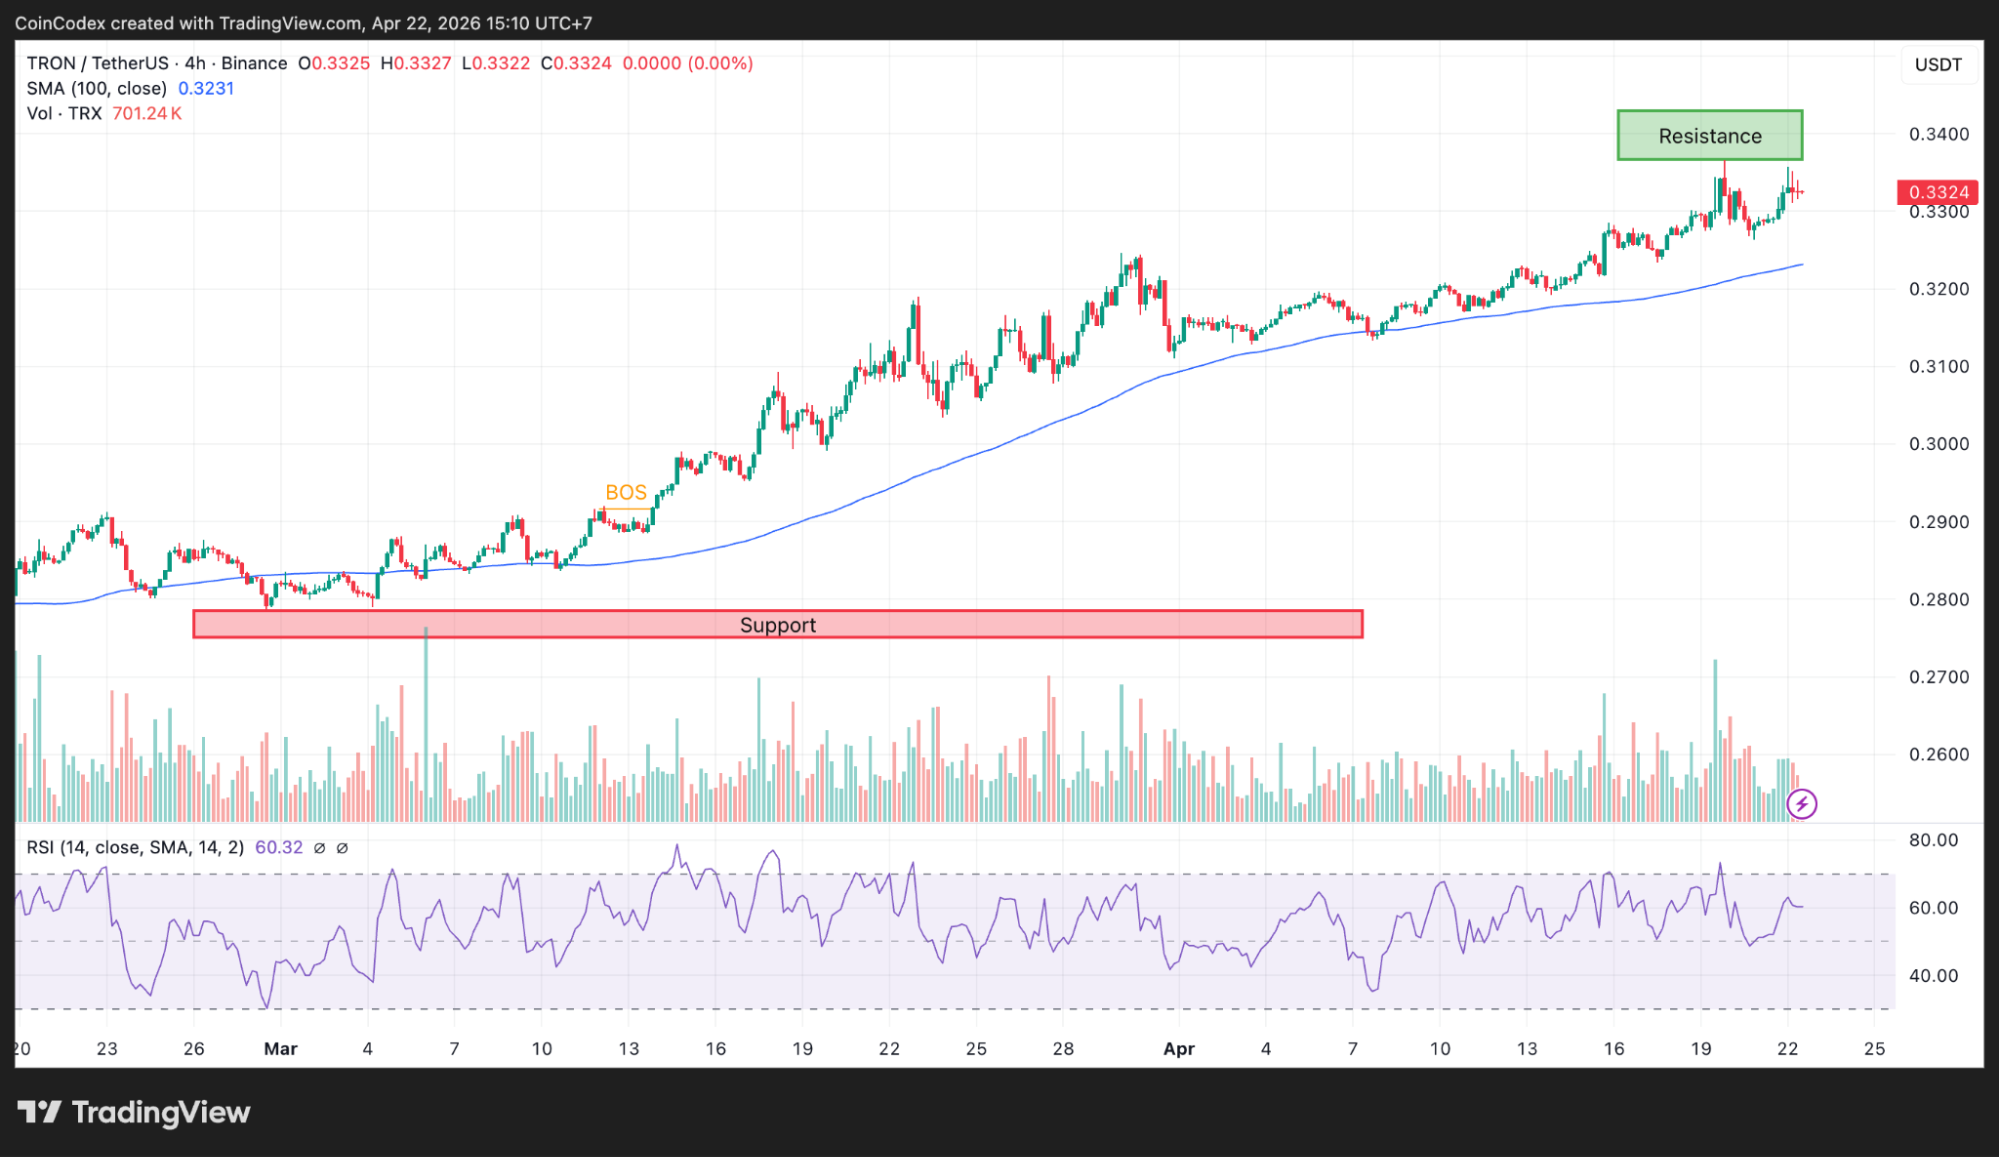
4-hour TRON price chart analysis.
That is a positive short-term sign. The resistance on the 4-hour chart is at $0.34, then $0.35. The support sits at $0.32, then $0.31, then $0.30. The 4-hour RSI is at 60.32, bullish but not overbought. The TRX price has room to run.
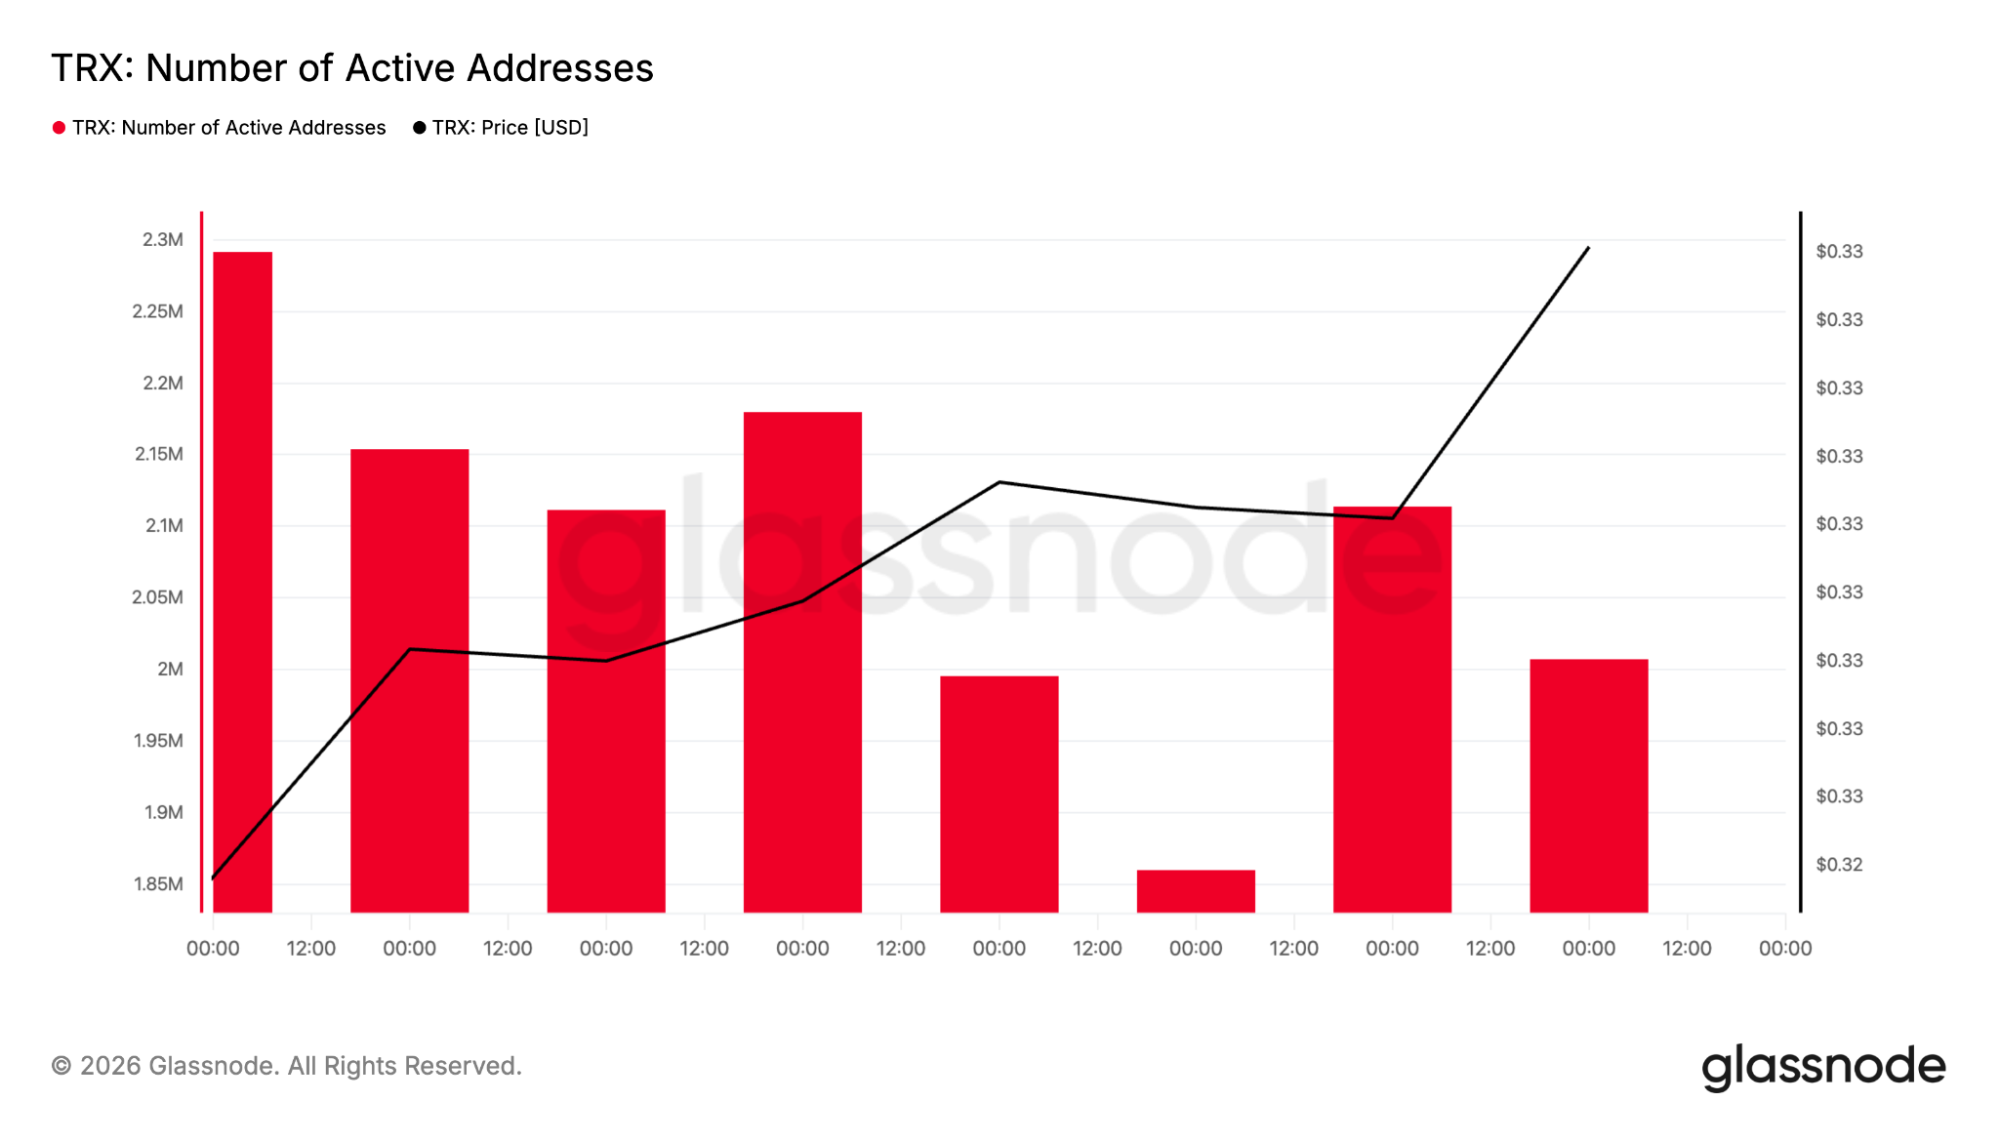
The on-chain data don’t lie – TRON is a sleeping giant
The Glassnode data adds another layer. The number of active addresses on TRON has been steady near 2.0 million to 2.3 million. That is a massive number. Most altcoins dream of 100,000 active addresses. TRON has millions.
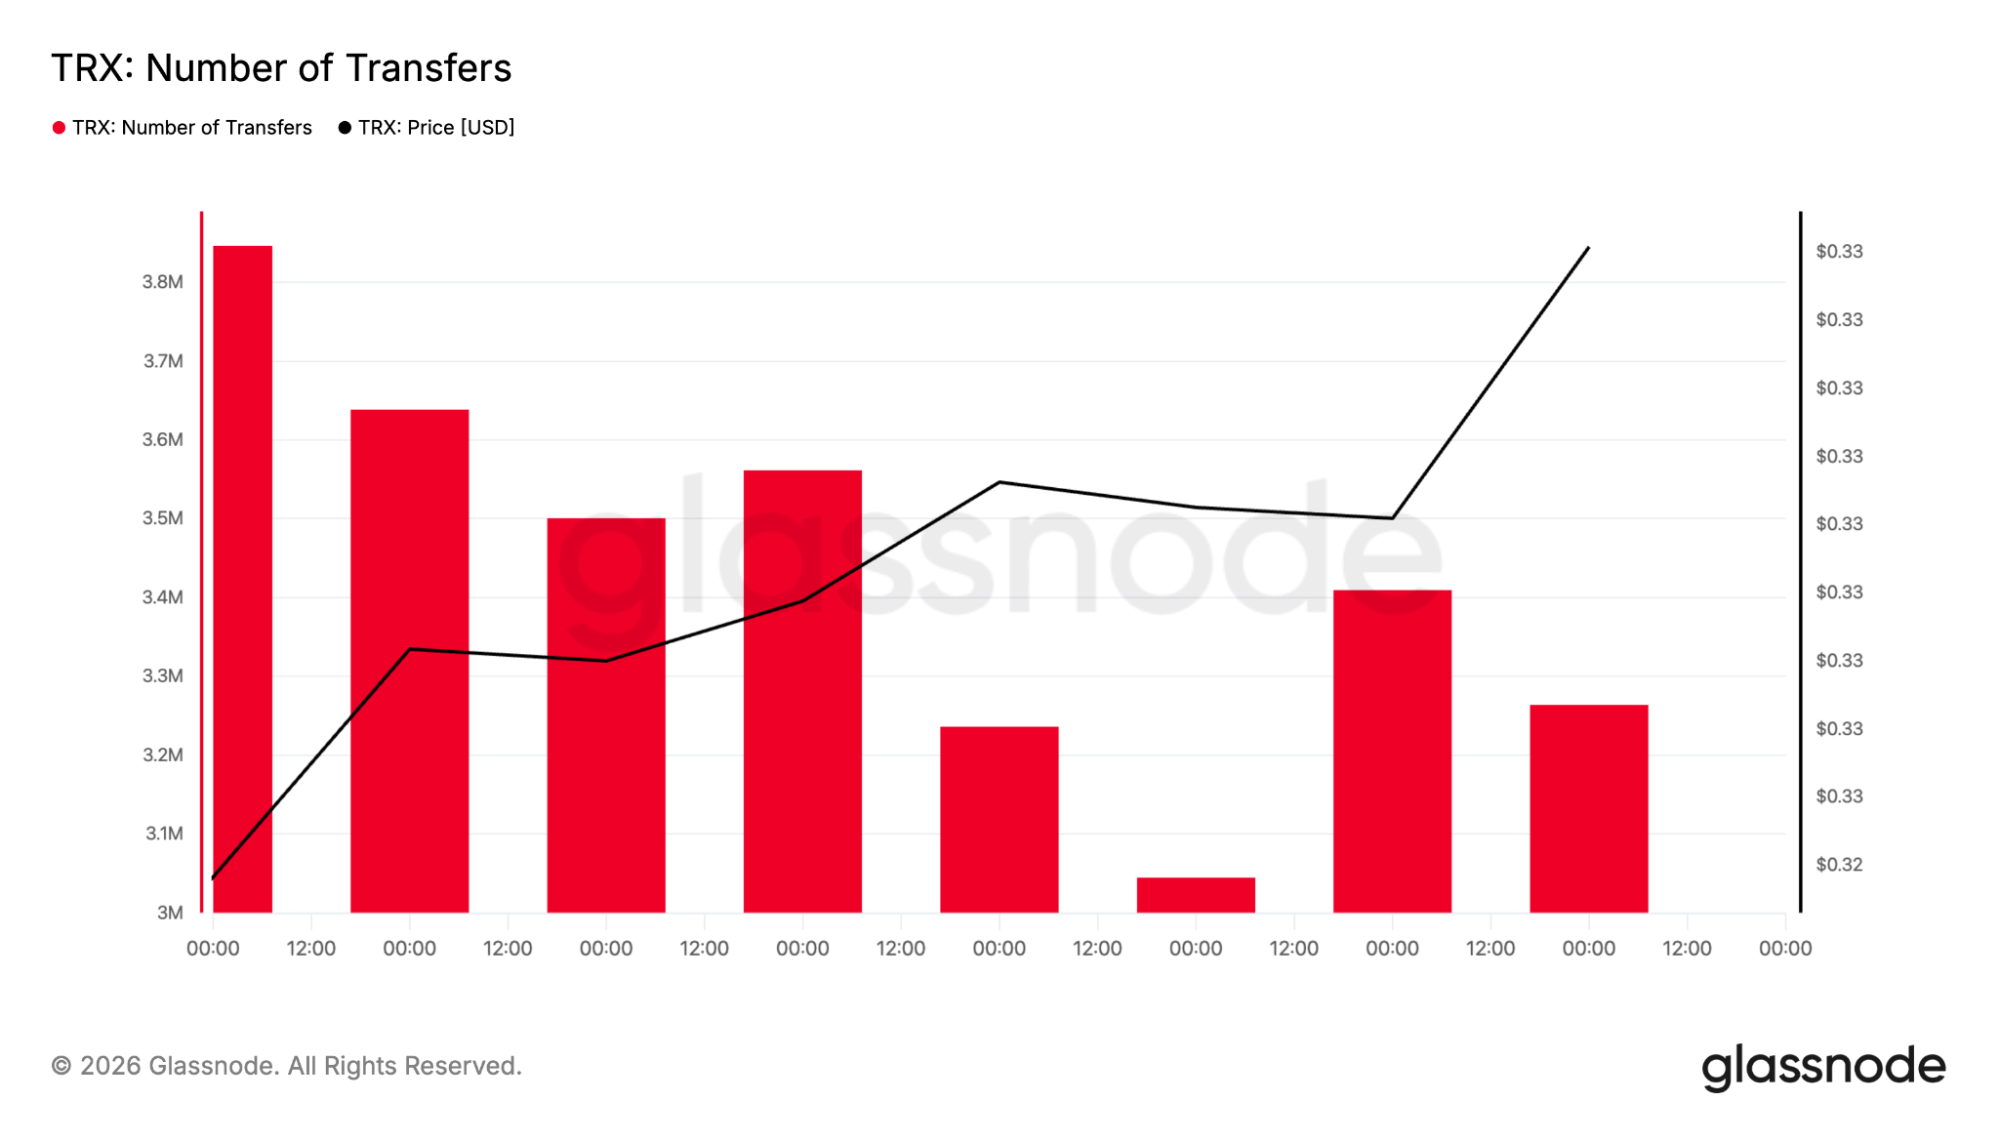
The number of transfers has also been steady, ranging from 3 million to 9 million. The TRX price is moving sideways, but the network activity is not collapsing. It is holding steady at high levels. That is a sign of real usage, not speculation. TRON processes more daily transactions than Ethereum. The network is being used. The TRX price is the only thing that has not caught up to the activity.
The key level that changes everything
The most important level is $0.22. That marks the bottom of the current accumulation zone. If the TRX price breaks below it, the structure weakens, and price could fall back toward the $0.15 to $0.18 area, which was an accumulation zone before.
That would be a 50% drop from current levels. But as long as the TRX price holds above $0.22, the bullish structure remains intact. Crypto Patel says as long as $0.22 holds, the path to $3 remains wide open. That is a 9x move from the accumulation zone. The structure is clean. TRX is the only thing left to decide if the target gets hit.
CoinCodex’s 1-month TRON price prediction places the price at $0.3619, which sits above the current $0.33 level. That forecast sees a grind toward $0.34 to $0.38. Patel sees $3. One is looking at the next month. The other is looking at the next cycle.
Kraken: Best crypto exchange for security & reliability
- Buy, sell, and trade 400+ cryptocurrencies with industry-leading security
- Spot, Futures & Margin trading – leverage up to 5x for advanced traders
- Earn rewards with staking on top cryptocurrencies
- 24/7 customer support and high liquidity for fast trades
- Regulated in the US with strong compliance and security measures
- 13+ million users worldwide
Disclaimer: This content is for informational purposes only and does not constitute financial, investment, or other advice. Nothing on this page is a recommendation or solicitation. Always seek independent professional advice before making investment decisions. Some links may earn us a commission at no extra cost to you.
Source:: TRON Price Prediction: A Clean 6-Year Structure Suggests Long-Term 9x Potential