Key highlights:
- The XMR price is bouncing off a long-term support area that has mattered in previous cycles.
- The heavy selling has started to slow down, and price action is showing signs of stabilizing near the low-$300s.
- On-chain data hint that Monero may already be entering a reset phase, with everything depending on whether this support holds.
Monero hasn’t exactly been the loud trade this cycle. No meme mania, no nonstop headlines, no retail frenzy chasing it around.
The XMR price has mostly been moving in the background, grinding lower through a slow correction as the rest of the market focused elsewhere. And honestly, that’s part of why this moment is important.
When an asset stays quiet for months and then drifts back into a major long-term support zone, it stops being about daily noise and starts becoming about structure.
Monero didn’t collapse overnight – this has been a slow, drawn-out reset
FOUR Crypto Spaces summed it up perfectly: $XMR is reacting off a well-defined higher-timeframe support. In trader terms, this is one of those spots where the market either holds or cracks.
$XMR is reacting off a well-defined higher-timeframe support. pic.twitter.com/Dx8NxIXzwu
— FOUR | Crypto Spaces (@X_Four_iv) February 9, 2026
The daily chart makes the key zone pretty obvious. The XMR price is sitting around $320–$330, right above a broad support band in the high-$200s. And this isn’t some random rectangle drawn on the chart, it’s an area that previously acted as a base before major expansions.
Higher-timeframe support zones matter because they’re where bigger buyers have historically stepped in. If price holds here, it often means supply is getting absorbed. If it breaks, it usually means the market is repricing lower. That’s why FOUR called it “well-defined.” The level is clear and the reaction is everything.
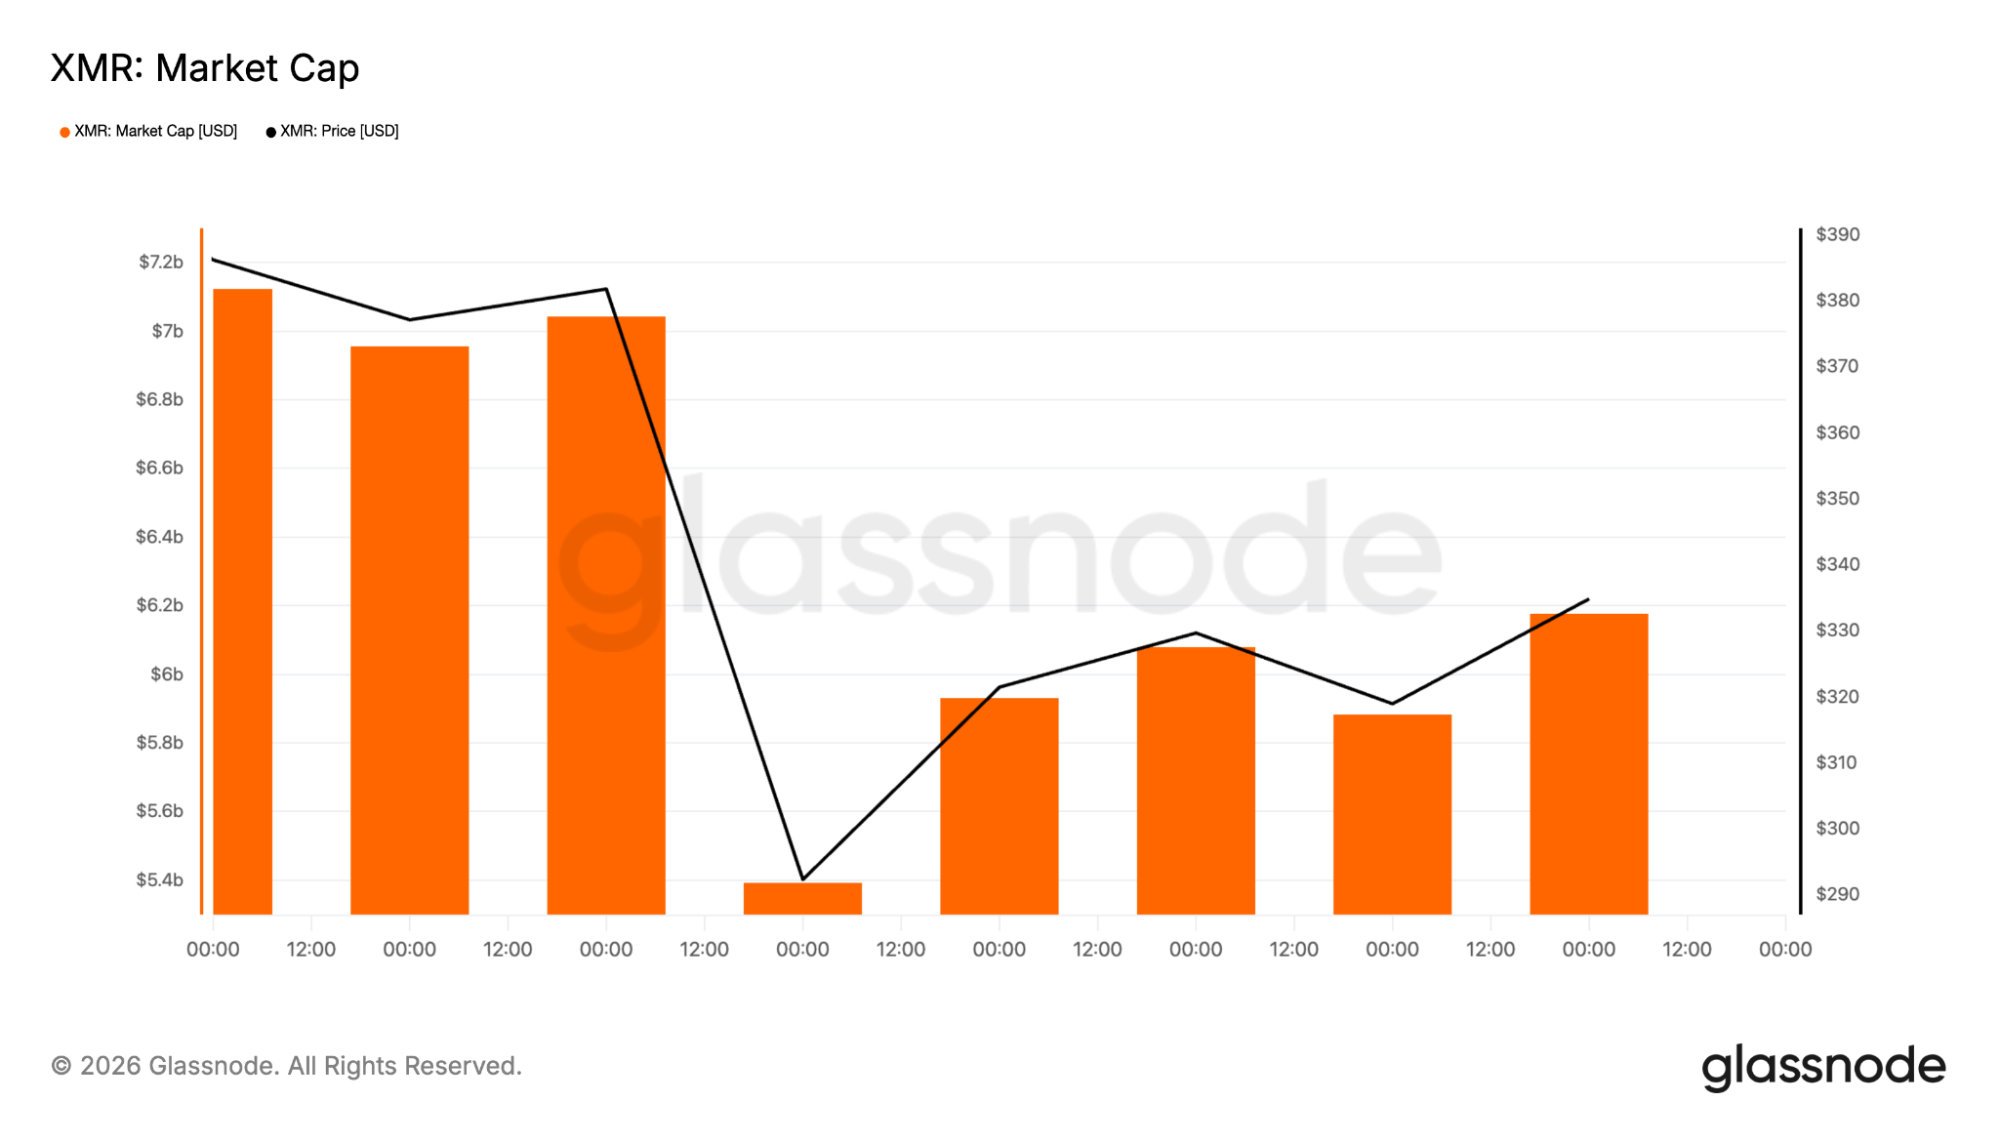
On-chain data shows the reset already played out
Glassnode data adds another layer beyond just price candles. Monero’s valuation dropped hard from above $7B into the mid-$5B range, then stabilized and started ticking upward again. That’s a classic reset pattern.
It tells you the market already went through a repricing phase. Weak positioning got shaken out, but the network didn’t collapse into irrelevance. Market cap holding steady here supports the idea that the XMR price isn’t in freefall anymore; it’s in digestion mode.
The drawdown chart shows Monero sitting roughly -58% to -62% below its all-time high. That’s not a mild pullback, it’s deep cycle territory.
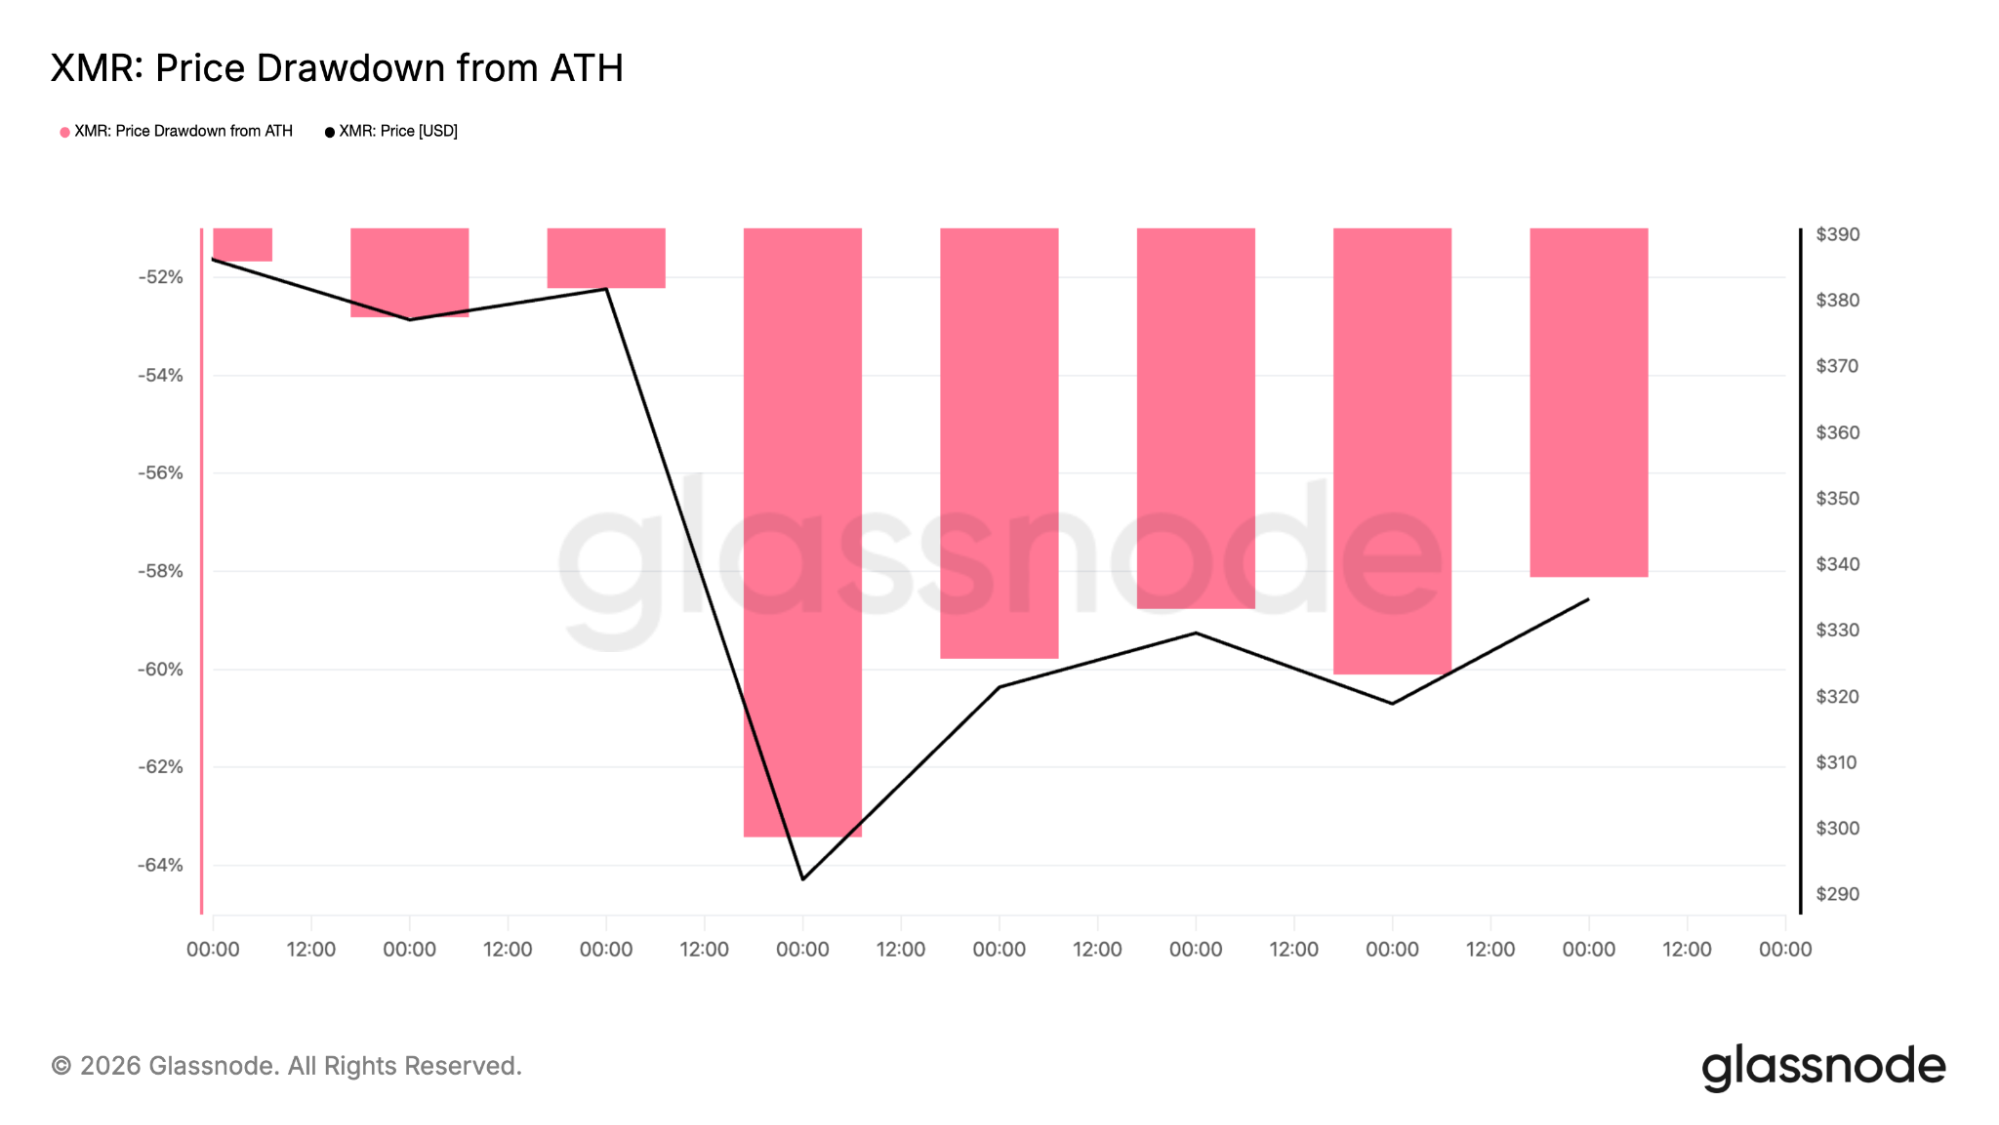
Historically, this is where most people stop paying attention because the asset feels “dead.” But these are also the zones where long-term accumulation often happens. If support holds, then the key isn’t whether Monero looks bullish, but whether the XMR price can stop printing new lows.
XMR daily chart still looks bruised, but the 4-hour chart shows stabilization
On the daily timeframe, the trend is still damaged. Monero hasn’t reclaimed key moving averages, and the structure is still made up of lower highs. But what’s changing is how the price is behaving down here.
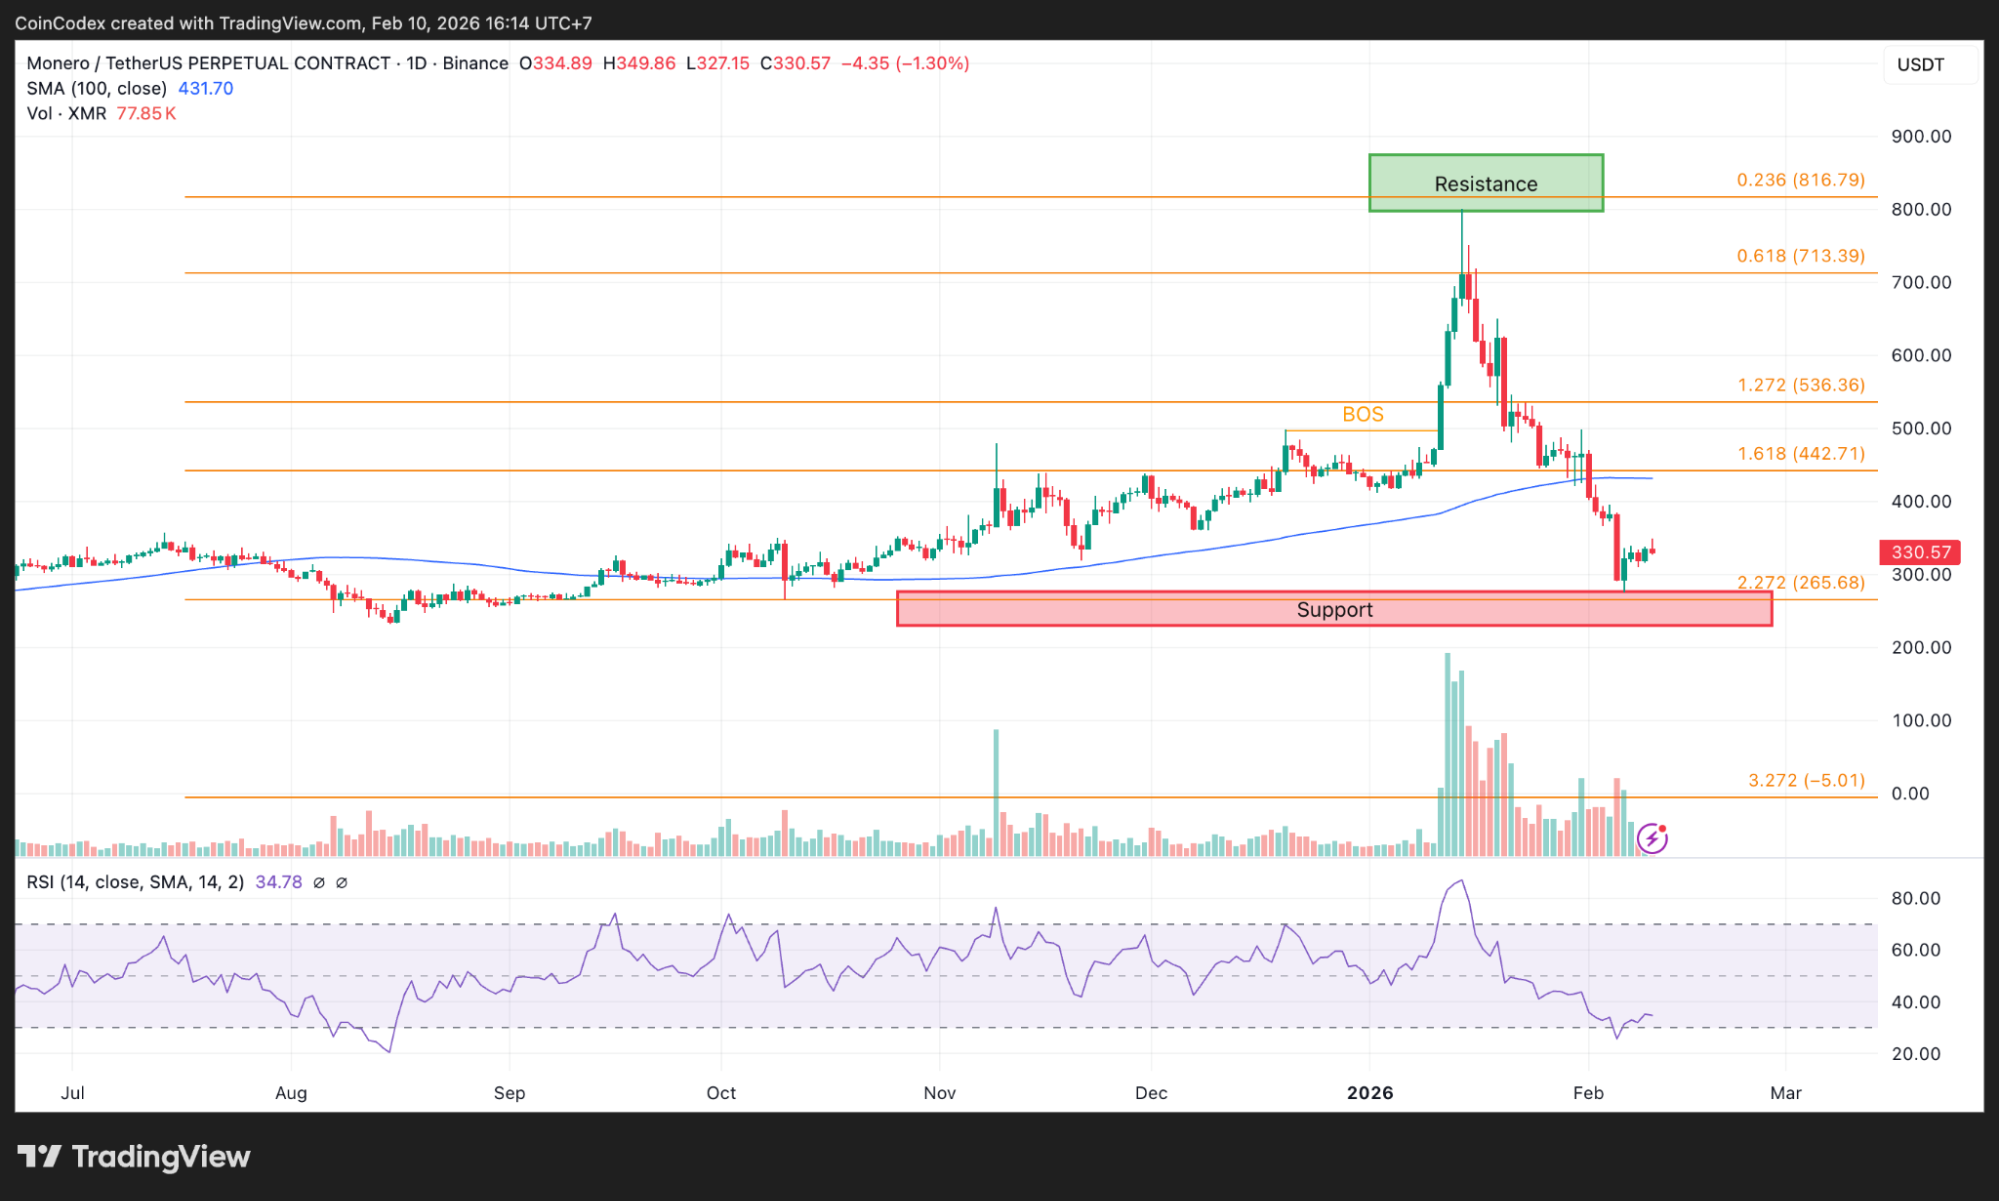
Daily XMR price chart analysis
The XMR price isn’t cascading lower the way it was earlier in the drop. Instead, it’s starting to stall, bounce a bit, and compress around support. That’s usually what happens when sellers start running out of momentum.
Markets don’t flip because everyone suddenly gets bullish. They flip because selling pressure dries up, and price stops falling even when sentiment stays negative. That’s the phase Monero may be entering.
Zooming into the 4-hour chart, the XMR price is clearly trying to stabilize after that flush into support. The bounce back into the low-$330s matters, but it doesn’t automatically mean reversal. This still looks more like early basing than breakout.
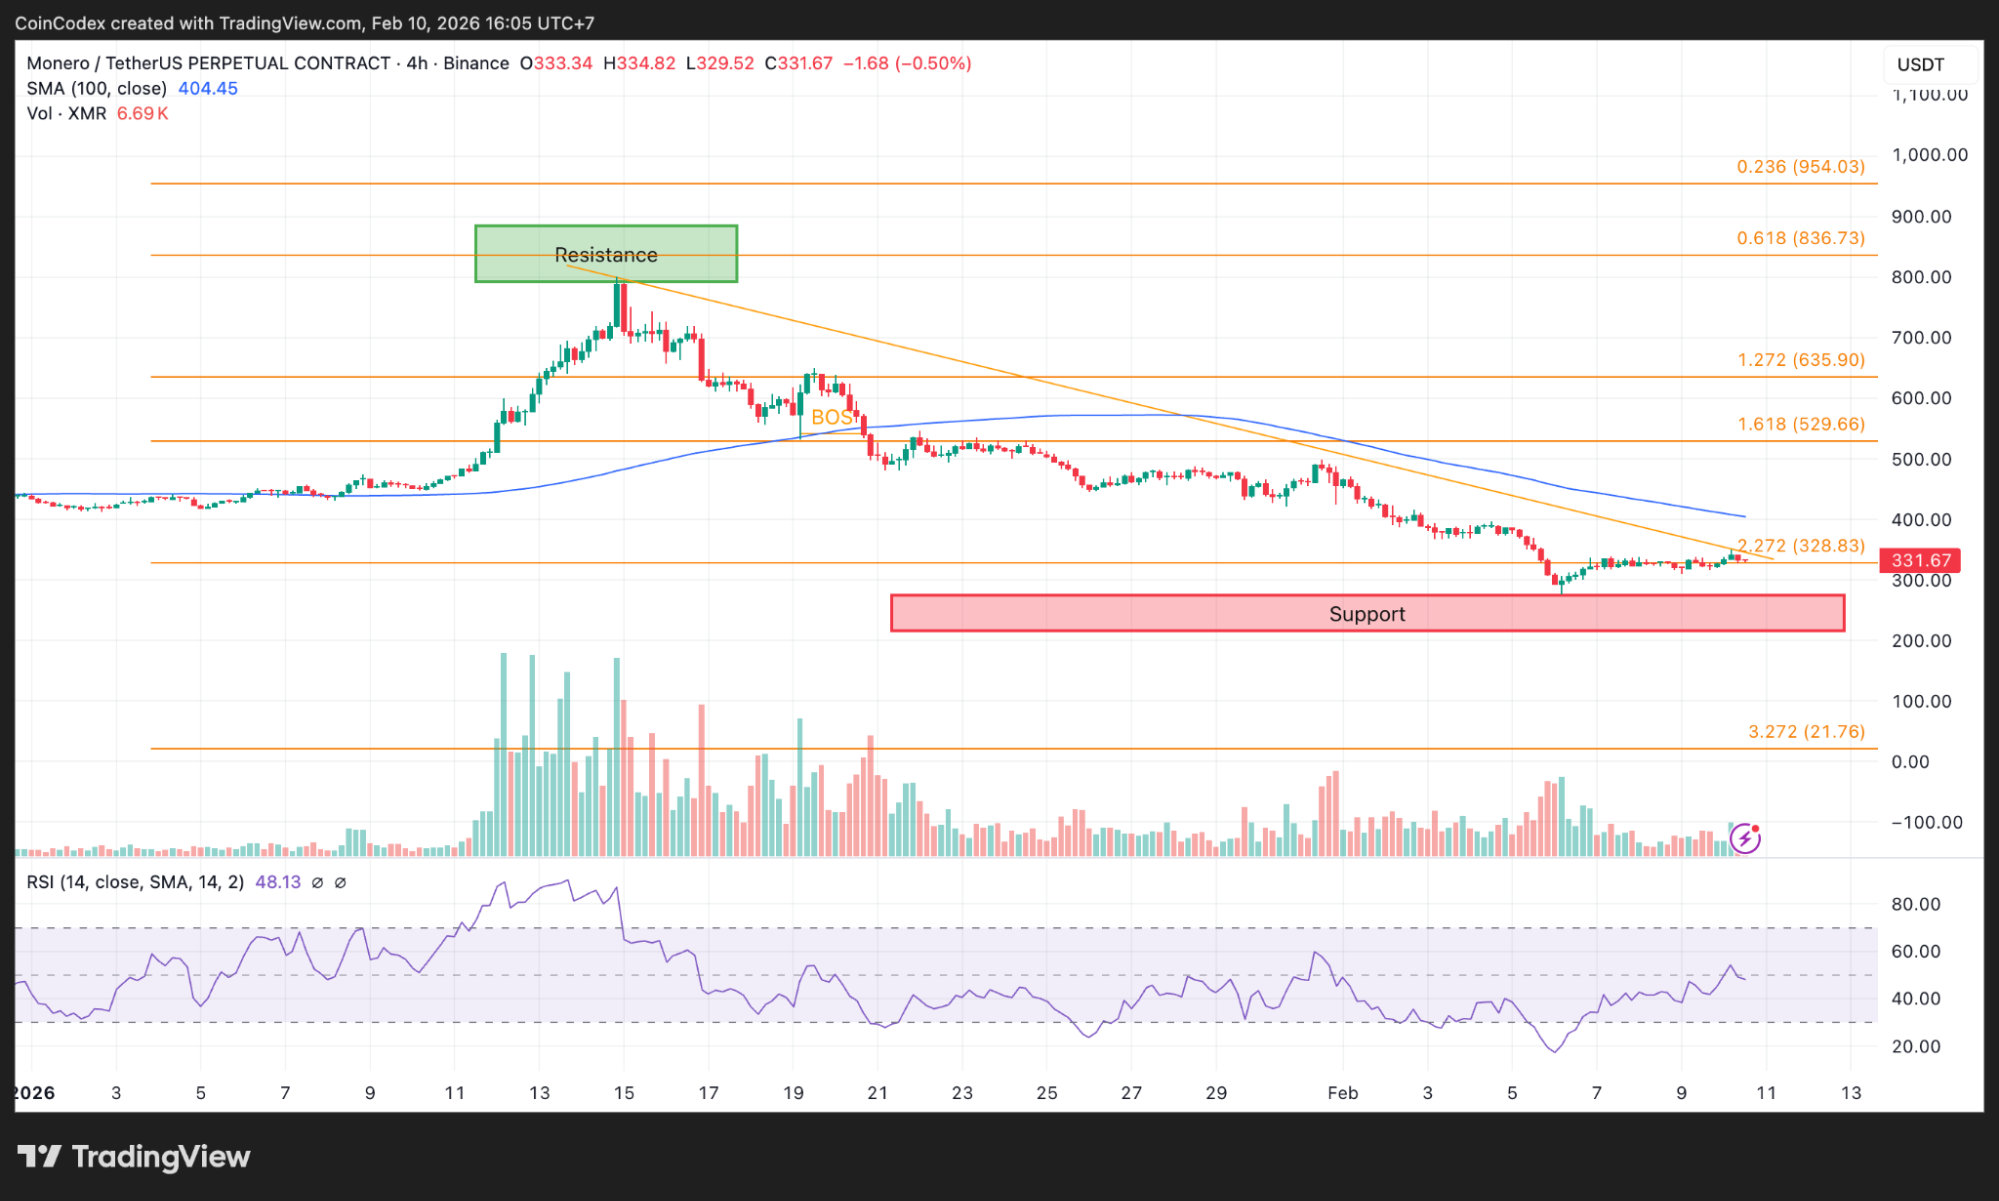
4-hour XMR price chart analysis
And overhead resistance is still heavy: the first real reclaim zone is around $400+, then $442 as a key Fibonacci level, then bigger recovery checkpoints at $529 and $635.
Until Monero starts taking those back, rallies are still vulnerable to getting sold. This is the difference between a bounce and an actual trend change.
What happens next comes down to this support zone
The setup here is pretty simple. If the XMR price holds the high-$200s support band and starts building higher lows, the market opens the door to a recovery grind: Back toward $400, then $442.
Then bigger upside levels if momentum returns but if support fails cleanly, the chart shifts fast. Below this zone, structure gets thinner and downside expands quickly. That’s why this level is a real decision point.
Monero isn’t giving breakout energy right now. The XMR price is still bruised, still below major resistance, and still stuck in recovery mode. But it’s also sitting on one of the clearest higher-timeframe support zones it’s seen in months, and that’s exactly where market narratives change.
According to CoinCodex’s 1-month XMR price prediction, Monero could move toward $372.90 in the near term. That would push Monero back into the upper part of its current range, which would be a meaningful recovery move, even if it still wouldn’t count as a full breakout yet.
Kraken: Best crypto exchange for security & reliability
- Buy, sell, and trade 400+ cryptocurrencies with industry-leading security
- Spot, Futures & Margin trading – leverage up to 5x for advanced traders
- Earn rewards with staking on top cryptocurrencies
- 24/7 customer support and high liquidity for fast trades
- Regulated in the US with strong compliance and security measures
- 13+ million users worldwide
Disclaimer: This content is for informational purposes only and does not constitute financial, investment, or other advice. Nothing on this page is a recommendation or solicitation. Always seek independent professional advice before making investment decisions. Some links may earn us a commission at no extra cost to you.
Source:: Monero (XMR) Price Prediction: Here's Why This Support Level Could Decide the Next Move