Key highlights:
- The XRP price movement has been ranging, mirroring the calm market action that often precedes significant price movements.
- On-chain data indicates that market participants are not leaving the market but rather just losing some excitement, which always calls for attention.
- The $2.10 level remains the boundary level; only a breakout can change the scene.
Right now, XRP feels painfully quiet. The price is drifting sideways, candles overlap endlessly, and every small bounce seems to stall before it goes anywhere. There’s no momentum to chase and no clear trend to lean into.
For most people, this is usually the point where interest fades and attention moves elsewhere. But for XRP, this phase is nothing new.
Steph Is Crypto put it simply: slow grind, overlapping candles, and the XRP price doing nothing long enough for conviction to disappear. It doesn’t look exciting, and that’s the point. Historically, this is often what XRP looks like right before something changes.
Why XRP often looks weak before it moves
One of XRP’s most frustrating traits is also one of its most consistent. It rarely gives clear early signals. Instead, it moves sideways until most traders lose interest, then accelerates once conditions align.
Sideways markets drain patience. Traders get chopped up, narratives fade, and confidence erodes. By the time the structure finally breaks, positioning is usually light, which allows the XRP price to move faster than expected.
The current $XRP structure is nearly identical to previous pre-breakout phases:
a slow grind, overlapping candles, and price going nowhere long enough for conviction to fade.
Nothing about this looks exciting.
And that’s usually what XRP looks like right before it moves. pic.twitter.com/yo1PefhWPA
— STEPH IS CRYPTO (@Steph_iscrypto) December 29, 2025
Right now, nothing about XRP looks exciting. That’s exactly the point Steph Is Crypto was making. And historically, that lack of excitement has often shown up before strong moves, not after them.
On-chain data tells a different story than price
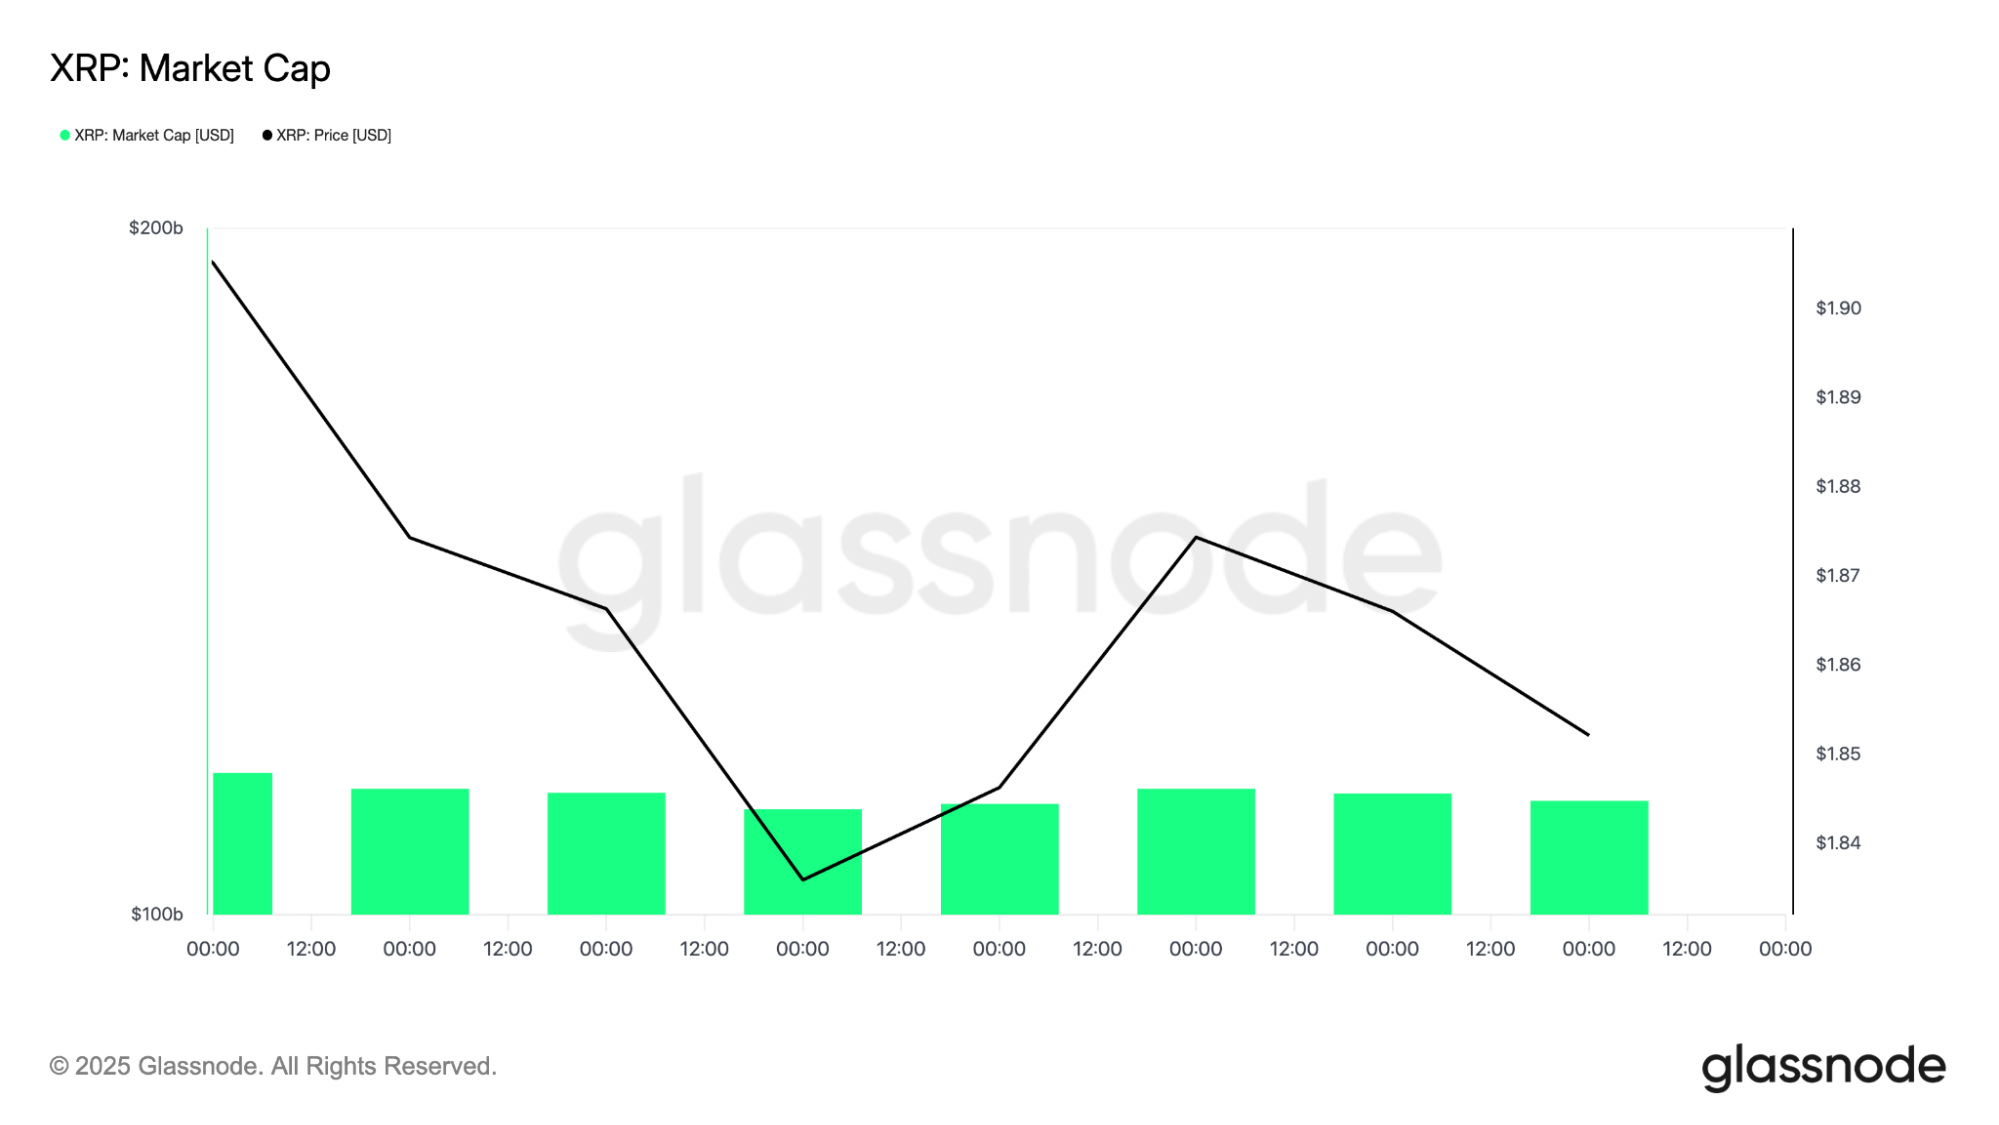
While the price action looks dull, on-chain data adds useful context. XRP’s market cap has remained relatively steady even as price drifts lower. That matters, because it indicates capital isn’t rushing for the exits. Instead, valuation is holding up while price consolidates, which often points to redistribution rather than panic selling.
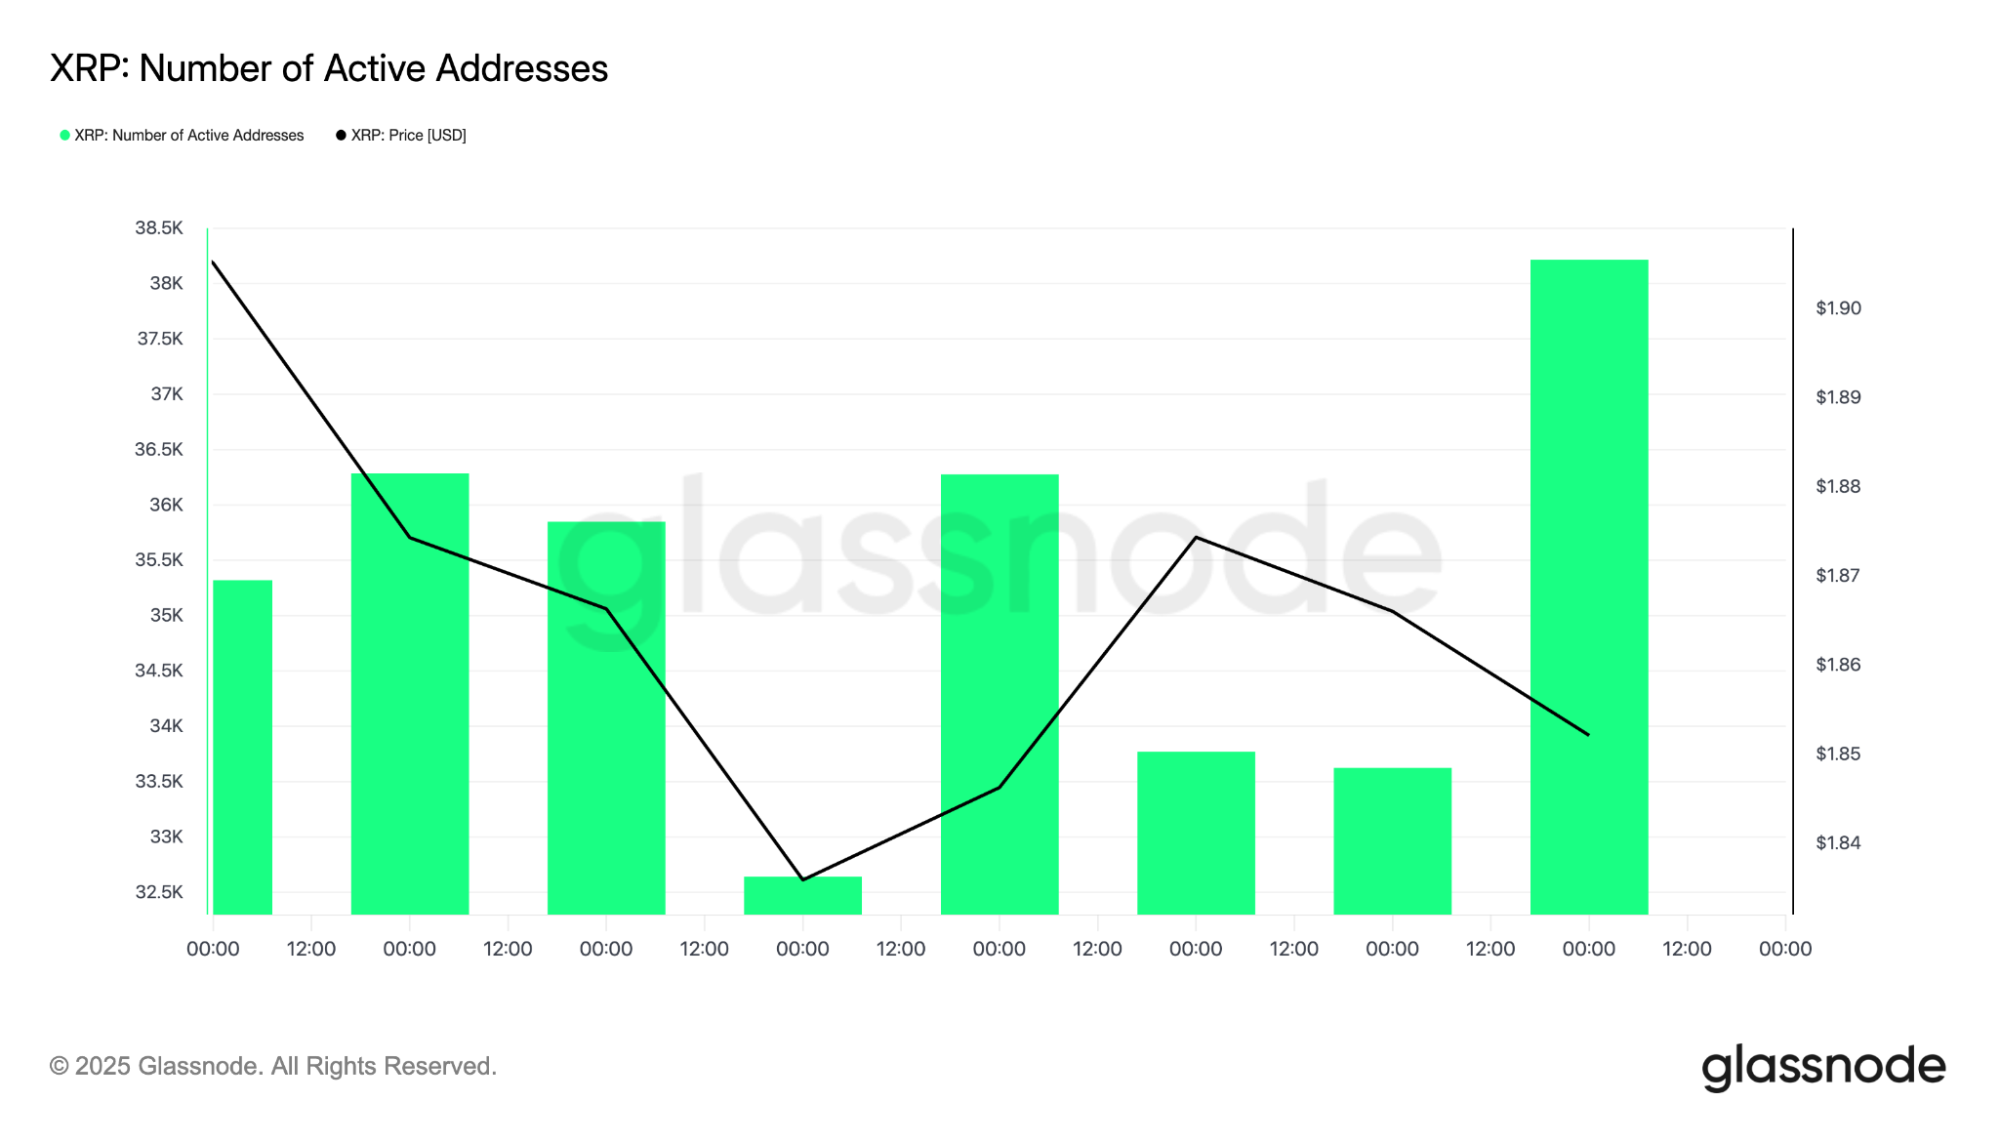
Active address data supports that idea. Even during recent pullbacks, the number of active XRP addresses hasn’t collapsed. In fact, activity has increased during certain dips, implying ongoing network usage rather than pure speculation. That’s important for a network designed around payments and settlement.
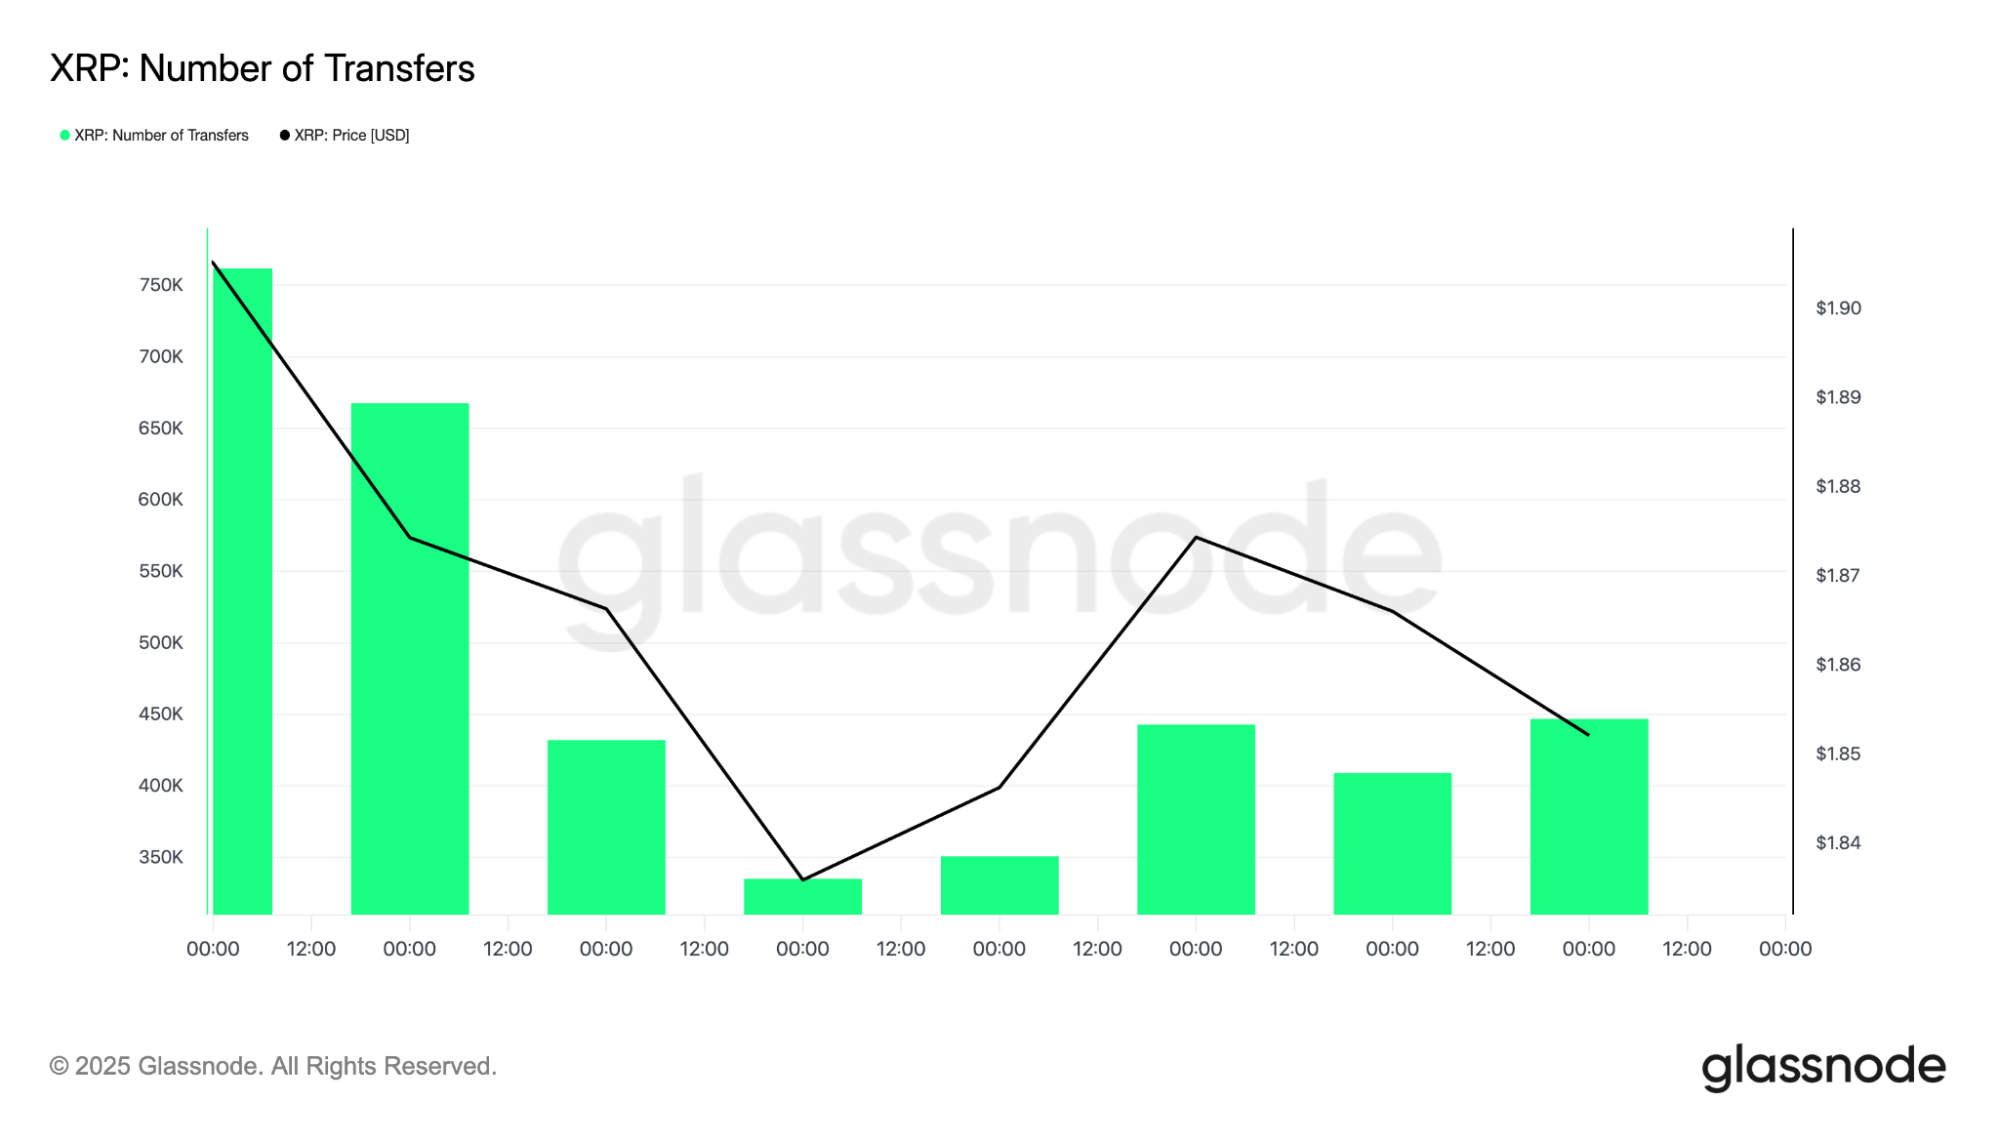
Transfer volume tells a similar story. While it isn’t exploding higher, it remains consistent. XRP continues to be used as infrastructure even when price excitement fades. Historically, that kind of behavior tends to show up during accumulation phases, not distribution.
The XRP price isn’t going anywhere, but structure is forming
On lower timeframes, XRP is clearly boxed in. The 4-hour chart shows the price compressing between a downward-sloping resistance line and a wide support zone that keeps getting defended.
Every push higher runs into sellers, while dips continue to find buyers before things turn ugly. This isn’t a trending price action. It’s controlled and deliberate.
The downside level that matters sits around the $1.60–$1.65 area. That zone has been tested multiple times and continues to hold. As long as the price stays above it, downside risk looks contained.
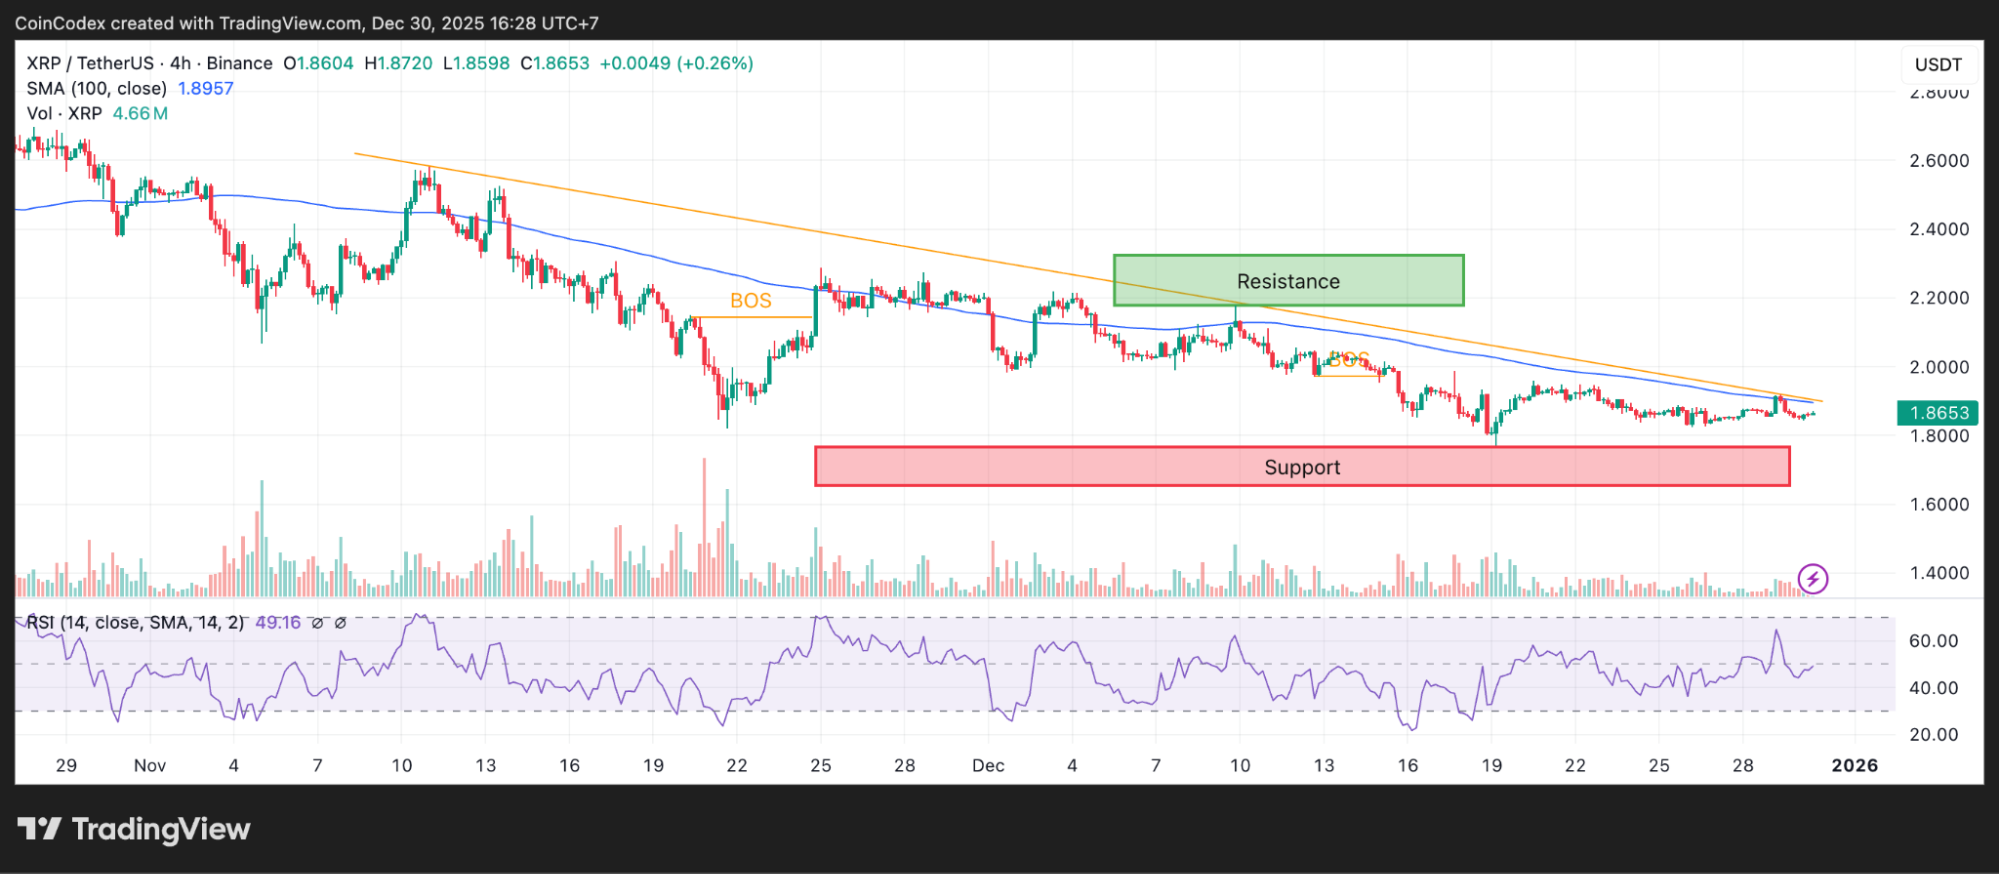
4-Hour XRP price chart analysis.
On the upside, the $2.00–$2.10 region keeps rejecting price, reinforcing the idea that the XRP price is coiling rather than breaking. This kind of range can feel frustrating, but it’s also where markets quietly reset. Weak hands exit, leverage gets shaken out, and directional bets cool off. What’s left is often a cleaner setup.
Zooming out makes the current structure look far less random. On the daily and multi-month charts, XRP’s behavior closely resembles earlier pre-breakout phases, including periods seen in 2016 and again in 2024.
In those cycles, the price spent weeks moving sideways or drifting lower. Momentum indicators flattened, volatility dried up, and trading activity lost all excitement. Then, once conviction was at its weakest, structure shifted quickly.
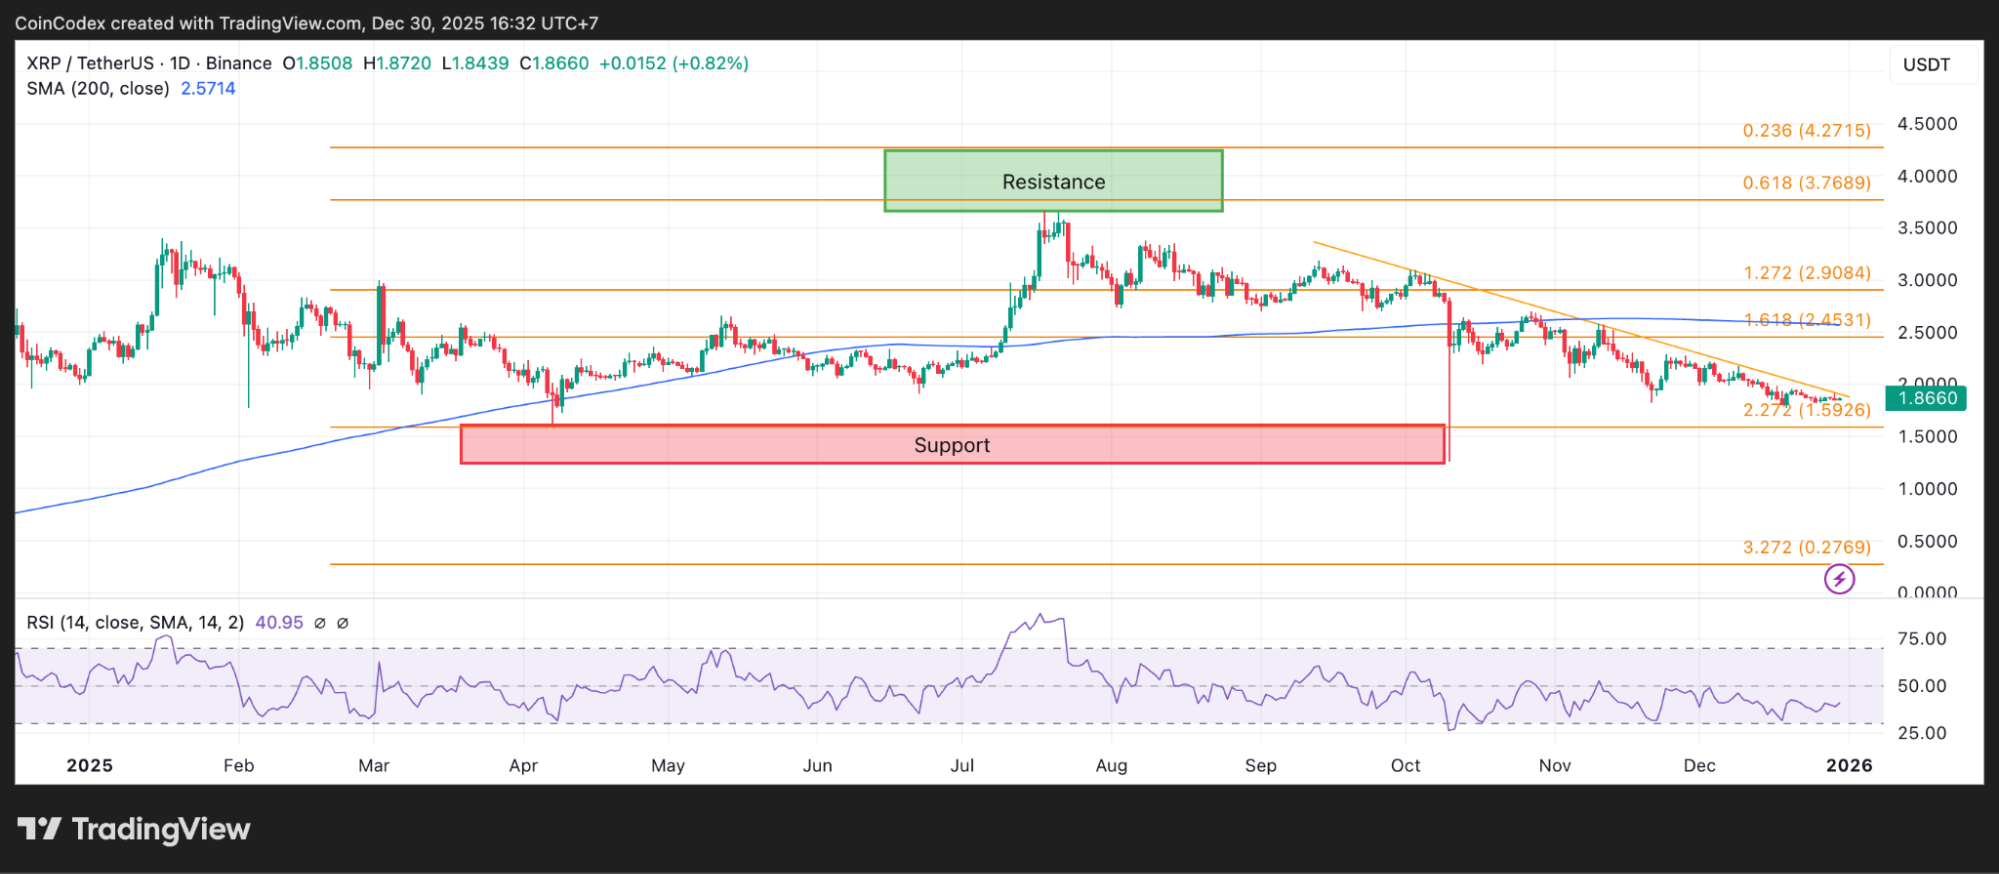
Daily XRP price chart analysis.
The current chart shows many of those same traits. XRP has already pulled back from recent highs, respected long-term moving averages, and settled into a range that doesn’t invite aggressive selling. That doesn’t guarantee a breakout, but it does indicate the market is building rather than falling apart.
XRP key levels are holding as conviction continues to fade
From a technical perspective, the levels are clear. Resistance remains in the $2.00–$2.10 area, where multiple rallies have failed.
A clean break and hold above that zone would shift the short-term picture and likely bring momentum back into the market. Until that happens, the upside remains capped.
Support sits between $1.60 and $1.65. As long as that area holds, downside scenarios stay limited. A decisive break below it would challenge the consolidation thesis and indicate XRP needs more time to rebuild.
For now, the XRP price is stuck between these two boundaries, compressing volatility and forcing patience.
One of the most telling aspects of this phase is the lack of conviction on either side. Bulls aren’t confident enough to push the price higher, and bears aren’t confident enough to force a breakdown. That stalemate often shows up late in consolidation phases.
Historically, the XRP price has tended to move once conviction fades, not when it’s strong. By the time sentiment turns bullish again, a large part of the move is often already underway.
That doesn’t mean a breakout is guaranteed, but it does explain why this setup feels uncomfortable. Markets rarely feel obvious right before they change.
What’s next for XRP?
For XRP, confirmation doesn’t come from hype or headlines. It comes from structure. A sustained move above $2.10 with expanding volume would mark a meaningful shift and put higher levels back into focus.
According to CoinCodex’s 3-month XRP price prediction, XRP could trade around $2.15, but the chart still matters more. A real shift only comes with a strong move above $2.10 on solid volume.
Until then, patience matters more than prediction. The XRP price is still in the phase where it tests conviction, not rewards it.
XRP isn’t doing anything dramatic right now. The price is grinding, volatility is low, and excitement is absent. For short-term traders, that’s frustrating. For longer-term observers, it’s familiar.
The current structure closely mirrors past pre-breakout phases, supported by steady on-chain activity and controlled downside risk. Nothing about this setup feels urgent, and that’s exactly why it stands out.
XRP has a habit of moving when most people stop paying attention. And right now, it feels like many already have.
Kraken: Best crypto exchange for security & reliability
- Buy, sell, and trade 400+ cryptocurrencies with industry-leading security
- Spot, Futures & Margin trading – leverage up to 5x for advanced traders
- Earn rewards with staking on top cryptocurrencies
- 24/7 customer support and high liquidity for fast trades
- Regulated in the US with strong compliance and security measures
- 13+ million users worldwide
Disclaimer: This content is for informational purposes only and does not constitute financial, investment, or other advice. Nothing on this page is a recommendation or solicitation. Always seek independent professional advice before making investment decisions. Some links may earn us a commission at no extra cost to you.
Source:: XRP Price Analysis: Is XRP About to Repeat a Familiar Market Pattern?