Key highlights:
- TRON is one of the few major coins showing real strength while most of the market is stuck moving sideways.
- On-chain data backs that up, with TRON maintaining strong usage and steady transaction activity.
- From a technical point of view, the chart indicates the TRX price could push higher if key support continues to hold.
Right now, the crypto market feels a bit stuck. Bitcoin is moving sideways, most large caps look heavy, and there’s not much excitement across the board. That’s exactly why what TRON is doing with the TRX price is starting to stand out.
While many majors can’t seem to find momentum, TRX has been slowly pushing higher, recently working its way toward the $0.31 zone. It’s not a flashy move and it’s not grabbing headlines, but in this kind of market, that’s usually a good sign.
As Emin pointed out, when a coin starts outperforming in a weak environment, it’s rarely random. It usually means positioning is changing. And when you look closer at both the chart and the on-chain data, it starts to feel like the market is quietly reassessing TRON.
TRX moving like this in a weak market is not something I ignore.
When most majors are stuck drifting sideways and Bitcoin can’t find momentum, $TRX pushing higher tells a very different story.
Over the last day, TRX climbed toward the 0.31 zone while the rest of the top caps… pic.twitter.com/ntIqyZDrvw
— Emin (@Eminweb3) January 25, 2026
TRX holds its ground while others drift
Looking at the TRON chart, one thing becomes clear pretty quickly: TRX is not behaving like a weak coin.
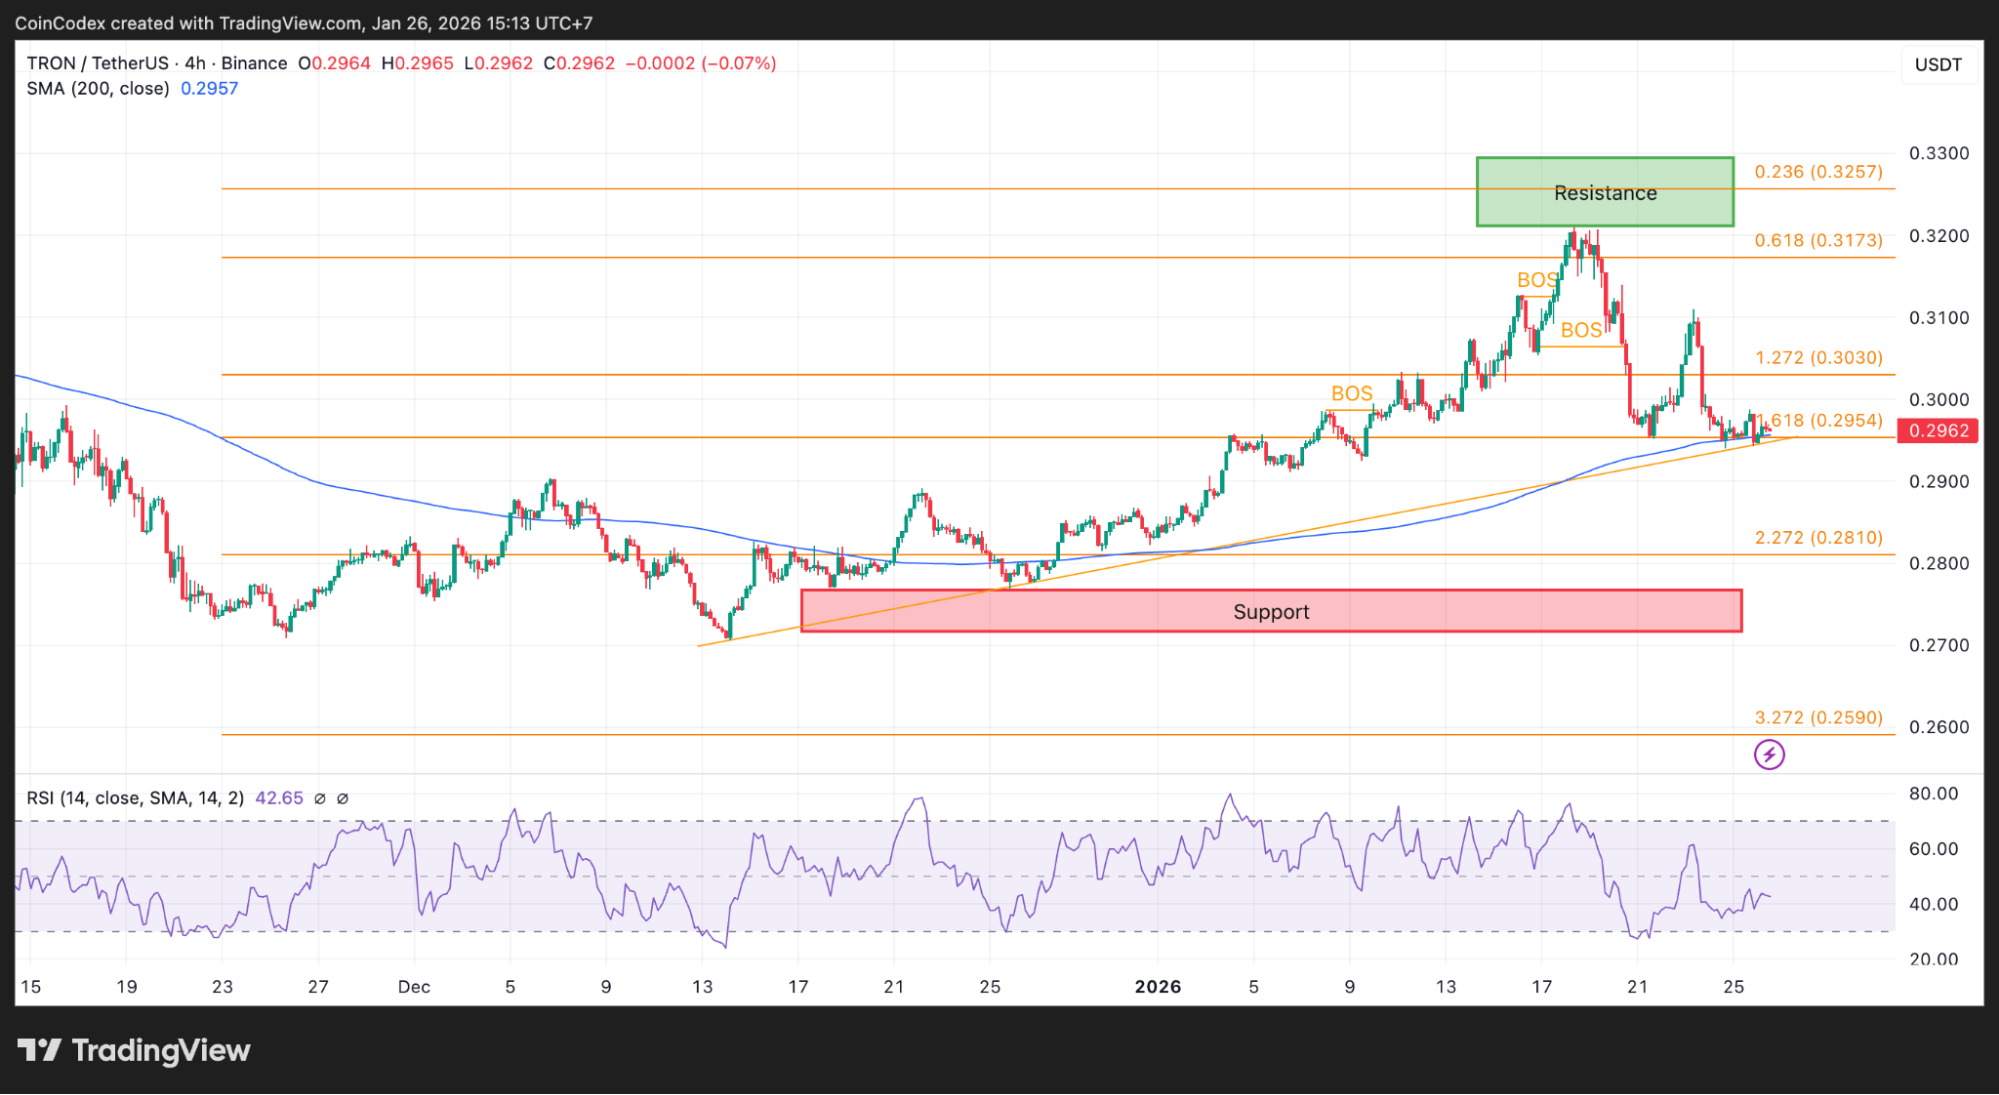
On the 4-hour chart, the TRX price has been holding just under $0.31 after briefly testing that level. That area has become short-term resistance, but what matters more is what’s happening underneath. Instead of collapsing after its pullback, the TRX price has been finding support around the price range of $0.295–$0.300.
4-hour TRX price chart analysis
The level now aligns with the rising trendline and the 200-period moving average. This makes it a significant level from a technical perspective. As long as the price remains above it, the setup does not appear fragile.
Zooming out on the chart, we can see that the bigger trend still remains bullish. We can observe that the support zone around $0.27-$0.28 has not yet been breached, and we can still see the formation of higher lows. Even though TRX failed to break through the $0.325 resistance earlier, it hasn’t damaged the broader setup. It looks more like a pause than a trend reversal.
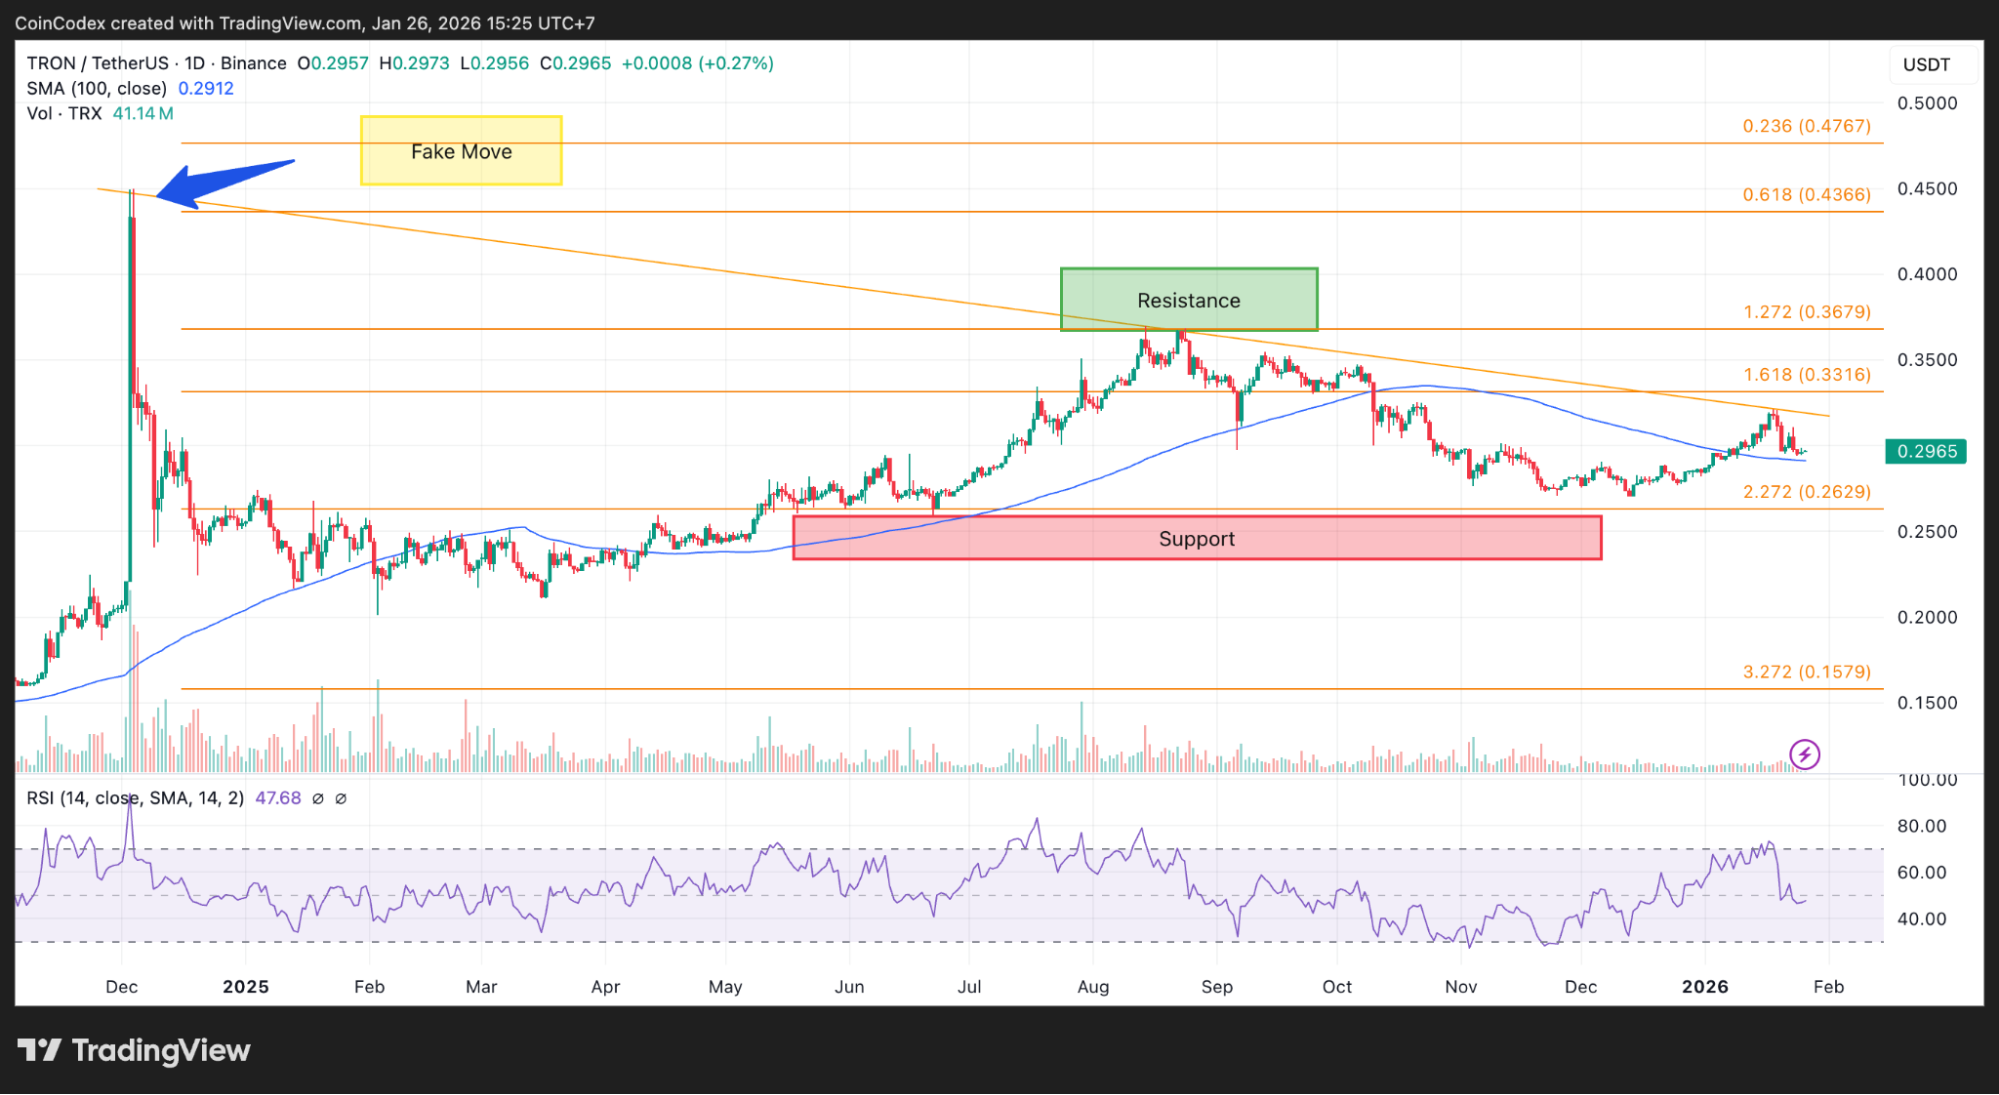
Daily TRX price chart analysis
Momentum indicators support that idea. The daily RSI is currently in a neutral zone, which is a normal condition in a consolidation period in an ongoing uptrend. In shorter-term charts, we see a curl in MACD, which means buyers are entering once again.
TRON’s network activity tells its own story
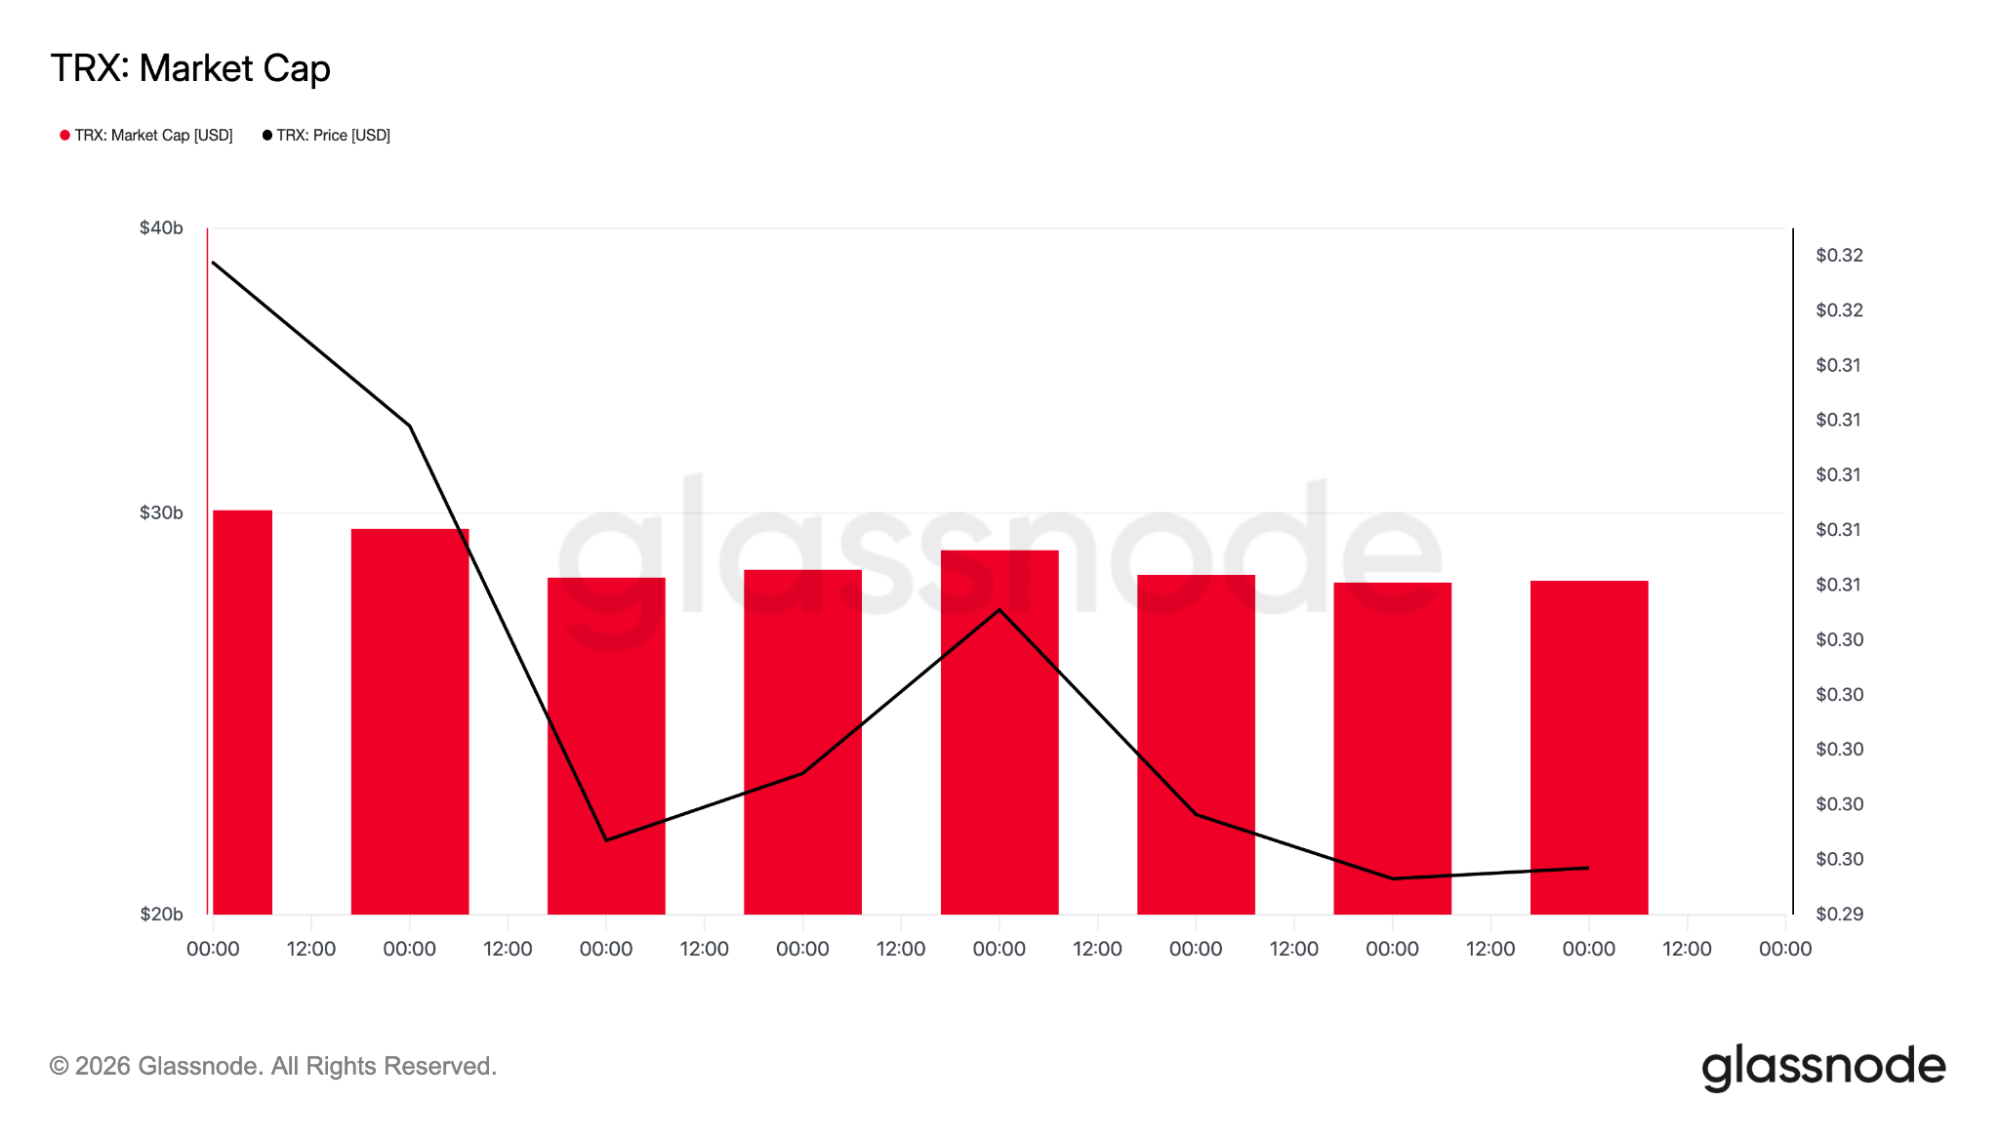
The TRX price alone doesn’t tell the full story, especially with TRON. What really strengthens the current setup is what’s happening on-chain, and Glassnode’s data helps make that clear.
TRON’s market cap has stayed fairly stable around the $27 to $28 billion area even while the price consolidates. That kind of stability usually indicates that larger holders aren’t rushing to sell.
More importantly, the network is still busy. The number of active addresses remains above 3 million, which is impressive, especially during quieter market conditions. That means people are still using the network, not just speculating on the token.
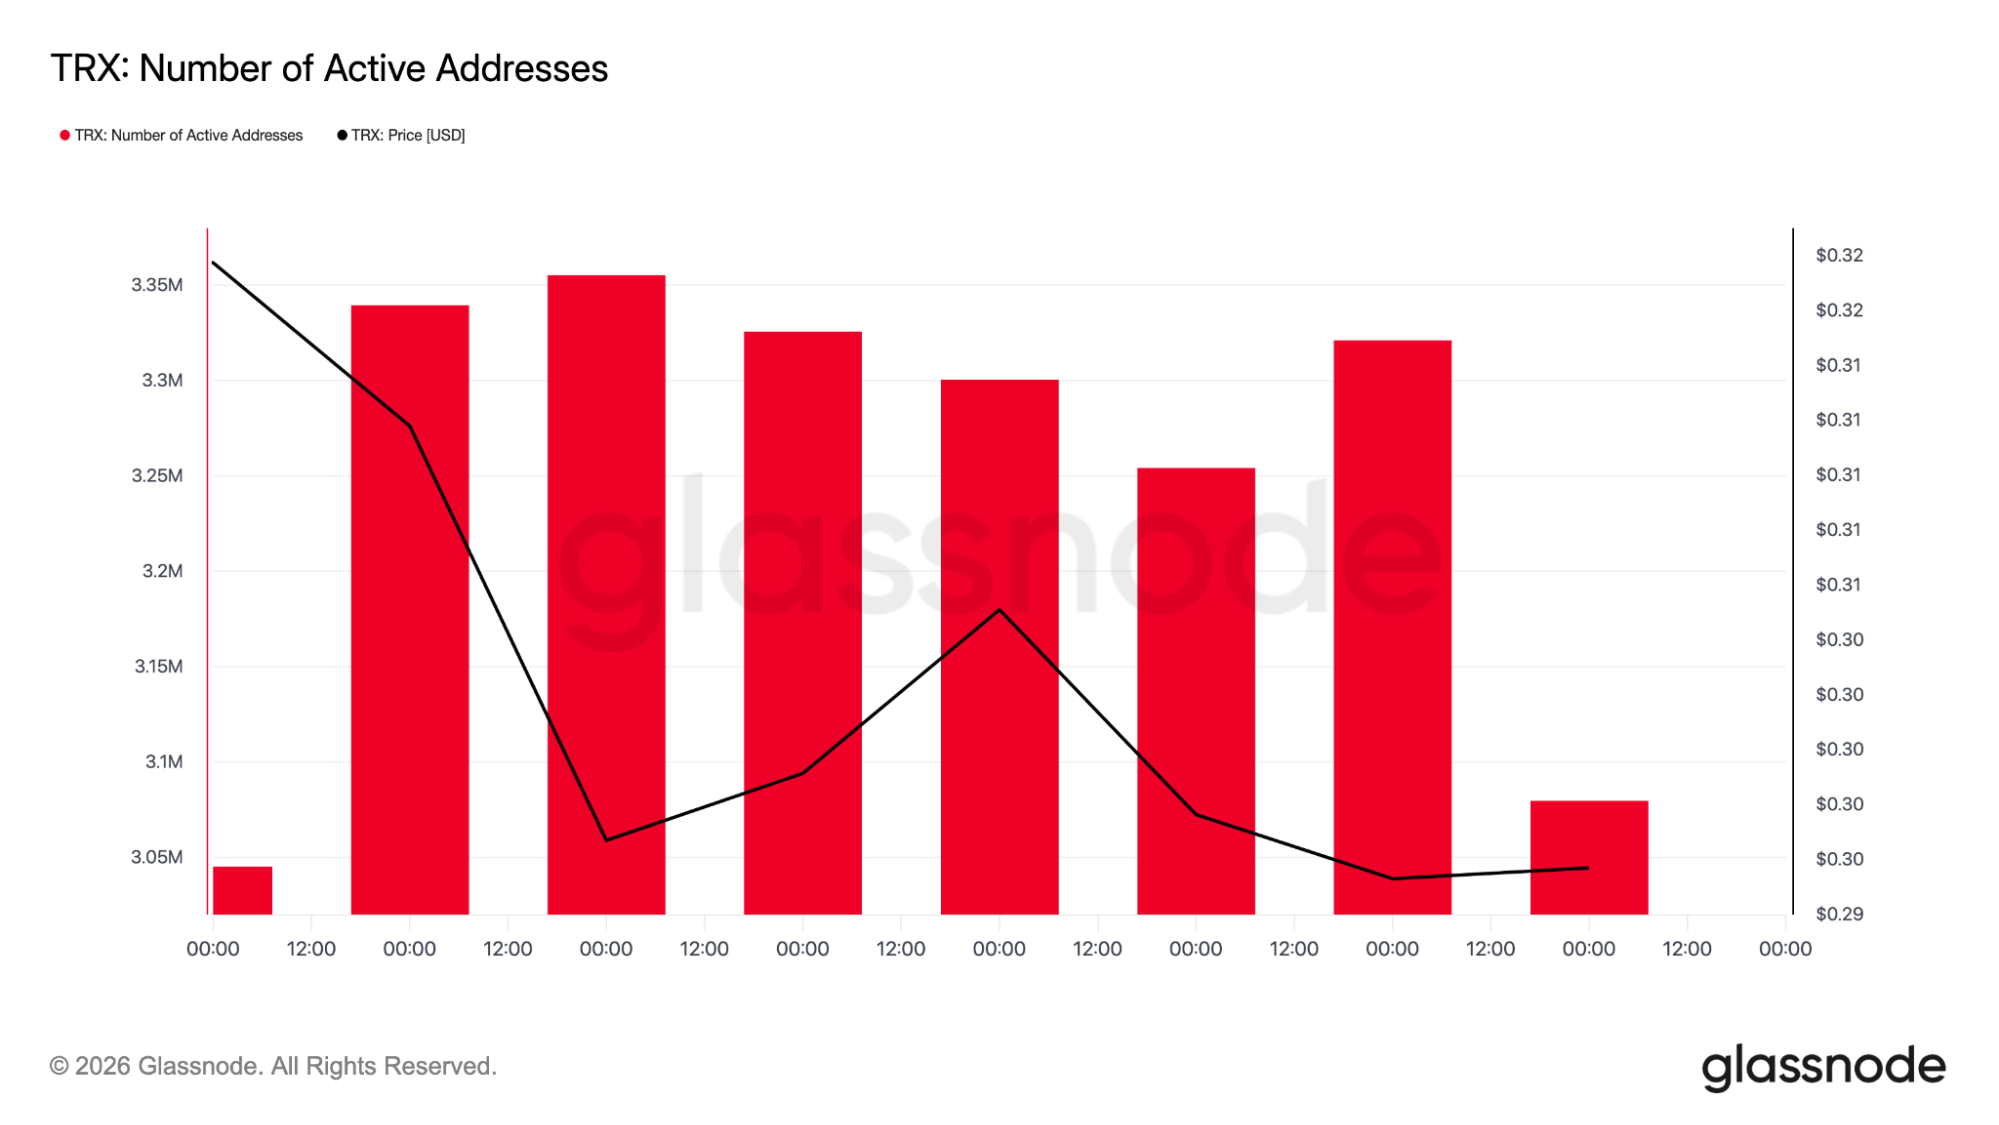
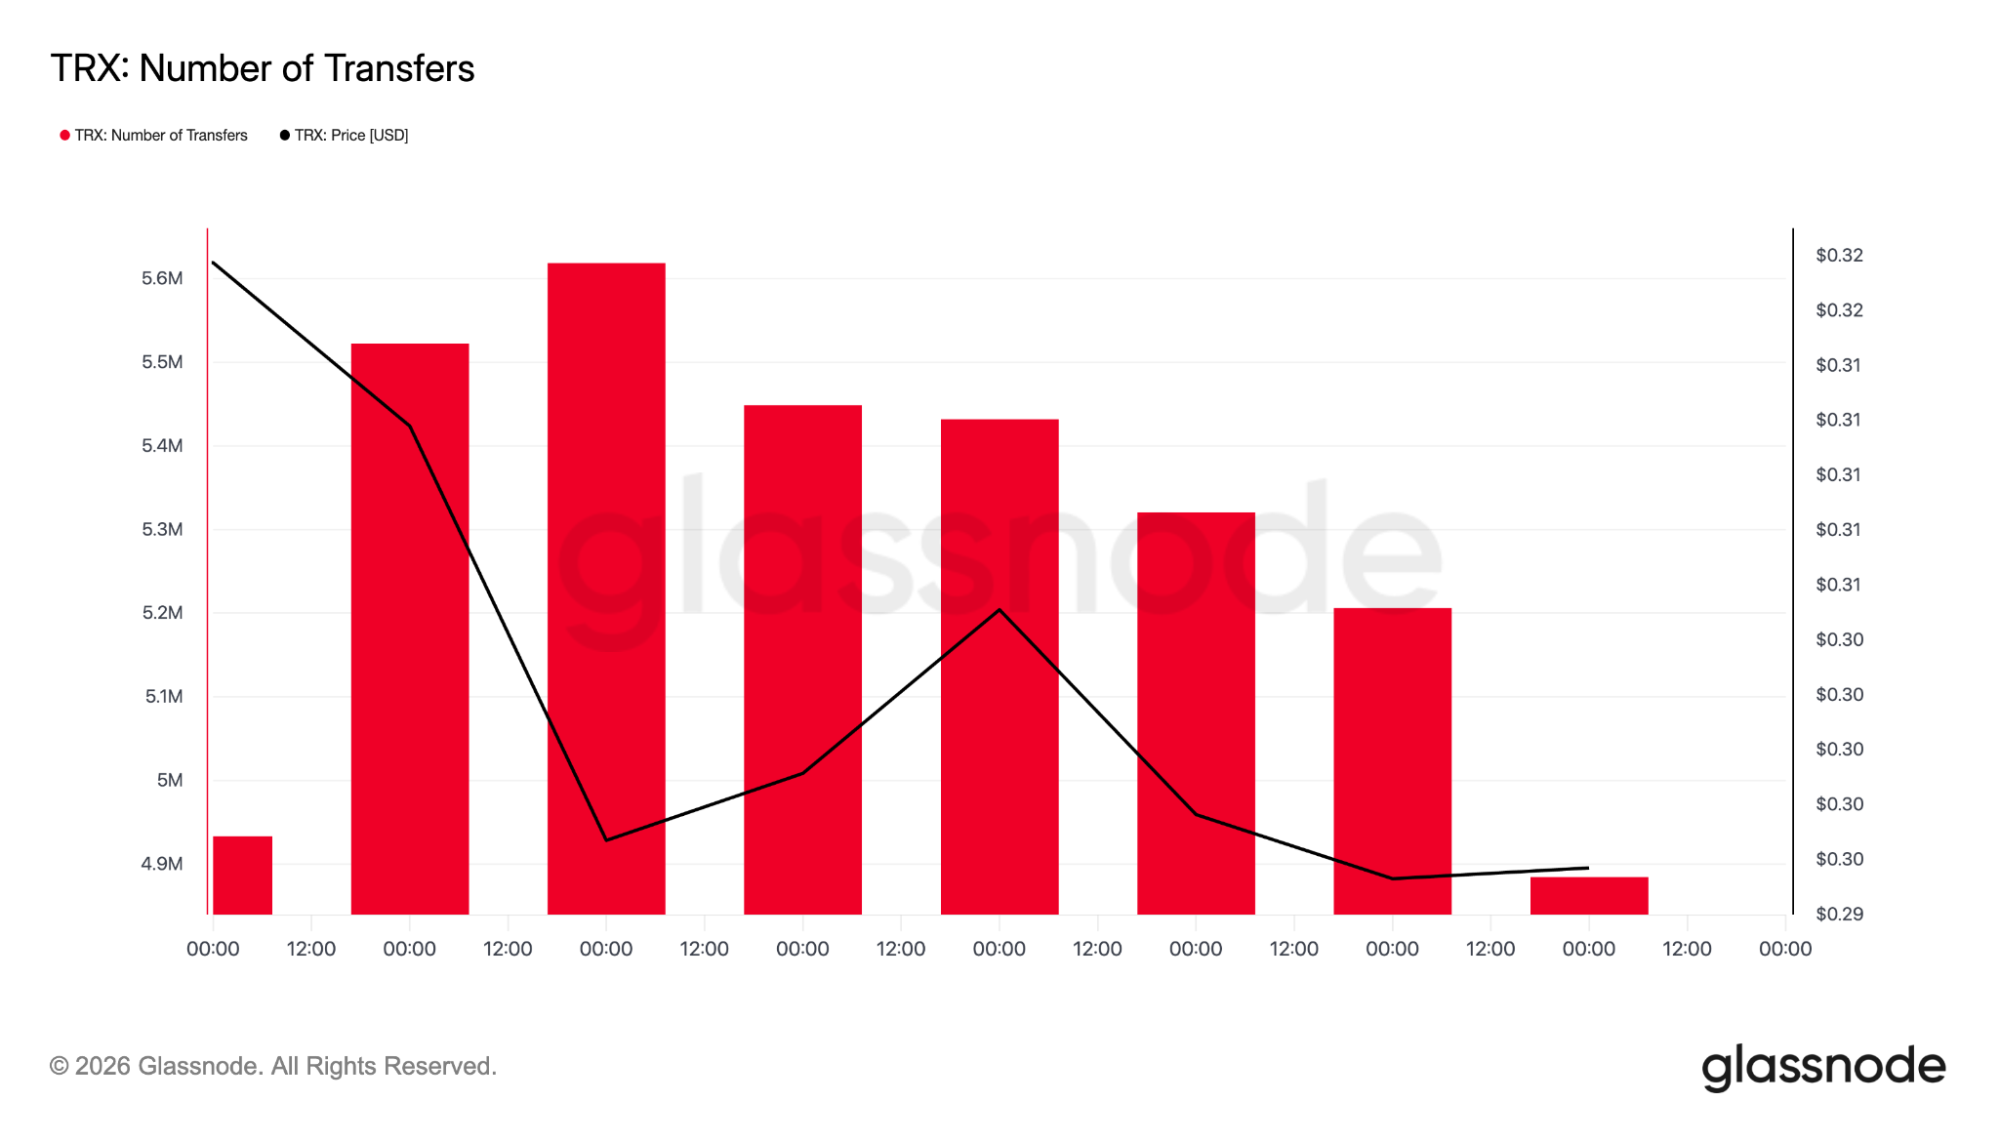
The transfer data tells a similar story. TRON continues to process roughly 5 million transactions per day, showing that activity around payments, stablecoins, and settlement hasn’t slowed down. This lines up well with the idea that TRON isn’t relying on narratives or hype, but on actual usage.
TRX stands apart as key price levels come into focus
One of the most interesting things about TRON right now is how different it looks compared to many other large-cap coins.
Bitcoin is stuck in a range. A lot of altcoins are struggling to attract steady demand. Yet TRX is quietly grinding higher. That doesn’t mean it’s about to surge, but it does indicate that some capital is rotating into assets that look fundamentally stronger.
A few key levels matter; on the upside, the $0.32 to $0.325 zone is still the main barrier. A clean break above that area could open the door toward $0.35 and possibly even $0.37 if momentum builds.
On the flip side, the $0.295 to $0.300 zone is the key zone in the short-term picture. As long as the TRX price is able to hold above this zone, the larger picture is bullish.
A break below this level would shift the focus back to the $0.27 to $0.28 support zone. Thus far, each time this asset has dipped to support, it has continued to attract buyers, and this is adding to the belief that this is an accumulation phase rather than a distribution phase.
What’s next for TRON?
TRX might not be dominating headlines right now, but in this kind of market, that’s probably a strength rather than a weakness. When much crypto remains stuck in neutral, TRON is quietly holding its ground and building strength.
As long as the TRX price continues to respect its key support levels and outperform relative to other majors, the case for a broader repricing stays very much alive.
Whether that turns into a breakout above $0.32 or a longer consolidation phase will depend on the wider market, but one thing is clear: TRON is starting to trade like a network the market is taking seriously again.
According to CoinCodex’s TRX price prediction, TRON could trade around $0.3432 over the next month, which lines up closely with the upper range of its current structure. That’s the more conservative view. But for the bullish case to really stay in play, the TRX price needs to keep defending the $0.295 to $0.300 area.
Kraken: Best crypto exchange for security & reliability
- Buy, sell, and trade 400+ cryptocurrencies with industry-leading security
- Spot, Futures & Margin trading – leverage up to 5x for advanced traders
- Earn rewards with staking on top cryptocurrencies
- 24/7 customer support and high liquidity for fast trades
- Regulated in the US with strong compliance and security measures
- 13+ million users worldwide
Disclaimer: This content is for informational purposes only and does not constitute financial, investment, or other advice. Nothing on this page is a recommendation or solicitation. Always seek independent professional advice before making investment decisions. Some links may earn us a commission at no extra cost to you.
Source:: TRON Price Analysis: TRX Shows Strength as the Market Stalls – Here’s Why