Key highlights:
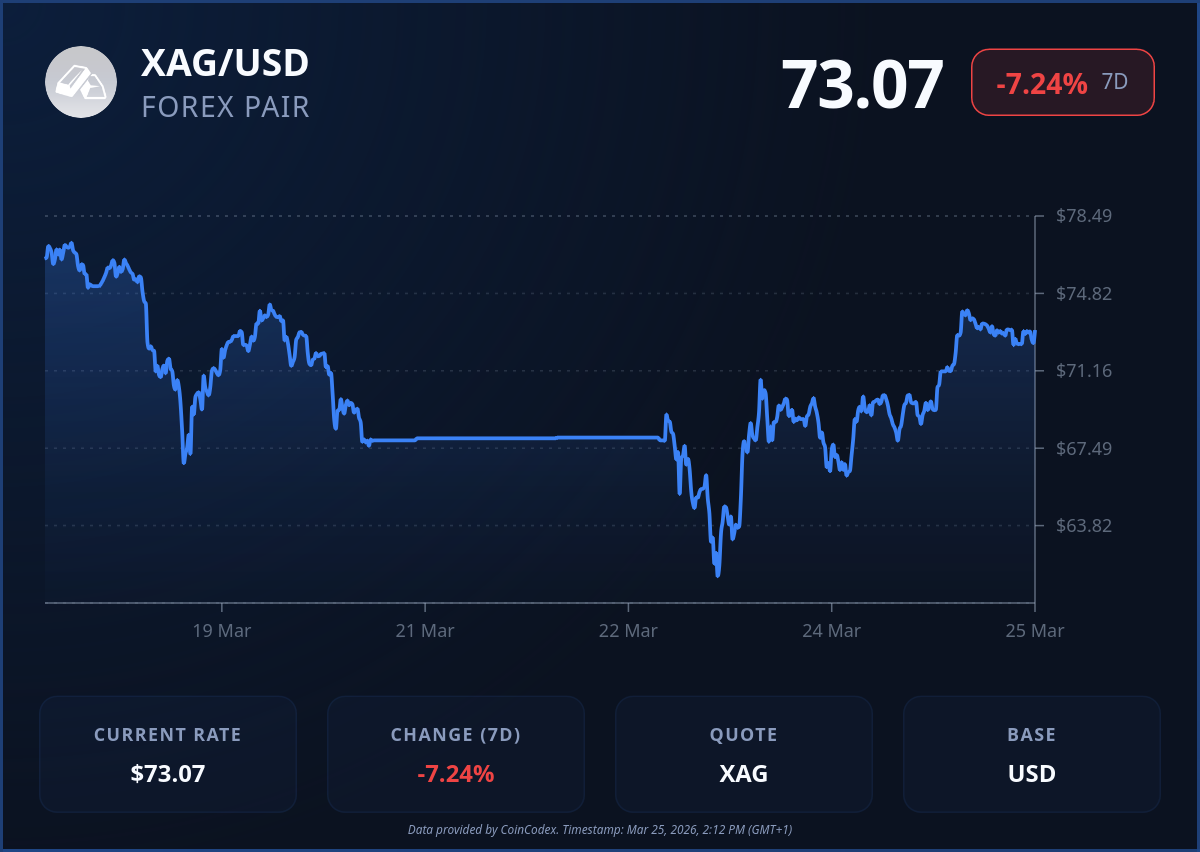
- Silver bounces from $61 to $73 as markets react to signals that the bombing campaign may be winding down
- Analyst indicates underlying supply shortages with demand exceeding supply by hundreds of millions of ounces annually
- Technical levels show silver testing the 100-day SMA at $74 with room to run toward $77 and $92 if momentum holds
Silver touched $61 per ounce on Monday morning. By the time markets got a hint that the bombing campaign was winding down, the price had bounced back $12 to $73. For traders watching the metal, the move was fast. Violent, even. But the story underneath the price action is what really matters.
Wall Street Mav posted a chart showing the sharp reversal, and his take was simple. The market pressure remains high, and the underlying shortages in silver are real. He pointed to silver mining stocks as the play, specifically Aya and Silver X, both of which have room to grow production in coming years. That kind of production upside is rare in the silver mining space.
The supply story underneath it all
Wall Street Mav’s point about shortages is the real story here. Silver demand has outpaced supply for years. The deficit is real, measured in the hundreds of millions of ounces annually. That’s not speculation. That’s just the numbers.
Silver got as low at $61 per oz Monday morning. But as soon as markets get a hint that Trump is winding down the bombing campaign, silver bounces back by $12 to $73 per oz.
The market pressure remains higher. The shortages in silver are real. Demand exceeds supply by several… pic.twitter.com/UcLdxGOMY0
— Wall Street Mav (@WallStreetMav) March 25, 2026
What we’re seeing in the silver price right now isn’t a demand problem. It’s a market structure problem. When the geopolitical situation got hot, institutions sold whatever they could to raise cash. Silver was liquidated. Gold was liquidated. It had nothing to do with the fundamentals of the metal. It was just forced selling.
Now that the selling pressure is easing, the underlying supply-demand picture is reasserting itself. Silver bounced $12 in hours because the bid was always there. It just got overwhelmed by sellers who needed cash fast.
The silver 4-hour chart shows a violent reversal
If you take a look at the 4-hour chart, the move is impossible to ignore. Silver was grinding lower for weeks, slicing through support levels like they weren’t even there. The price dropped from the $100 zone down to $61 in what felt like no time at all. The selling was relentless. But then something changed.
The chart shows a massive green candle, one that swallowed days of selling in a single session. Silver ripped from the lows near $61 all the way up to $73, a $12 move in hours. That’s the kind of price action that gets your attention.
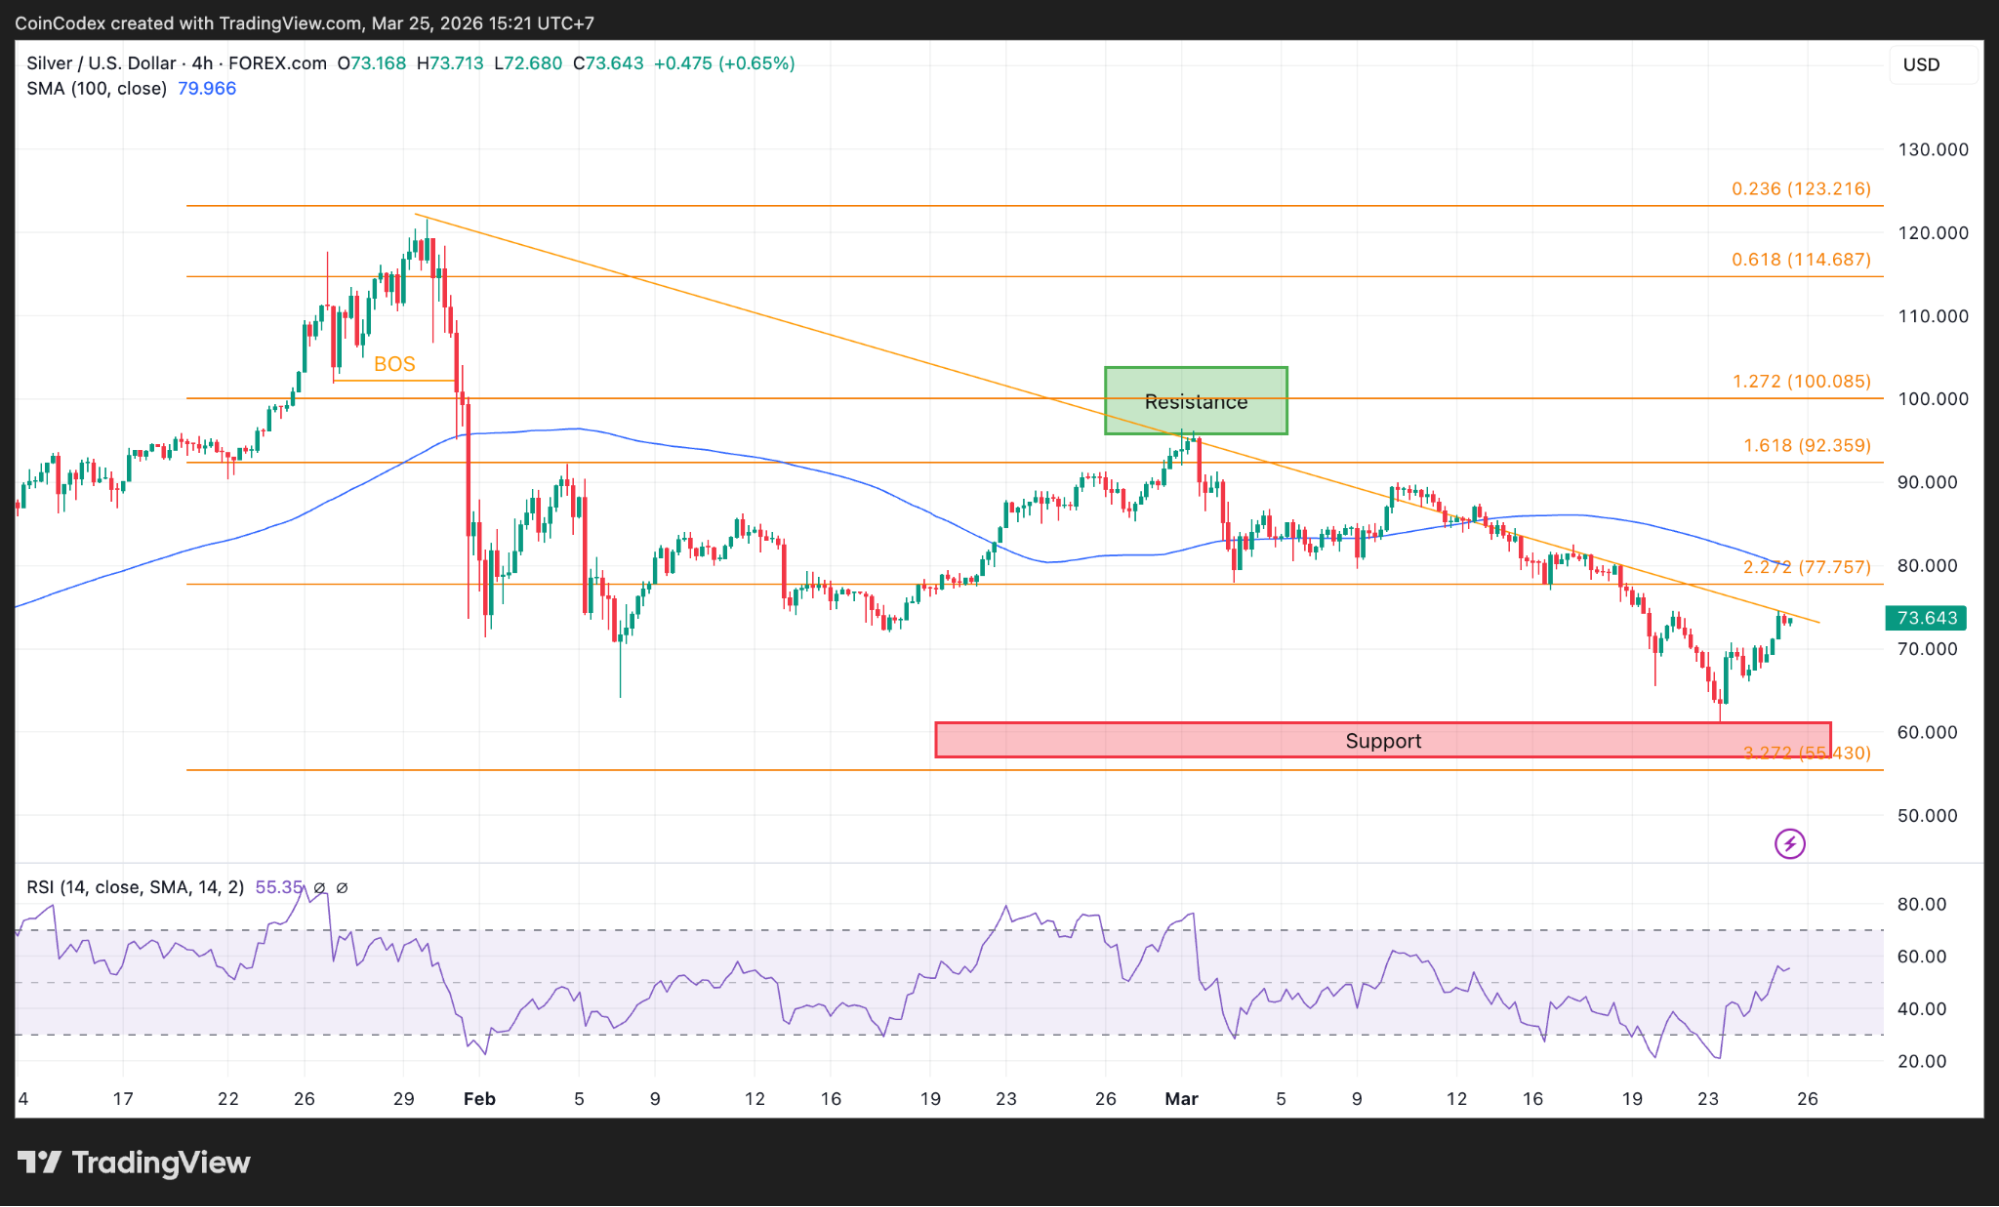
4-hour silver price chart analysis
The 100-period SMA is sitting up at $79.96, way above the current price, which tells you the longer-term trend is still bearish. But the fact that silver bounced so aggressively from those lows suggests that sellers might be running out of steam. The RSI on the 4-hour is sitting at 55.35, neutral with room to run. Not overbought, not oversold. Just sitting there, waiting for the next move.
The Fibonacci levels on this chart show the path ahead. The 2.272 extension sits at $77.76, which is the first real resistance above. That’s about $5 higher from here.
Above that, the 1.618 extension at $92.36 is the next target, and the 1.272 extension at $100.09 is where silver topped out earlier in the cycle. So there’s a roadmap. Whether silver can follow it depends on whether the geopolitical picture keeps improving.
The Silver daily chart shows a breakout from oversold territory
Zooming out to the daily chart, the picture is a little more complicated. Silver is currently trading at $73.52, and the 100-day SMA is sitting at $74.09, which is basically right above current price.
That’s a key level. If silver can close above that, it would be the first time since the crash that price has reclaimed the 100-day moving average. That’s a technical milestone worth paying attention to.
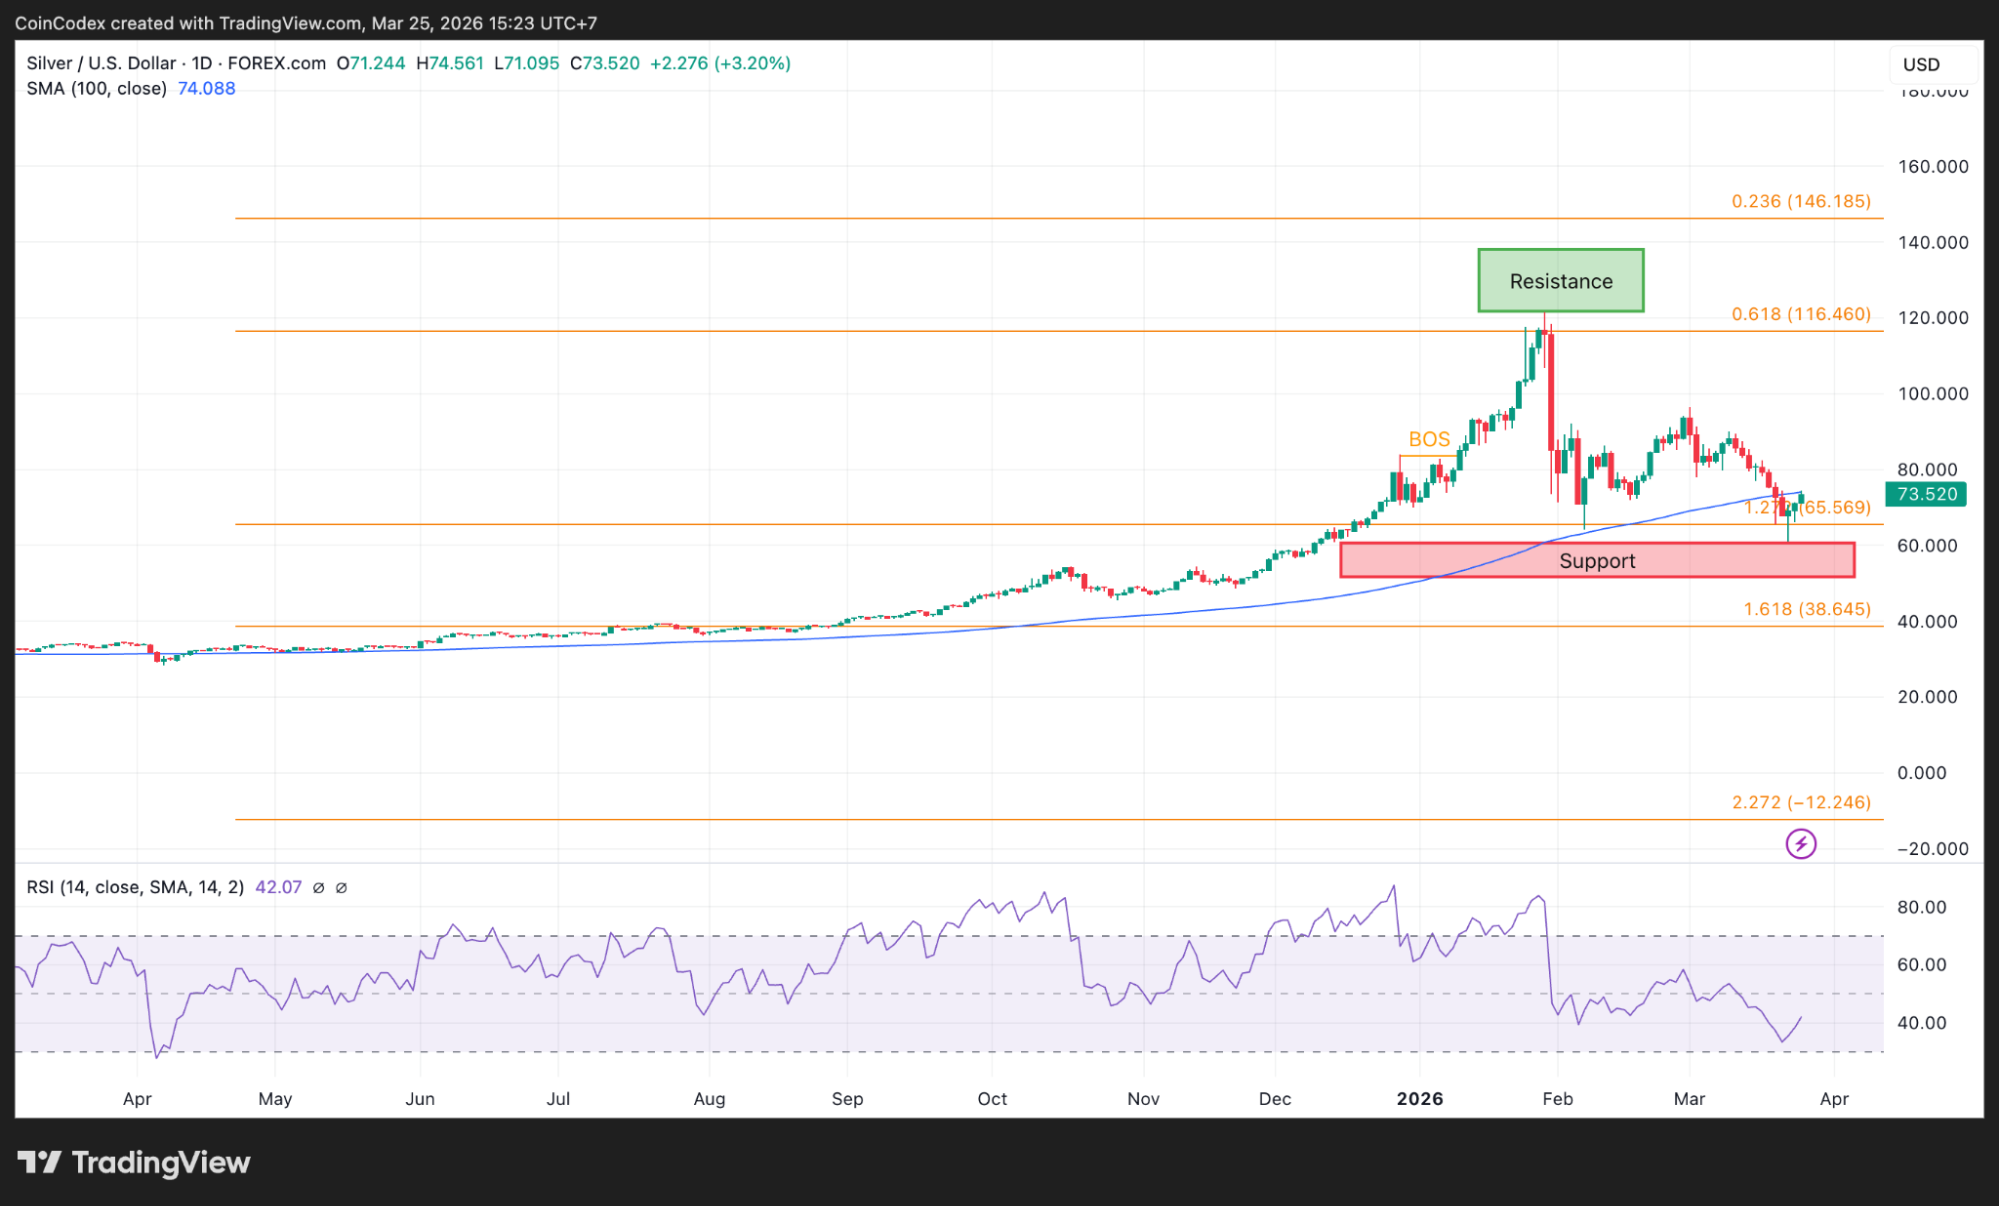
Daily silver price chart analysis
The RSI on the daily is sitting at 42.07, which is still technically in oversold territory. That means even after this bounce, silver hasn’t even reached neutral yet. There’s plenty of room to run if the momentum continues. That’s actually a bullish sign. It means the move isn’t stretched, and there’s still upside potential without being overbought.
The Fibonacci levels on the daily chart show where silver could go if the recovery has legs. The 1.618 extension sits at $38.65, which is actually below current price, so that level is not relevant.
The more interesting levels are the 0.618 retracement at $116.46 and the 0.236 at $146.19. Those are the longer-term targets, the kind of numbers that matter for investors holding physical silver or mining stocks for the long haul.
Where could silver go next?
The silver price is now sitting at $73, having reclaimed a chunk of the losses from the past few weeks. The next test is the 100-day SMA at $74. If silver can clear that and hold, the path toward $77 and then $92 opens up. That’s a 25 to 30 percent move from here.
On the downside, support sits at $68, with stronger support at the recent lows near $61. A break below that would mean the bounce was just a dead cat, and the downtrend continues.
Wall Street Mav’s call on silver mining stocks is worth considering, too. If the silver price runs, the miners with production upside are the ones that tend to outperform. For now, silver is moving on geopolitics and technicals. The supply story hasn’t gone away, and when the noise settles, that’s what will drive the silver price higher.
CoinCodex’s 1-month silver price prediction places the metal at $53.85, pointing to a pullback from current levels near $73 if the geopolitical-driven bounce loses steam. This indicates the recent rally may face resistance as markets digest the news, with the silver price potentially retesting lower support zones.
Source:: Silver Price Prediction: XAG Moves Higher as Trump Signals End to Bombing Campaign