Key highlights:
- SHIB is holding a key support zone around $0.00000520–$0.00000560, giving traders a potential bounce point.
- Resistance near $0.00000645–$0.00000650 is crucial; a clean break could trigger a bigger move.
- On-chain activity shows cooling interest, meaning recent price moves weren’t fully backed by user engagement.
There’s been a lot of conversation around Shiba Inu lately, and it mostly comes down to one thing: are we about to see a real breakout, or is this just another short-lived bounce?
Some traders think a bigger move could be coming. A recent post from World Of Charts identifies a potential breakout for SHIB. If price can push past both the trendline and key resistance, a rally of over 50% could happen. It sounds promising, but looking closer, the situation isn’t that straightforward.
$Shib #Shib Building Up For Solid Breakout, Trend Line + Horizontal Resistance Breakout Can Lead 50%+ Rally In Coming Days https://t.co/b6OakOIEWR pic.twitter.com/TsomPffccZ
— World Of Charts (@WorldOfCharts1) March 30, 2026
The Bigger Trend Hasn’t Changed Yet
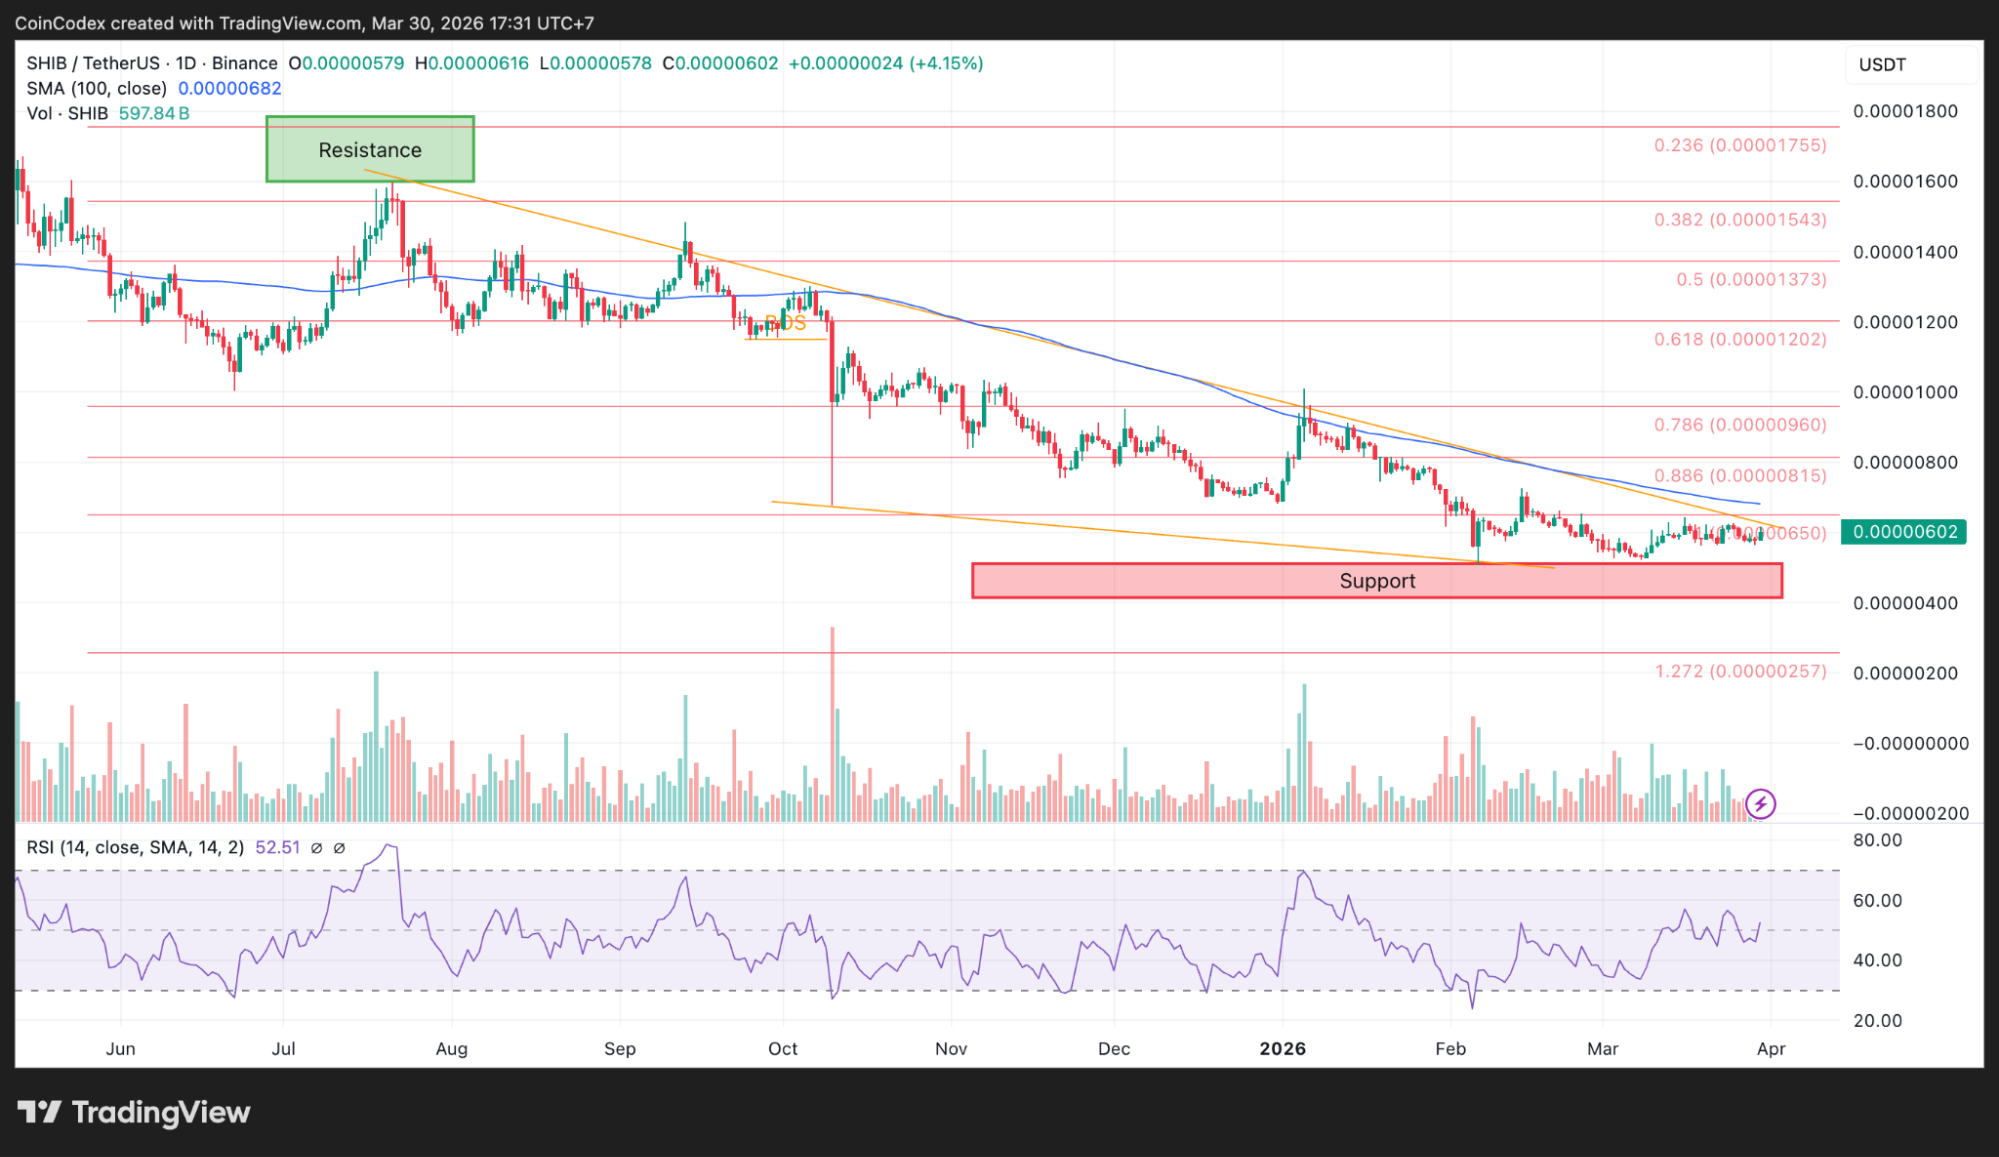
Taking a step back and looking at SHIB’s daily chart, the bigger picture is still leaning down. Since mid-2025, price has been moving inside a descending channel, making lower highs and lower lows, and that pattern hasn’t changed.
Daily SHIB price chart analysis
Right now, SHIB is around $0.00000606, bouncing off a support zone between $0.00000520 and $0.00000560. This area has held up a few times, which is why it’s getting so much attention from traders.
There’s also been a push toward the top of the channel, and that’s where things get interesting. If SHIB can break above that trendline, it could be the first sign the downtrend is losing strength. Until that happens, though, this still looks like a bounce within the bigger downtrend.
What the SHIB chart is showing
Zooming in, things are getting tight. Price is around $0.00000603 and moving near a key level around $0.00000609.
Just above that, there’s a clear resistance zone around $0.00000645. This level stands out because it lines up with multiple factors, previous price reactions, Fibonacci levels, and that descending trendline pressing down from above.
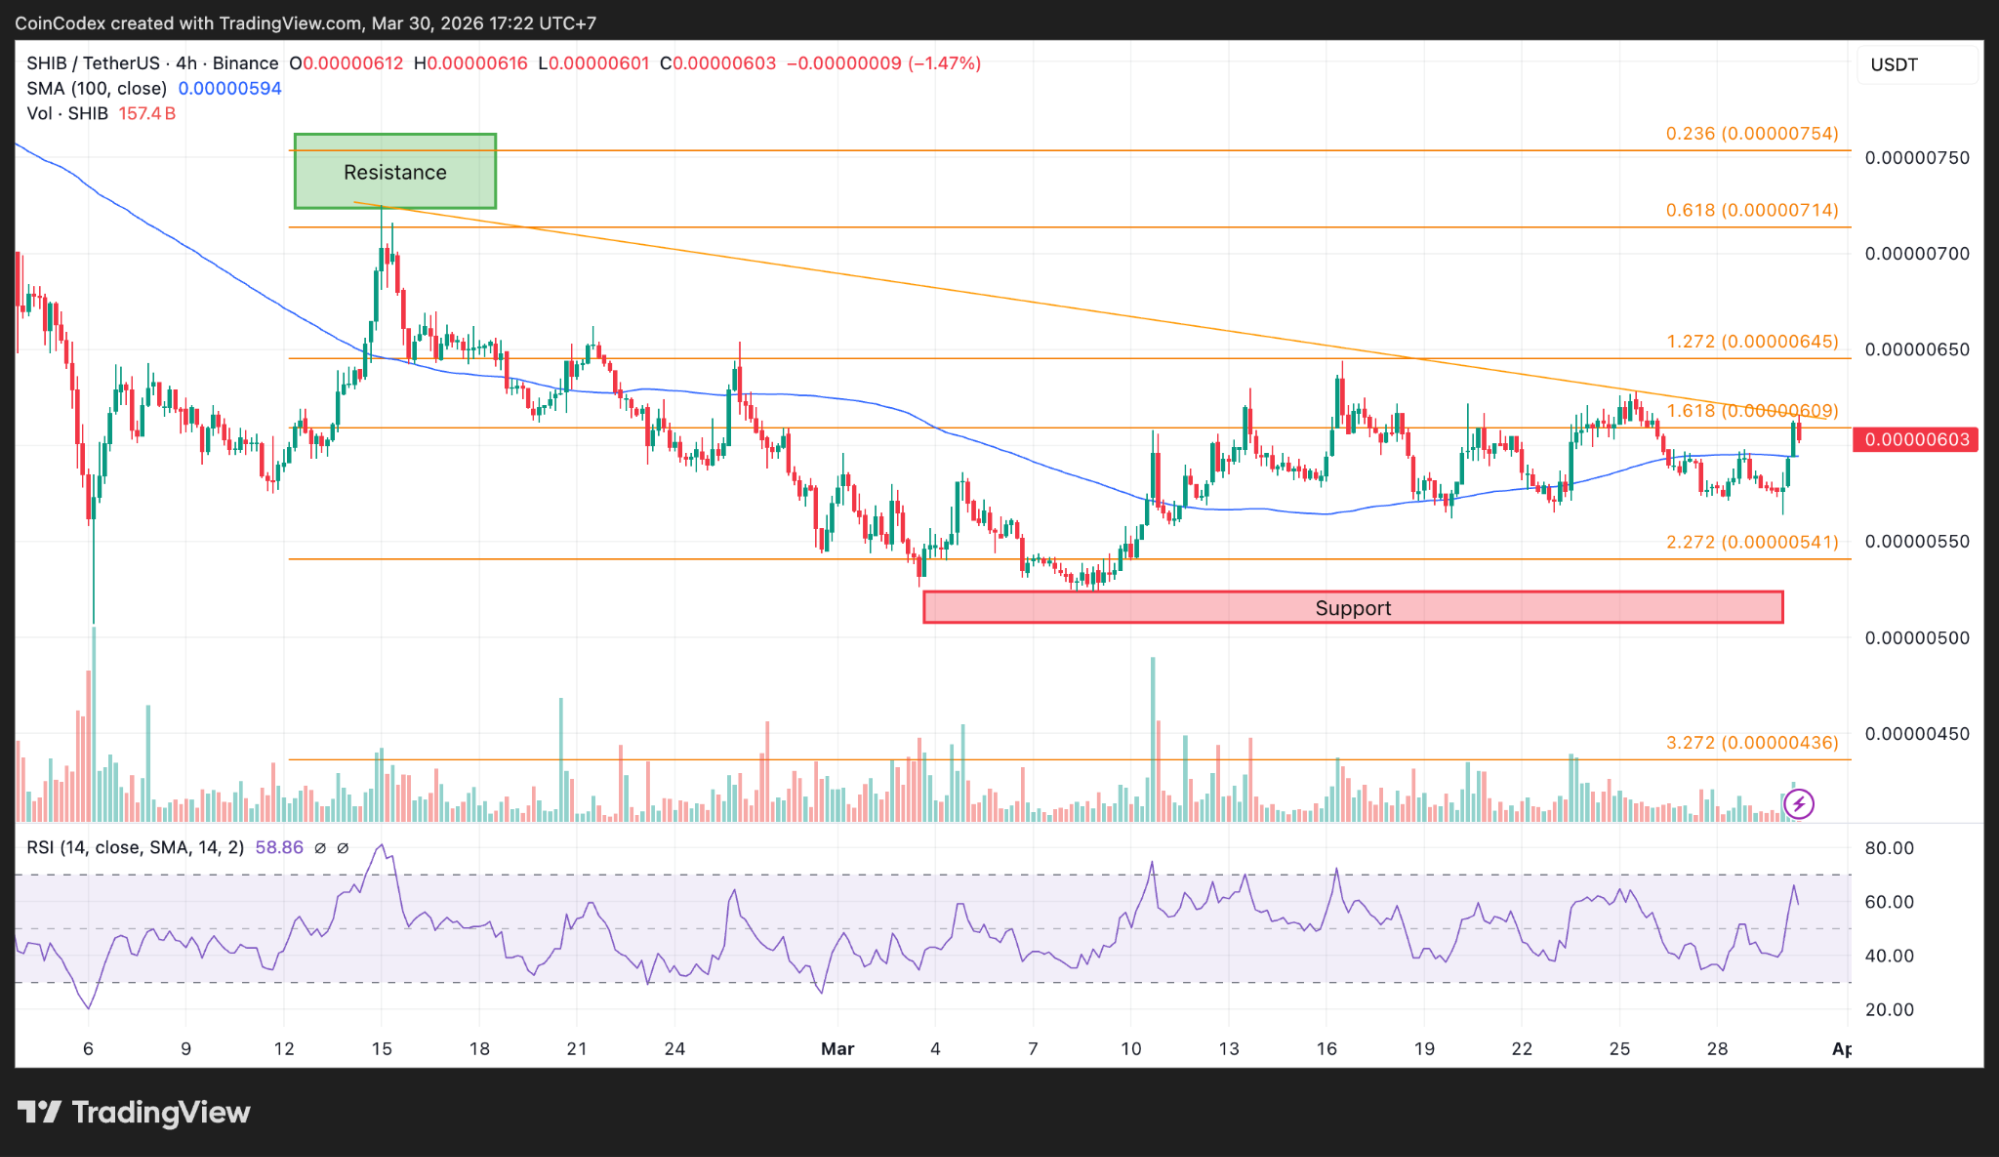
4-hour SHIB price chart analysis
That’s the level everyone’s watching. If SHIB can break through it cleanly, especially with strong volume behind the move, then the breakout idea starts to look more convincing. That’s when traders usually get more confident stepping in.
On the downside, support still sits around $0.00000520–$0.00000541, with a deeper level near $0.00000436 if things turn lower again. Momentum-wise, RSI is around 58, which leaves room for price to move higher before things get overheated. So there’s still some space for bulls to work with here.
The On-Chain Data Isn’t Fully Backing It Yet
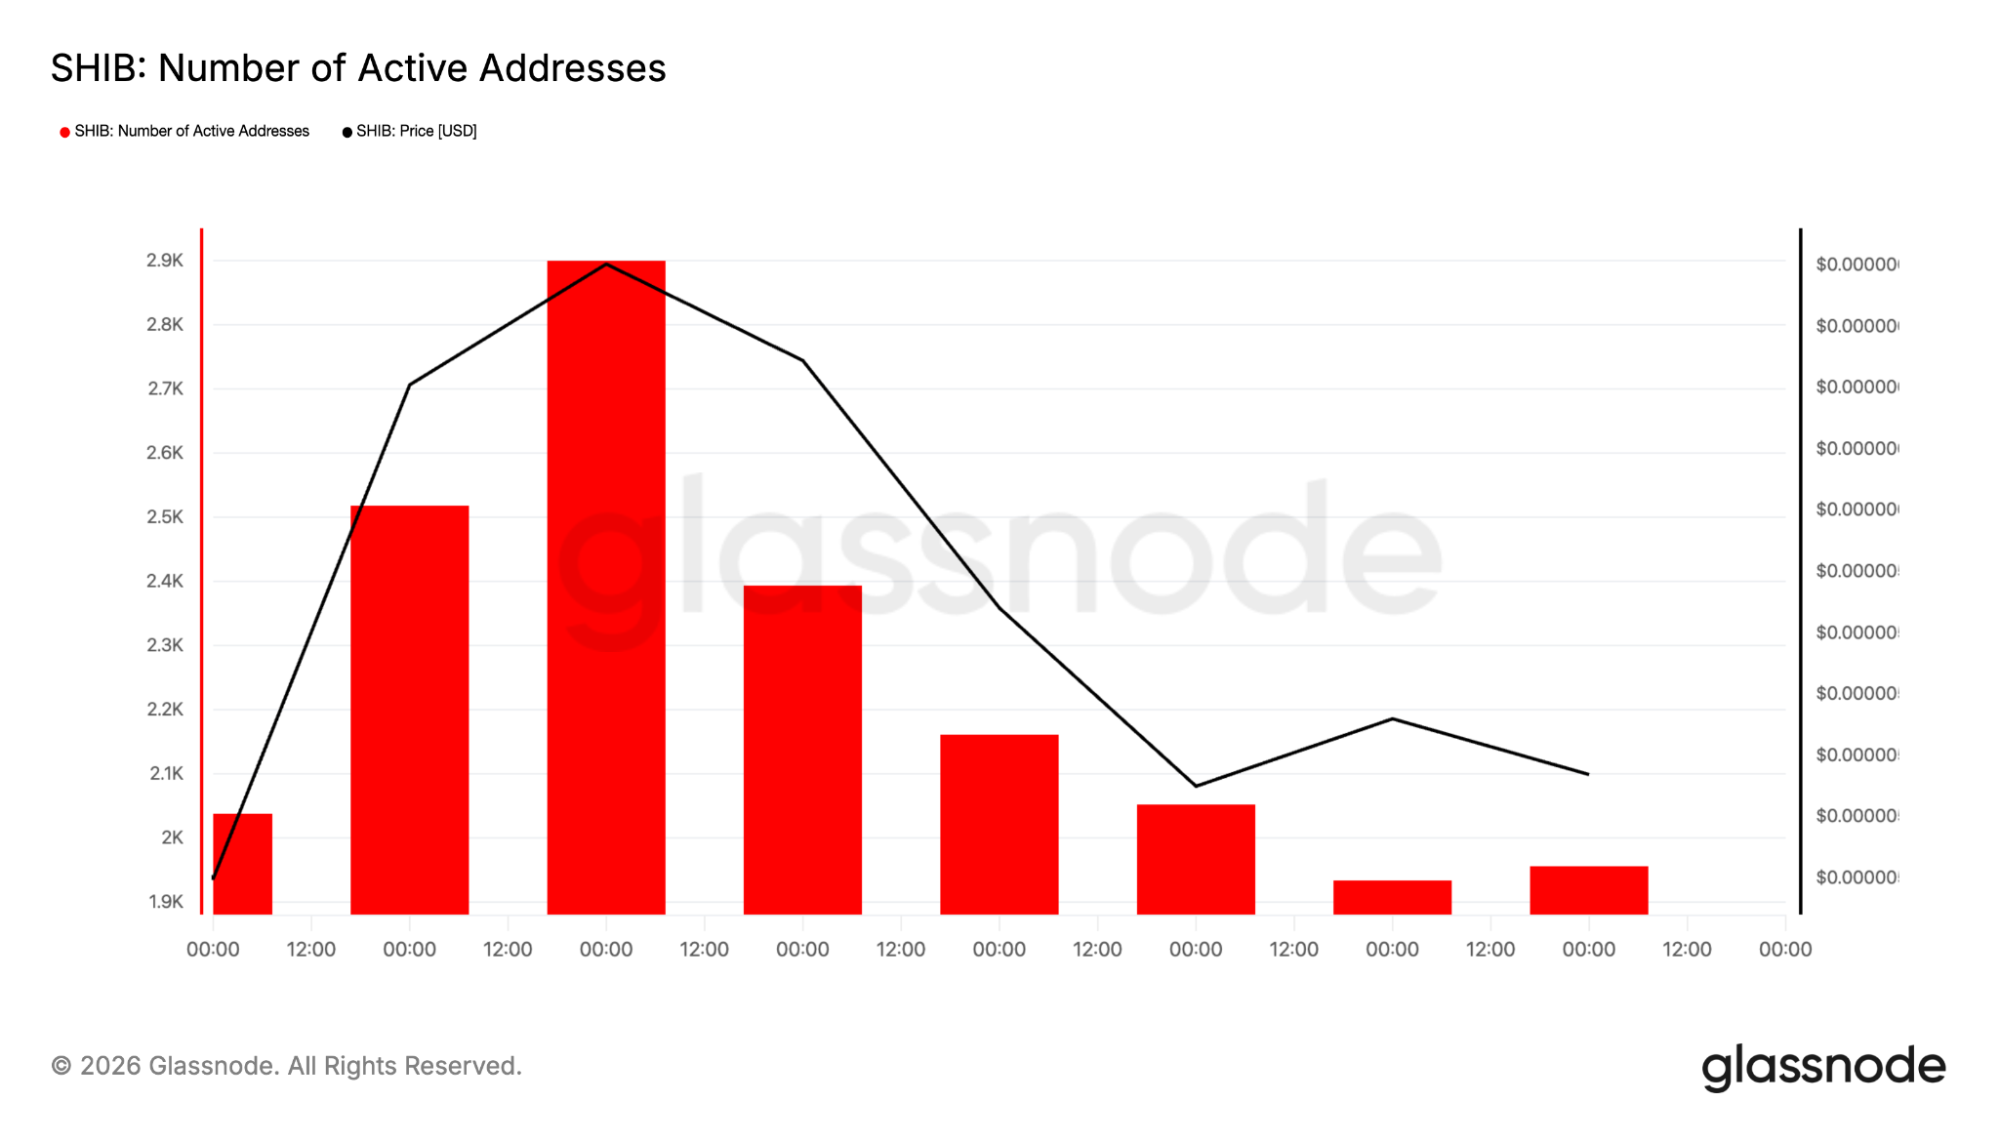
Now here’s the part that makes things a bit less straightforward. On-chain data from Glassnode shows activity has dropped off after the recent price move. Active addresses climbed to about 2.9K but have since fallen to around 1.9K.
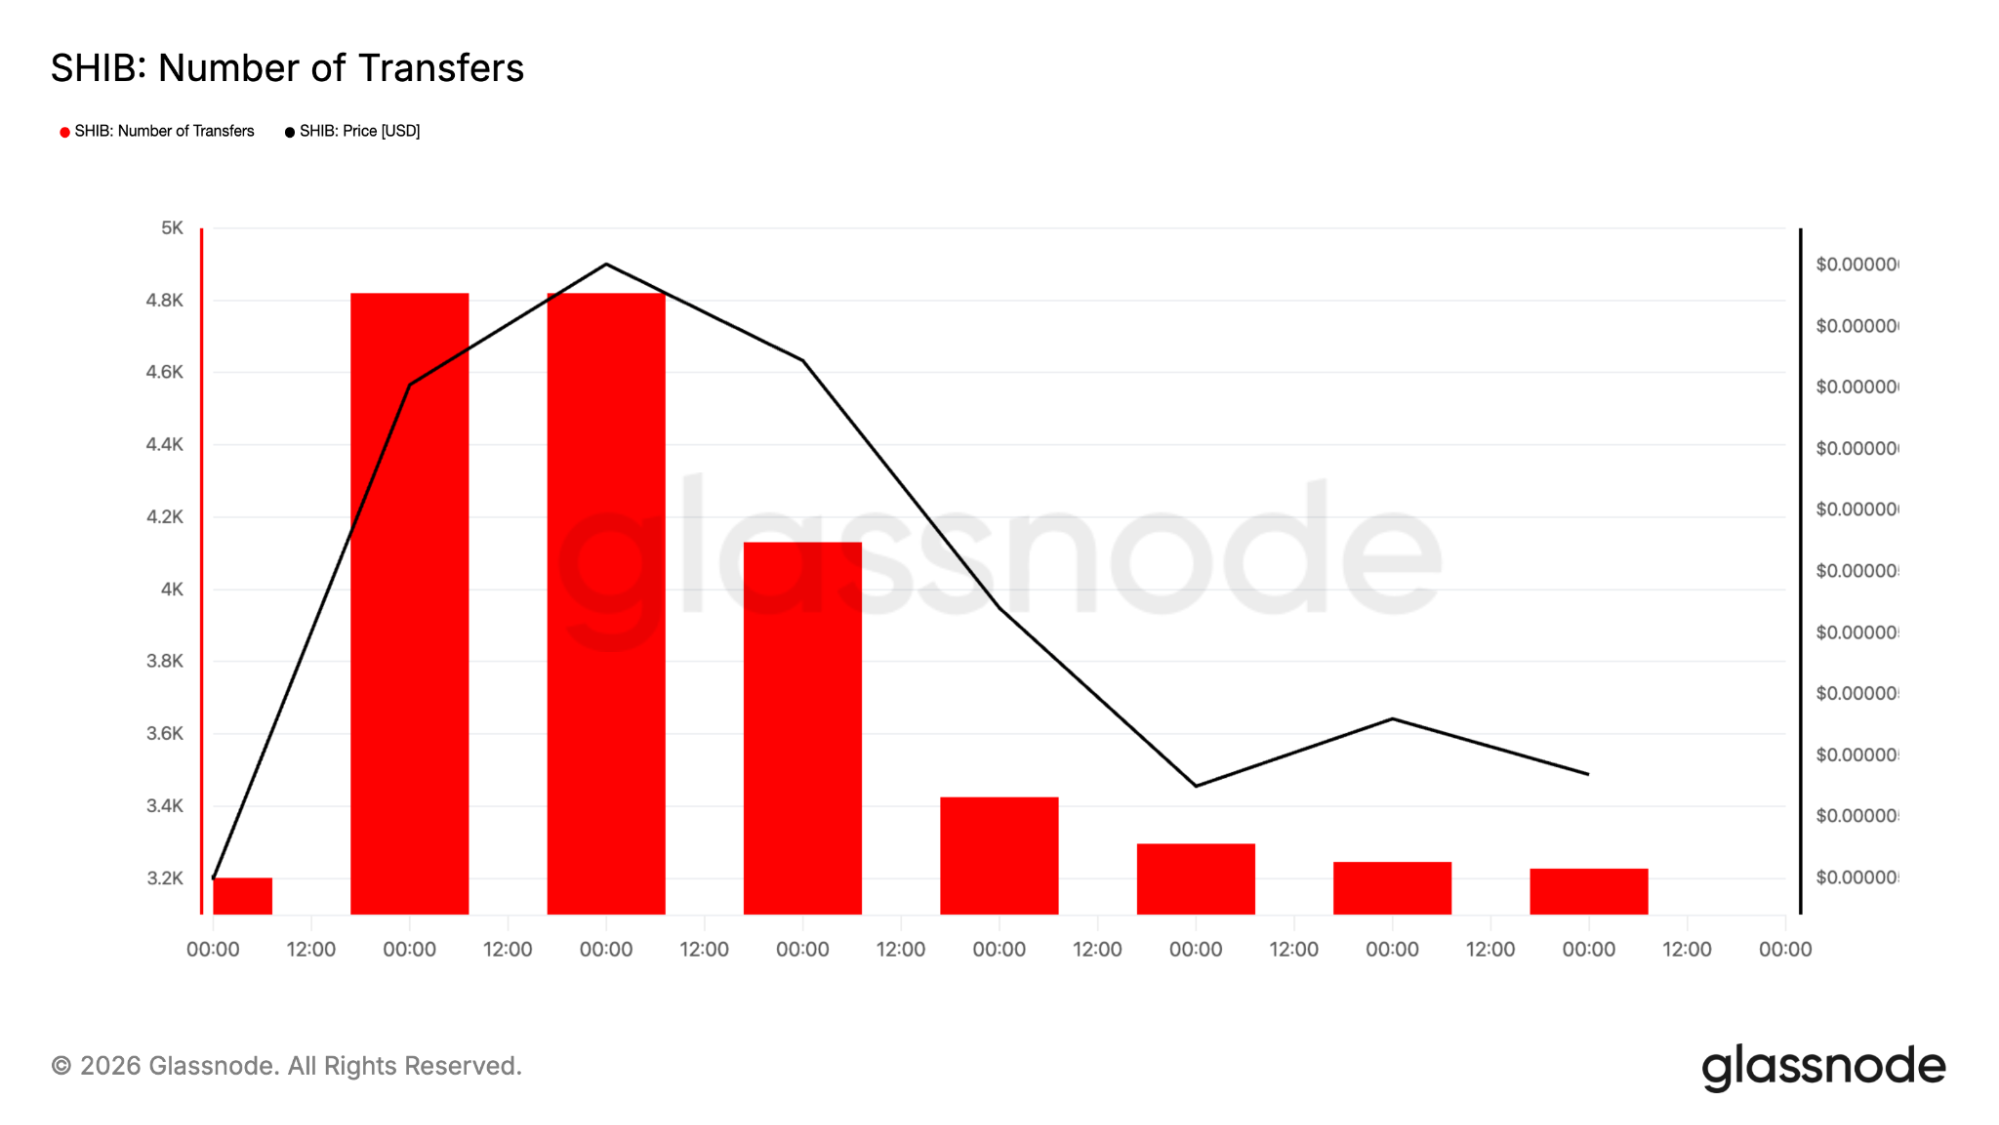
Transfers followed the same pattern, dropping from roughly 4.8K to about 3.2K. That kind of drop usually means the spike in interest was driven by price, not steady user growth. It doesn’t rule out a rally, but it does mean the foundation isn’t as strong as it could be. For a move to really hold, you’d want to see activity picking up alongside price, not cooling off.
The Level That Really Matters
Everything right now comes down to one key zone: $0.00000645–$0.00000650. This is where multiple layers of resistance come together. You’ve got the trendline, Fibonacci levels, and past price reactions all stacked in the same area.
That’s not an easy level to break. If SHIB manages to push through and stay above it, then things could open up toward higher levels like $0.00000815 and beyond. That’s where the idea of a bigger rally starts to make sense.
But if price gets rejected there again, it keeps the current trend intact and increases the chances of another move back down toward support. What’s interesting is that this kind of setup isn’t unique to SHIB.
A lot of them are coming off extended downtrends, holding support, and testing key resistance levels. Some will break out, others won’t, but the setups are lining up across the board. That usually means the market as a whole is at an important point.
CoinCodex’s 1-month SHIB price prediction places the token at $0.000006309, pointing to a potential move from current levels near $0.00000603 if momentum builds and key resistance levels are cleared.
So What Happens Next?
Right now, SHIB is in that middle zone where things could go either way. There’s a clear bullish case. Price is holding support, momentum is recovering, and there’s a well-defined breakout level that could trigger a stronger move.
At the same time, the bigger trend hasn’t flipped yet. The channel is still intact, price is still below key higher-timeframe levels, and on-chain activity hasn’t fully picked back up.
That’s why the next move matters so much. If SHIB breaks above resistance with strength, the outlook changes quickly. If it gets rejected, then this just becomes another lower high in the same downtrend.
For now, it’s a waiting game, but probably not for long. The levels are clear, the pressure is building, and the setup is there. Traders are watching SHIB closely. A breakout could happen, but it still needs confirmation. Until then, it’s all about how price reacts at that key resistance.
Kraken: Best crypto exchange for security & reliability
- Buy, sell, and trade 400+ cryptocurrencies with industry-leading security
- Spot, Futures & Margin trading – leverage up to 5x for advanced traders
- Earn rewards with staking on top cryptocurrencies
- 24/7 customer support and high liquidity for fast trades
- Regulated in the US with strong compliance and security measures
- 13+ million users worldwide
Disclaimer: This content is for informational purposes only and does not constitute financial, investment, or other advice. Nothing on this page is a recommendation or solicitation. Always seek independent professional advice before making investment decisions. Some links may earn us a commission at no extra cost to you.
Source:: Shiba Inu Price Prediction: Is SHIB Ready for a Breakout? Here's What to Watch