Key highlights:
- Ethereum price is fluctuating at $2,595 after an inability to overcome the $2,650–$2,700 resistance area for the third month in a row.
- On-chain indicators reveal robust staking growth and whale accumulation but daily active address activity is still stuck at 300K–400K.
- In case the ETH price goes below $2,515, it can return to the zone of $2,400–$2,450, while a close above $2,650 can set the stage for a move towards $2,800.
| Ethereum price | $2,595 |
|---|---|
| Key ETH resistance levels | $2,630, $2,650, $2,700, $2,750, $2,850 |
| Key ETH support levels | $2,515, $2,450, $2,400, $2,230, $2,070 |
Ethereum has gained 6.5% in the last week, with the price moving from a low of $2,415 to the current level of $2,628.
The asset pushed through key short-term resistance near $2,515, followed by a volatile few days of price action and rising deposit activity.
However, the ETH price now faces resistance near the $2,650 level, where prior rejection zones have stalled previous attempts to rally further.
According to CryptoQuant, over 36 million ETH is now staked, also reflecting increased long-term conviction from large holders. While the price action looks promising on the surface, exchange deposits and cooling retail participation which have increased introduce a level of uncertainty.
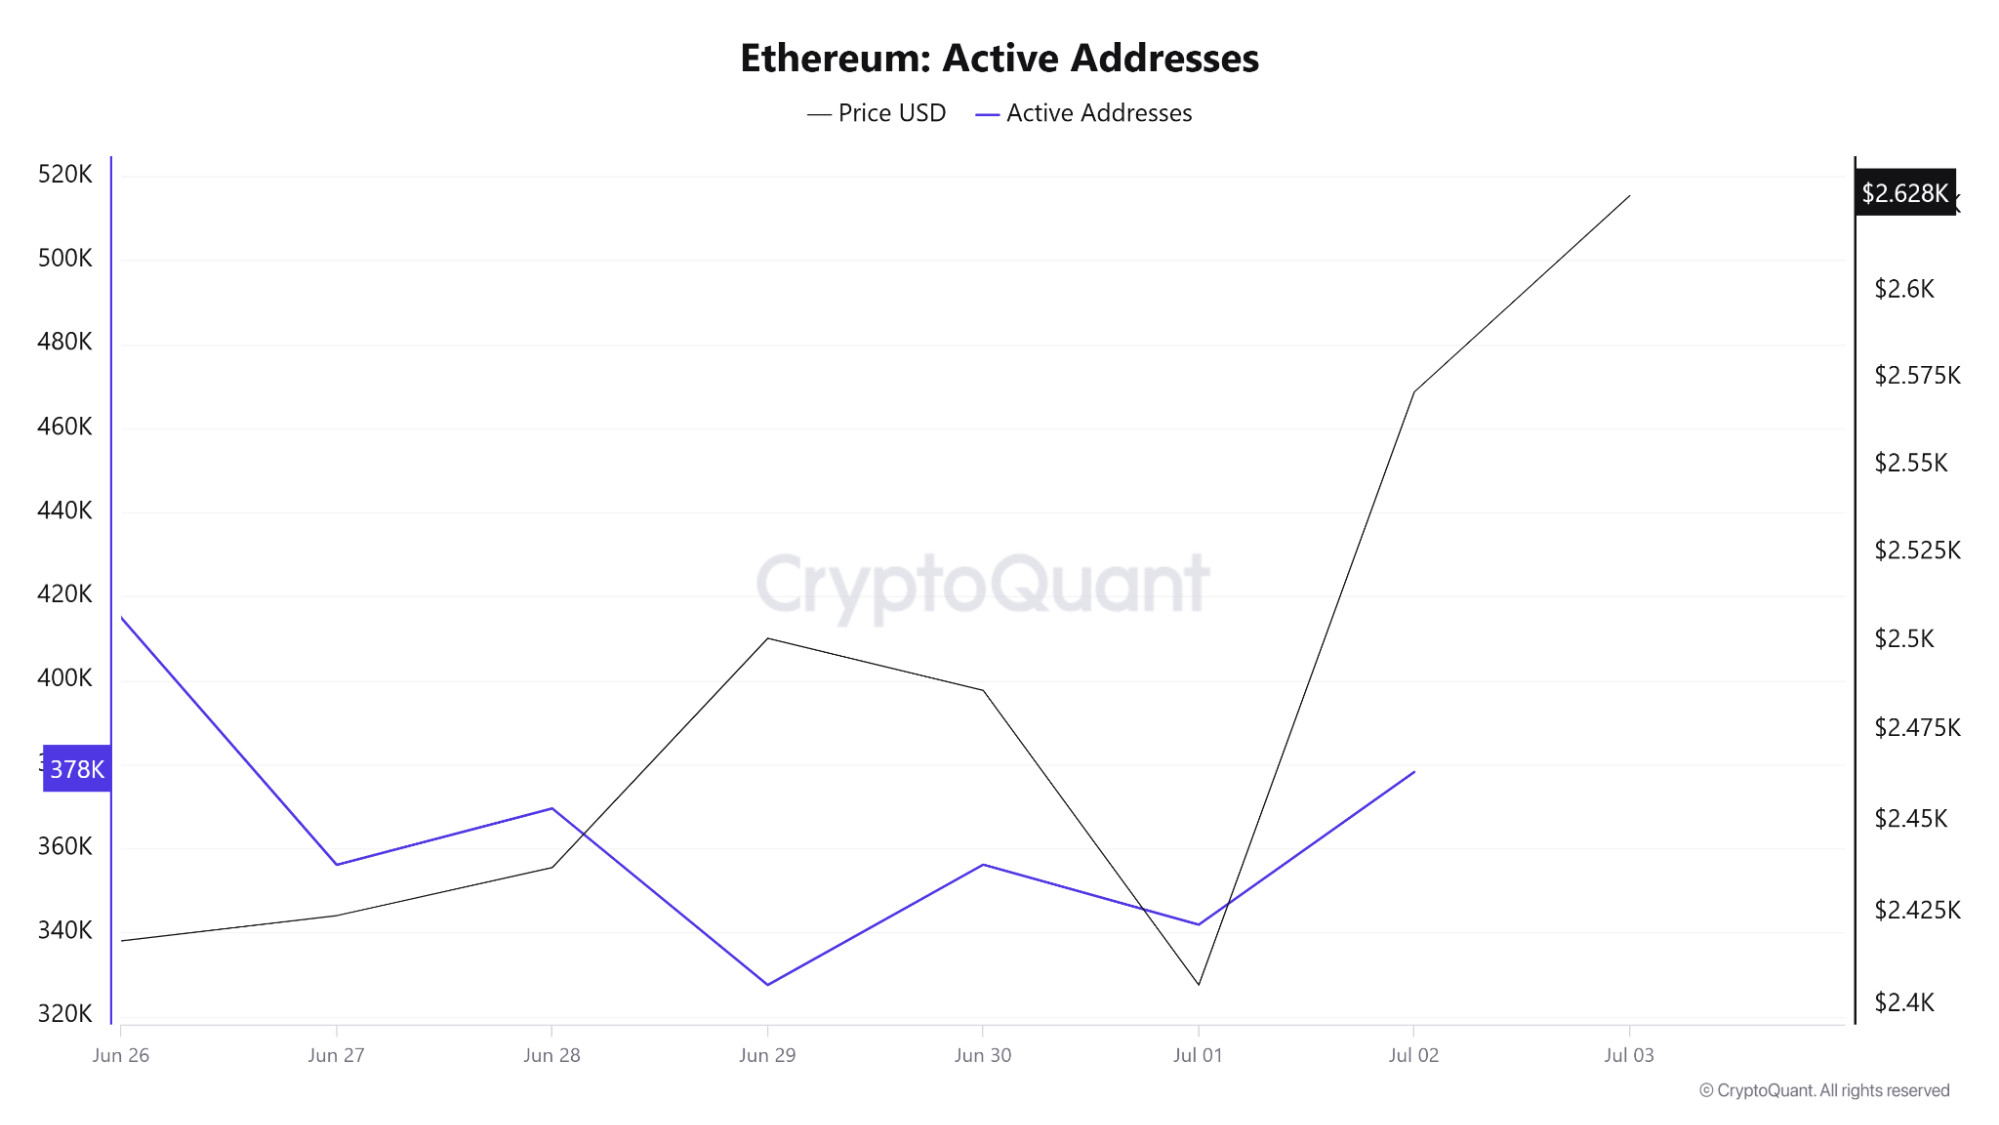
At the same time, active addresses remain flat between 300K and 400K, showing limited retail engagement despite recent bullish momentum.
Exchange metrics: Deposits rise, but price holds steady
On-chain ETH data from CryptoQuant paints a nuanced picture. Exchange netflows showed heavy ETH inflows between June 26 and June 28, peaking at over +90K ETH, yet the price still managed to grind higher from $2,430 to $2,515.
This suggests demand was present to absorb the sell-side liquidity. Between June 29 and July 1, netflows turned negative, with over 45K ETH exiting exchanges on June 30 alone.
That outflow coincided with a brief price dip from $2,520 to $2,480. However, ETH price quickly recovered, and rallied nearly 9% to reach $2,625 by July 3.
Exchange depositing transactions also surged sharply during this rally. On July 2 and July 3, ETH saw 34K and 36K deposit transactions, respectively, the highest on record for the observed period.
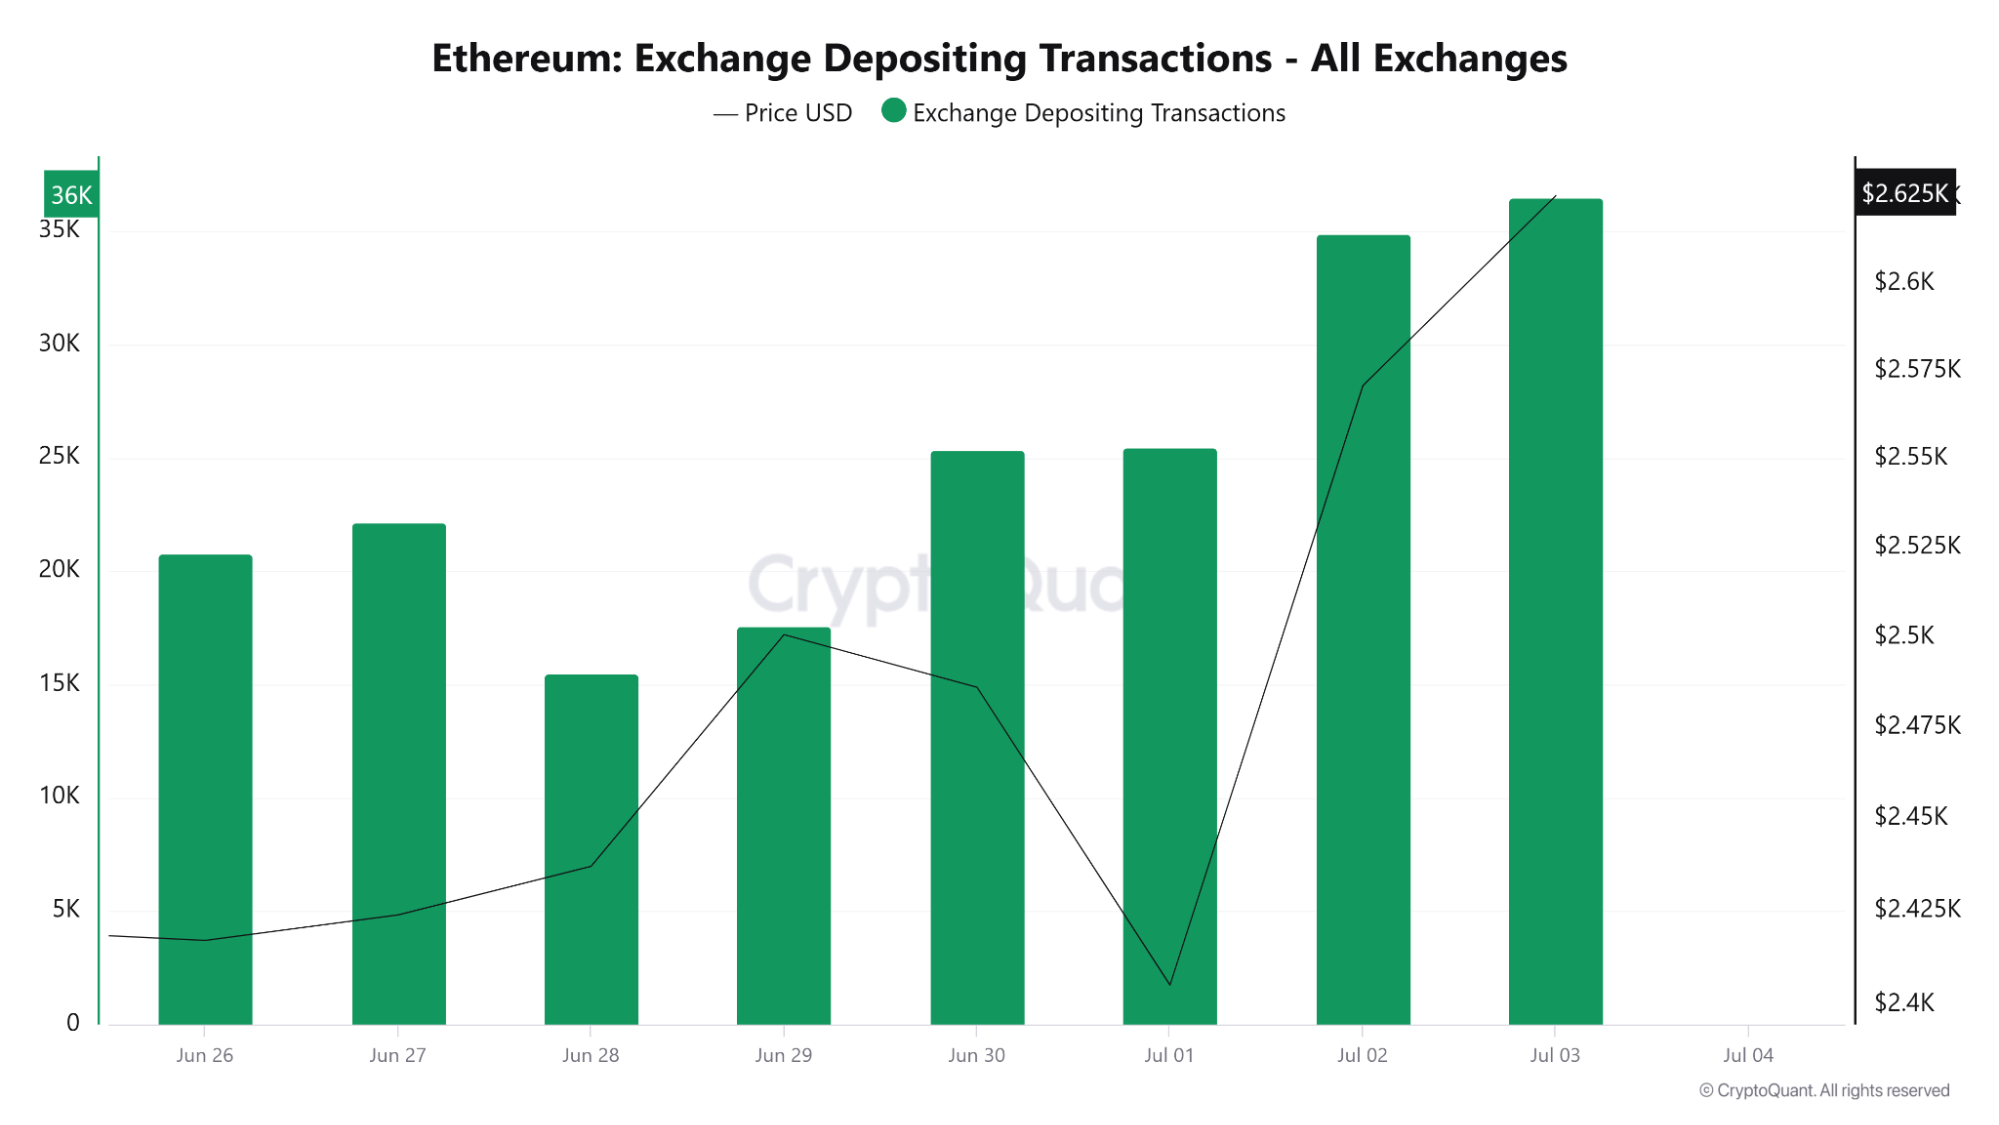
Normally, this would point toward increased sell pressure, but instead, the price moved higher, hinting that liquidity may be entering exchanges for reasons beyond just selling. Some examples are DeFi engagement, staking sites, or NFT markets.
ETH price begins to slow near $2,650, this could be short-term exhaustion. However, if deposit activity weakens while the price supports or rallies, this will again affirm the ongoing uptrend.
Whale activity and staking support price strength
One of the more supportive trends for Ethereum is the continuous rise in staked ETH. From May 30 to July 3, total ETH staked increased from 34.5 million to 35.6 million, a 3% rise in just over a month.
🐋 Ethereum Whales Are Staking Big But Price Still Stalls
36M $ETH now staked (+3% in June) & whales are pulling 200K+ ETH off exchanges weekly. But daily active addresses have flatlined at 300K–400K.
📊 via @cryptoquant_com pic.twitter.com/Dqluc4rDQr
— BeInCrypto (@beincrypto) July 3, 2025
Despite price corrections, the staking line has followed a steady upward path, which suggests consistent accumulation and yield-driven commitment by ETH holders.
Accompanying this is a trend of ETH withdrawals from centralized exchanges. Over 200,000 ETH price per week has been leaving exchanges, according to on-chain metrics. This takes supply out of circulation and indicates a bias towards long-term staking or holding.
Yet, active addresses are subdued, between 300K to 400K with no significant growth. That tells us that although whales and long-term investors are active, retail clients are either wary or uninterested.
Upside ETH price movement tends to need both cohorts to be involved, both long-term and active users. The divergence between rising ETH being staked and stagnant daily addresses introduces a layer of caution. Without increased network activity, the rally may run out of steam.
Ethereum price analysis
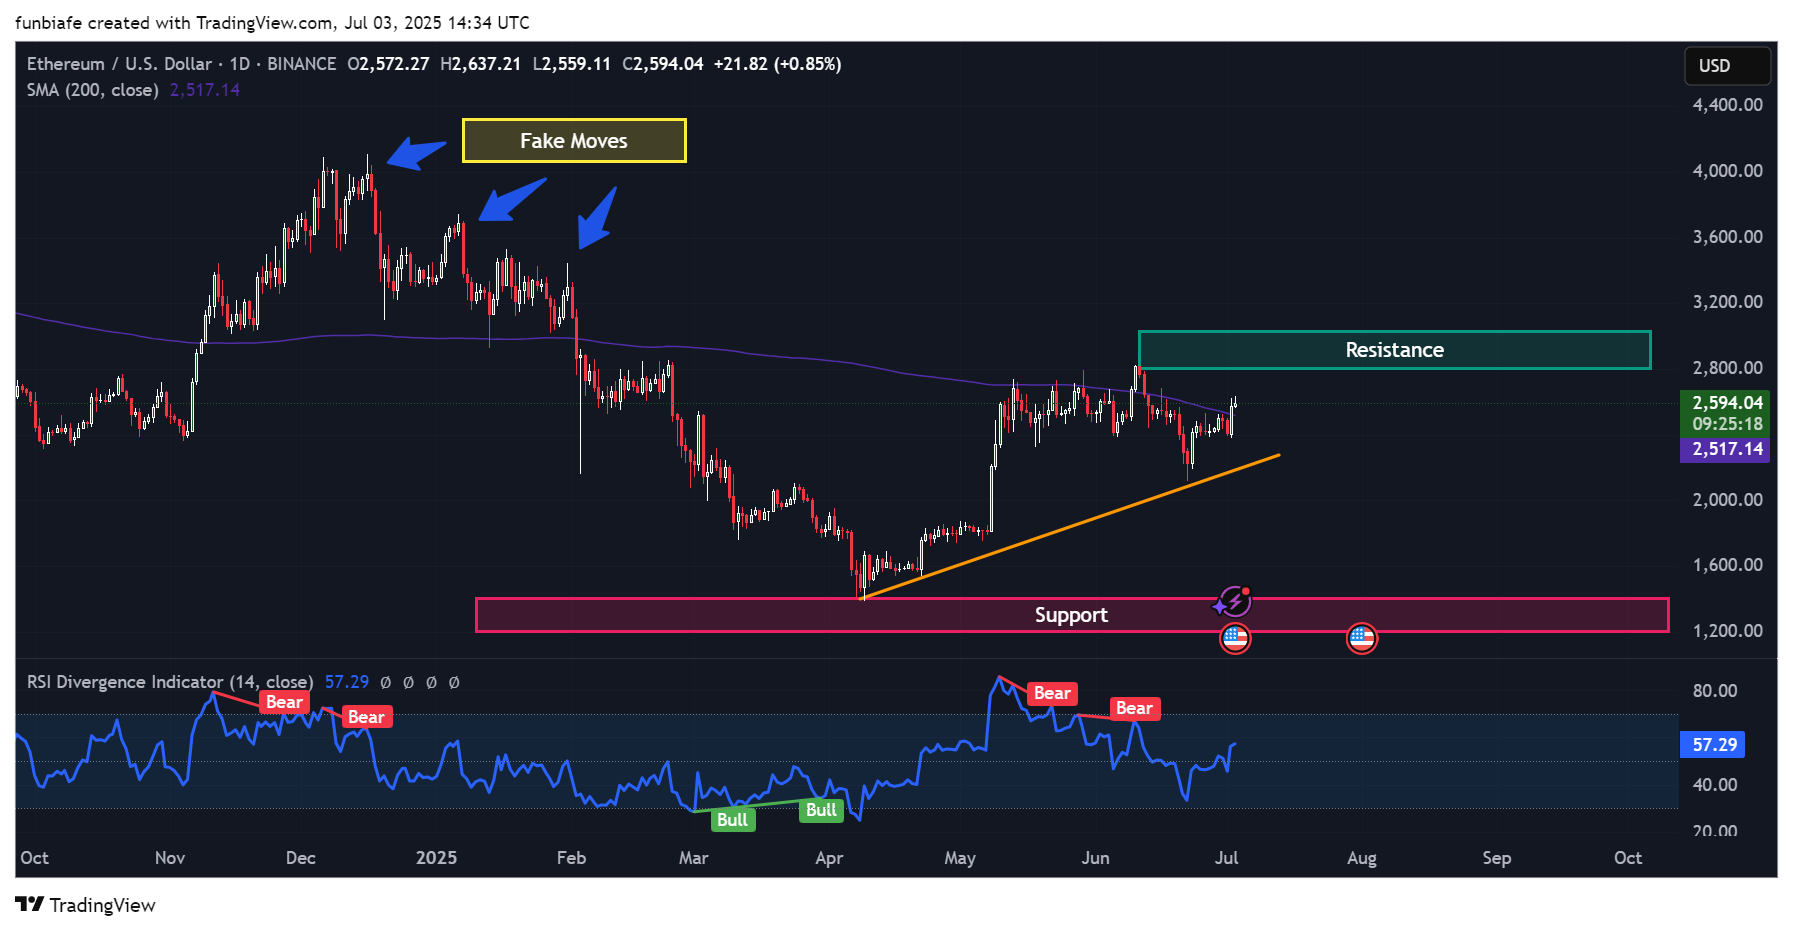
ETH daily chart. Source: Tradingview
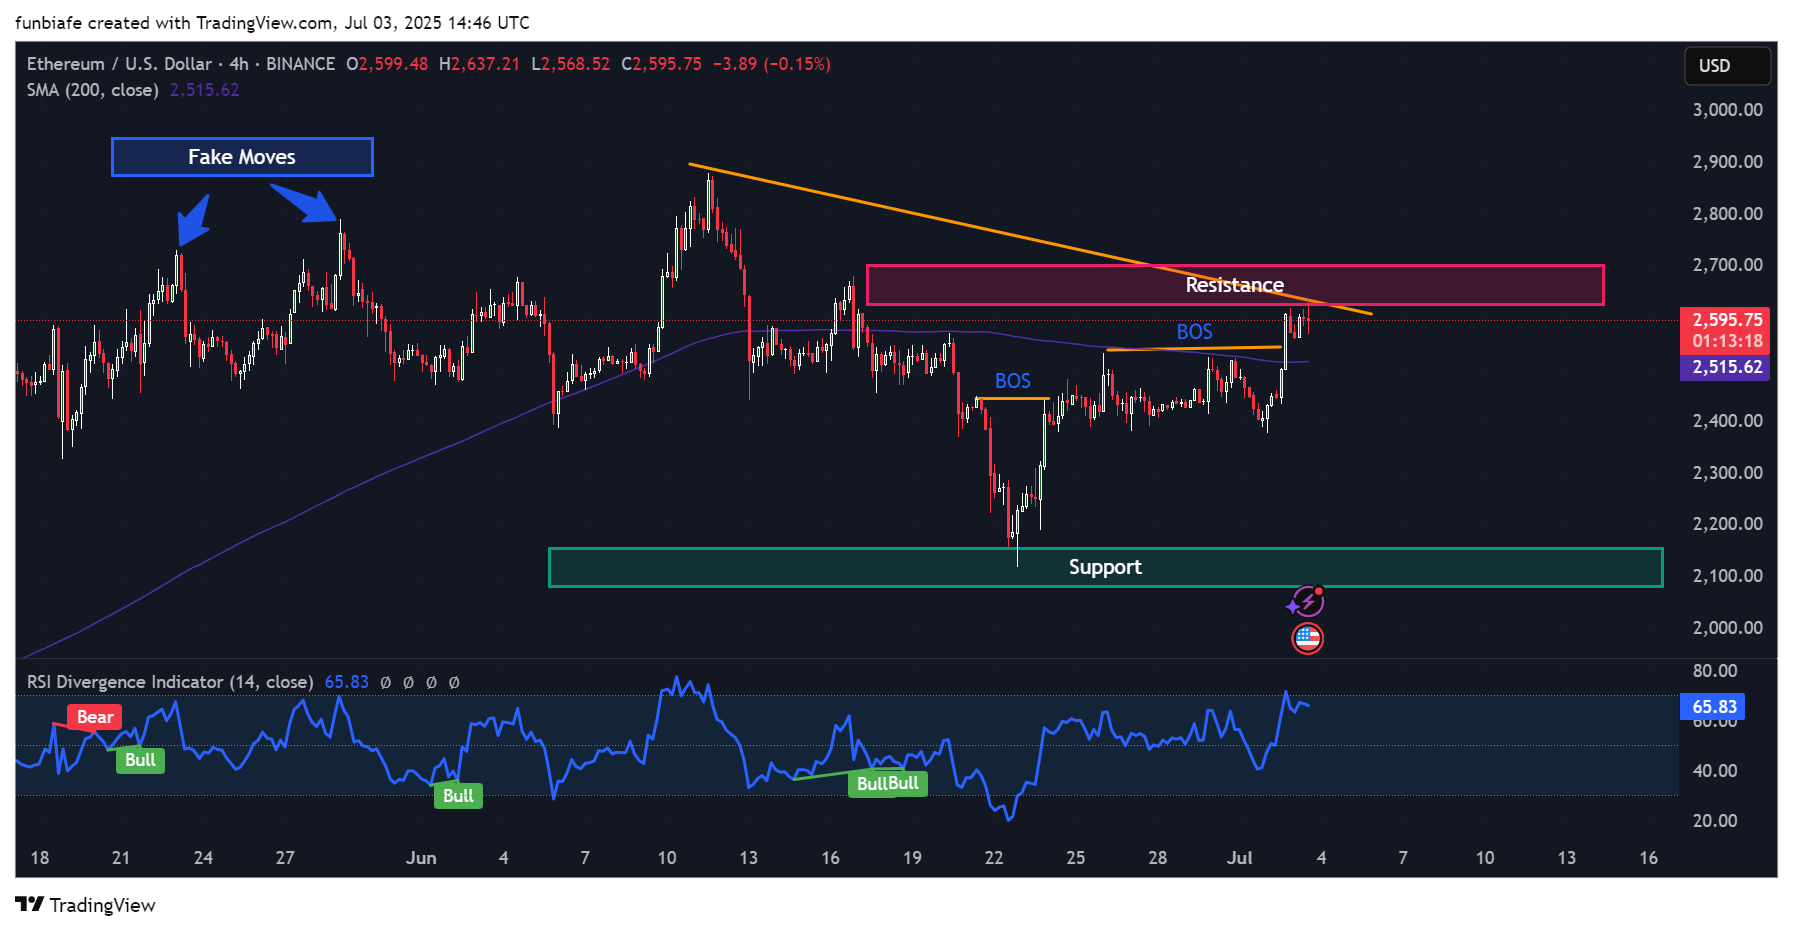
ETH 4h chart. Source: Tradingview
Ethereum price broke above the 200-day simple moving average (SMA) near $2,515 and reclaimed this technical level for the first time in weeks.
It’s also trading just beneath a horizontal resistance zone between $2,630 and $2,650, a key area where previous fakeouts have occurred.
On the 4-hour chart, ETH price remains above its 200 SMA ($2,515), with price action forming two confirmed bullish break-of-structure (BOS) points near $2,450 and $2,515.
These mark higher highs in the current uptrend, while it gives structure to the recent bullish breakout. RSI stands at 65.8, with it moving near overbought, which indicates momentum remains with the bulls, but a breather or pullback may ensue.
Support lies around $2,415, a bounce zone tested on July 1. Beneath that, the broader $2,070–$2,150 region remains a macro support level. Barring Ethereum’s price breaking $2,650, a pullback to $2,515 or even $2,450 remains in play.
Ethereum short-term outlook: Bullish structure but overhead risk
Ethereum remains in a structurally bullish phase. The price has reclaimed its 200-day SMA, broken out above key resistance zones, and shows upward trending RSI across both 4H and daily charts.
The ascending trendline from March lows remains intact, with higher lows and BOS levels continuing to support upward momentum.
The resistance zone right now is at $2,650–$2,700 has generated fakeouts in the past. A close above $2,700 would be confirmation of unveiling upside targets of approximately $2,800 and even $2,900. The traders need to watch this level closely for confirmation.
Should ETH’s price fail to clear this zone and pull back, the $2,515–$2,530 region offers the first support. A loss of the $2,450 BOS zone would indicate a weakening structure and could send the ETH price back to the $2,200–$2,250 area.
Momentum indicators like RSI indicate space for a momentary pause or retracement but no bearish divergence in the near term. ETH’s longer-term uptrend is intact until the 200-day SMA is breached again.
Ethereum’s next step will rely on its ability to break and sustain above $2,650 as deposit volumes ease. Meanwhile, the asset remains bullish but cautious in sentiment, supported by on-chain holding strength and institutional demand.
eToro: Best platform for beginners and social trading
- Trade cryptocurrencies, stocks, ETFs, and commodities on one easy-to-use platform
- Follow and copy top-performing traders with eToro’s unique social trading tools
- Earn passive income with staking on popular coins like ETH, ADA, and TRX
- Fully regulated in multiple jurisdictions with strong security protocols
- 0% commission on real stock trading and competitive spreads on crypto
- 30+ million registered users across 100+ countries
eToro is a multi-asset investment platform. The value of your investments may go up or down. Your capital is at risk. Don’t invest unless you’re prepared to lose all the money you invest. This is a high-risk investment and you should not expect to be protected if something goes wrong.
Source:: Price Analysis: Resistance Stalls at $2,650 – Will the $2,515 Support Hold?