Key highlights:
- Pi Coin price trades in a close range with resistance at approximately $0.50 and support at $0.44 with no sign of a verified breakout.
- Technical indicators like RSI and MACD reveal feeble bullish momentum, with price still stuck in a long-term downtrend.
- Pi Coin remains in a lengthy accumulation phase with multiple failed breakout attempts and no solid catalysts to push it higher.
Pi Coin is showing signs of stabilizing, with price currently hovering around $0.448 after a failed breakout earlier this month.
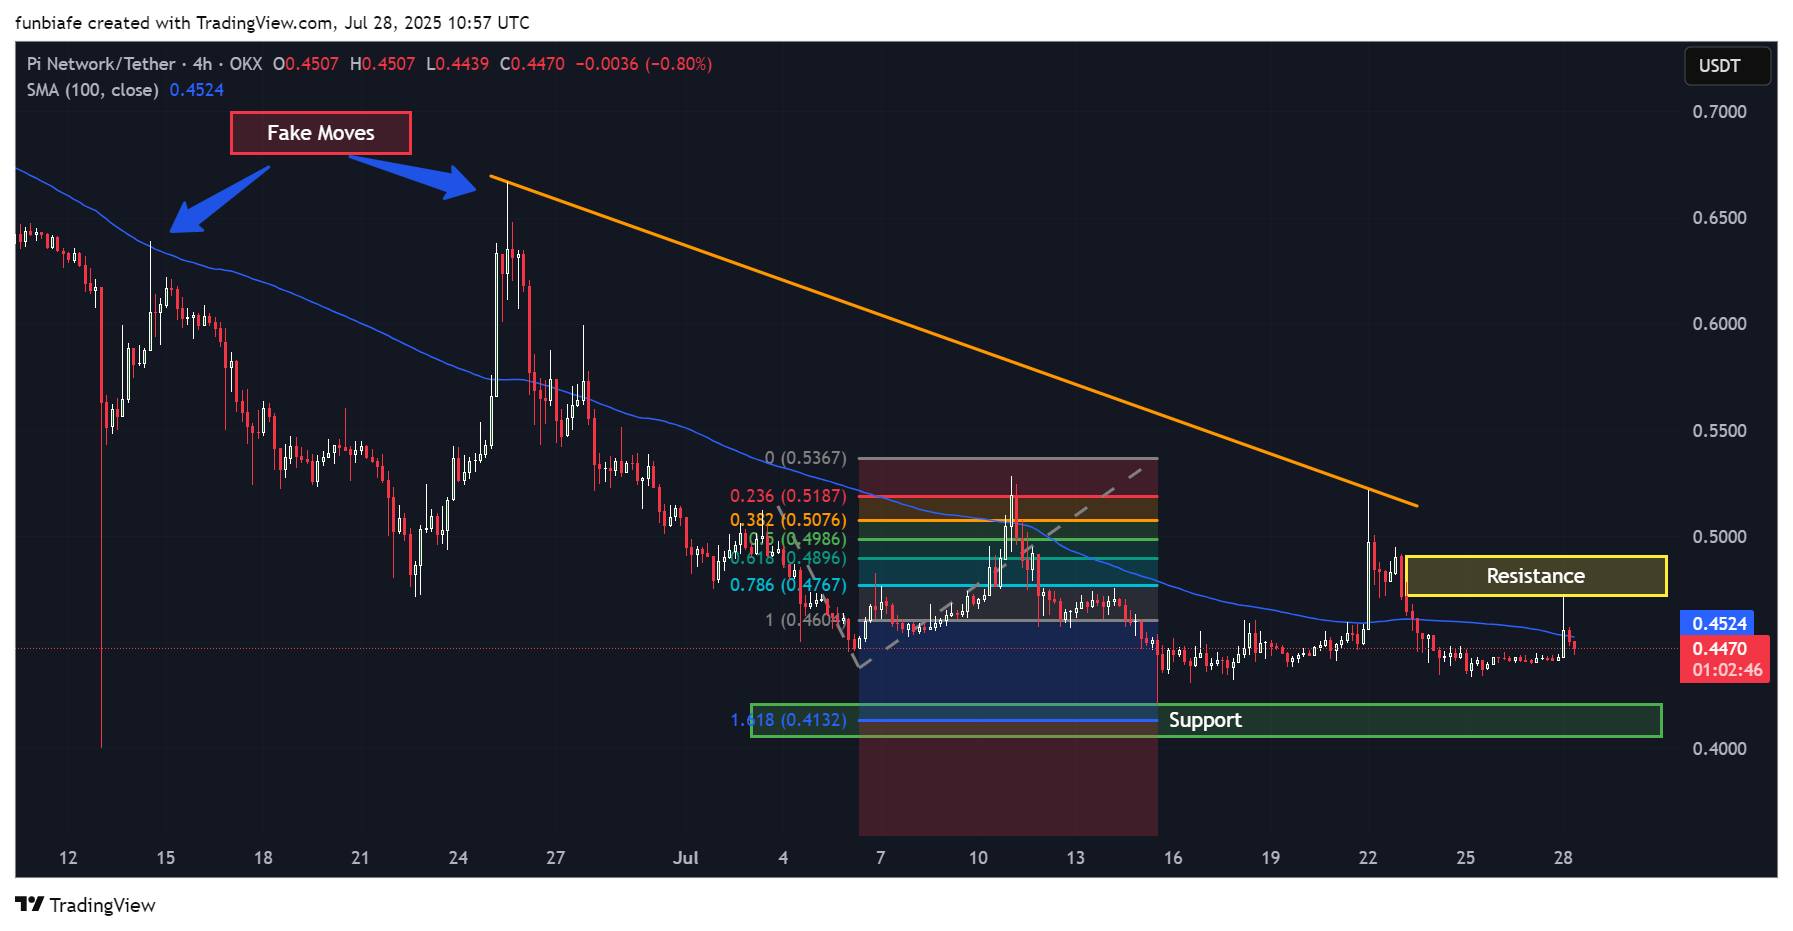
Pi Coin price attempted to push above $0.49 but met strong resistance, triggering a sharp pullback. It has since been trading within a tight consolidation zone, with support forming near $0.44.
A tweet from a Pi supporter speculated about a possible rally to $10. However, based on the technicals and Glassnode data, such a surge appears unsupported for now.
Major resistance blocks Pi Coin breakout attempts
The $0.49–$0.50 zone has now established itself as strong resistance. It coincides with a previously broken structure and is reinforced by the 50-day and 100-day simple moving averages. Multiple attempts to close above this level have failed, producing what appears to be bull traps.
Fibonacci retracement levels from $0.5367 to $0.4607 show Pi Coin price has struggled at both the 0.236 and 0.382 levels, at $0.5187 and $0.5076, respectively. The lack of a clear move toward the 0.5 or 0.618 retracements confirms weak buying pressure.
Pi Coin 4h chart. Source: Tradingview
The descending orange trendline drawn from earlier local highs has acted as dynamic resistance. Each rejection reinforces the bearish structure, with lower highs forming consistently. Without a break above this trendline, bulls remain in a weak position.
The broader market also lacks a catalyst that could push Pi through this resistance range. No meaningful listing on exchanges, ecosystem upgrades, or token unlocks have occurred, with technicals remaining the primary market driver.
Additionally, ongoing slowness in user onboarding and developer engagement in the Pi Network ecosystem helps to perpetuate the bearish sentiment. Without actual utility for the token or visible growth in usage metrics, investors remain skeptical.
Tweet speculation vs technical structure
The $10 target proposed in the tweet implies a gain of over 22x from current levels. For this to occur, Pi’s market cap would need to increase by tens of billions of dollars, something that is not reflected in current trendlines, volume, or listings.
Pi Coin price has yet to break above $0.50. Until it clears this resistance and confirms new highs with volume, any bullish targets above $1 remain speculative.
No patterns on the Pi chart, such as, inverse head and shoulders, or triangles of ascending formation, validate a quick breakout to $10 level here. Whatever movement of that magnitude would require not only technical confirmation but also strong fundamentals, such as growing adoption or growth in the ecosystem.
Fundamentally, Pi remains in limbo, with many early adopters awaiting official mainnet token issuance. Until then, real price discovery is hampered by the limited and unofficial nature of its current trading markets.
Pi Coin support zones still holding, but fragile
Despite multiple retests, Pi price support between $0.40 and $0.42 continues to hold. Buyers have consistently stepped in around this area, preventing further decline. However, failure to reclaim higher levels could lead to a breakdown toward $0.35.
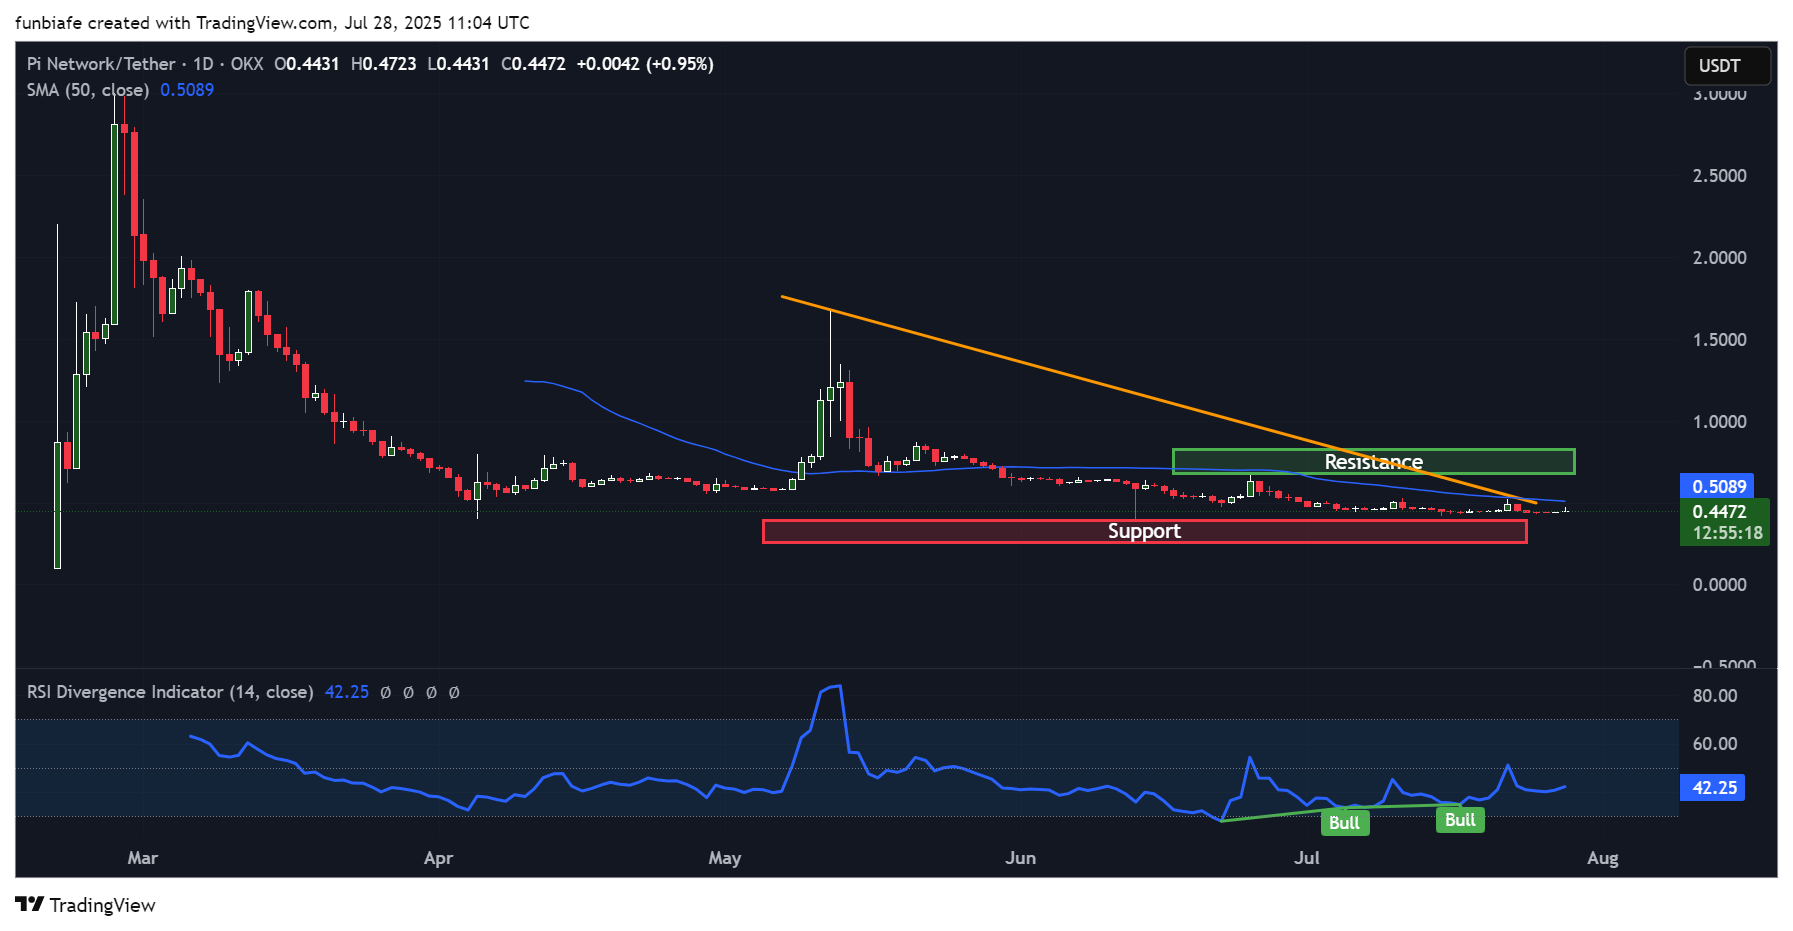
Pi Coin daily chart. Source: Tradingview
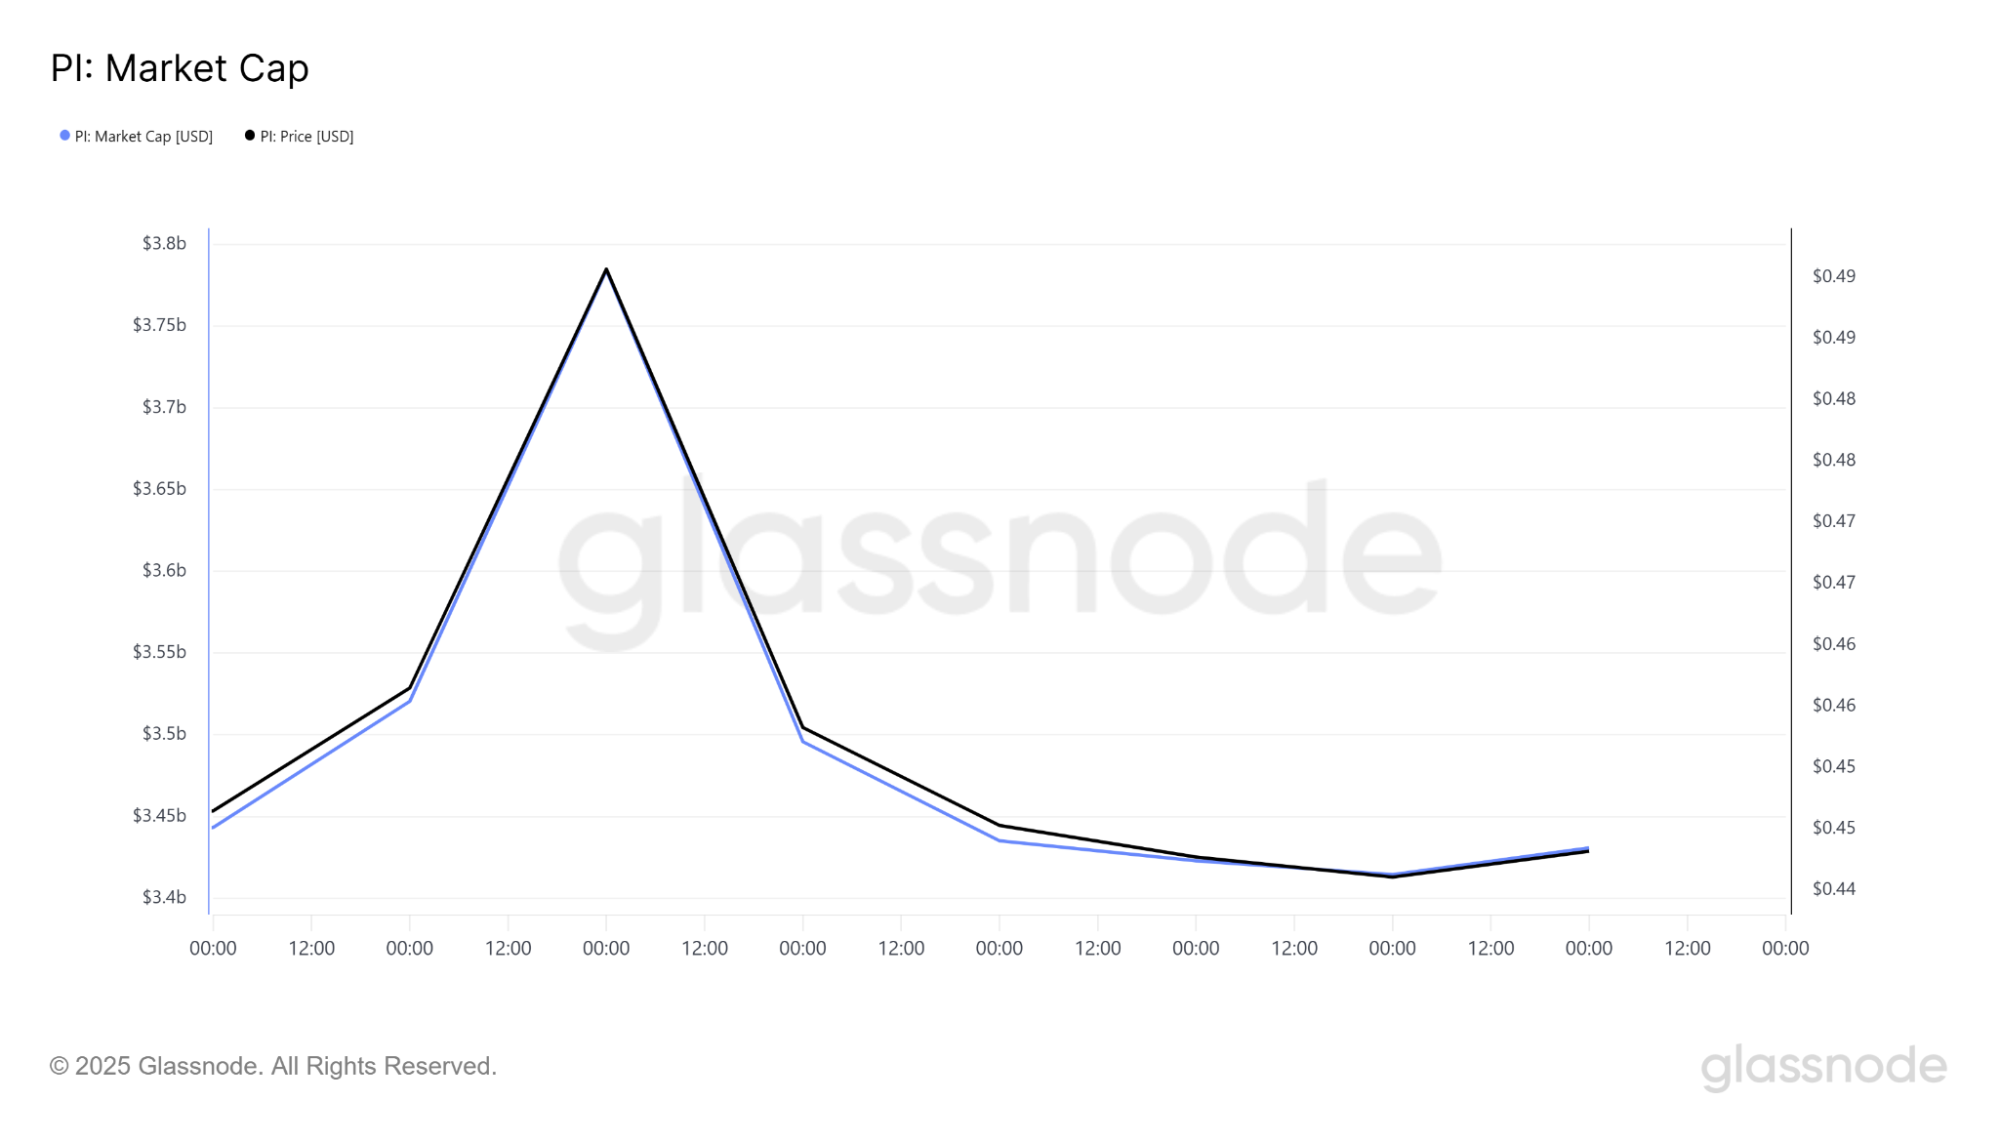
The lower boundary of the current consolidation aligns with a market cap zone near $3.44 billion. This support has held up over the last few weeks but remains vulnerable without renewed interest or trading volume.
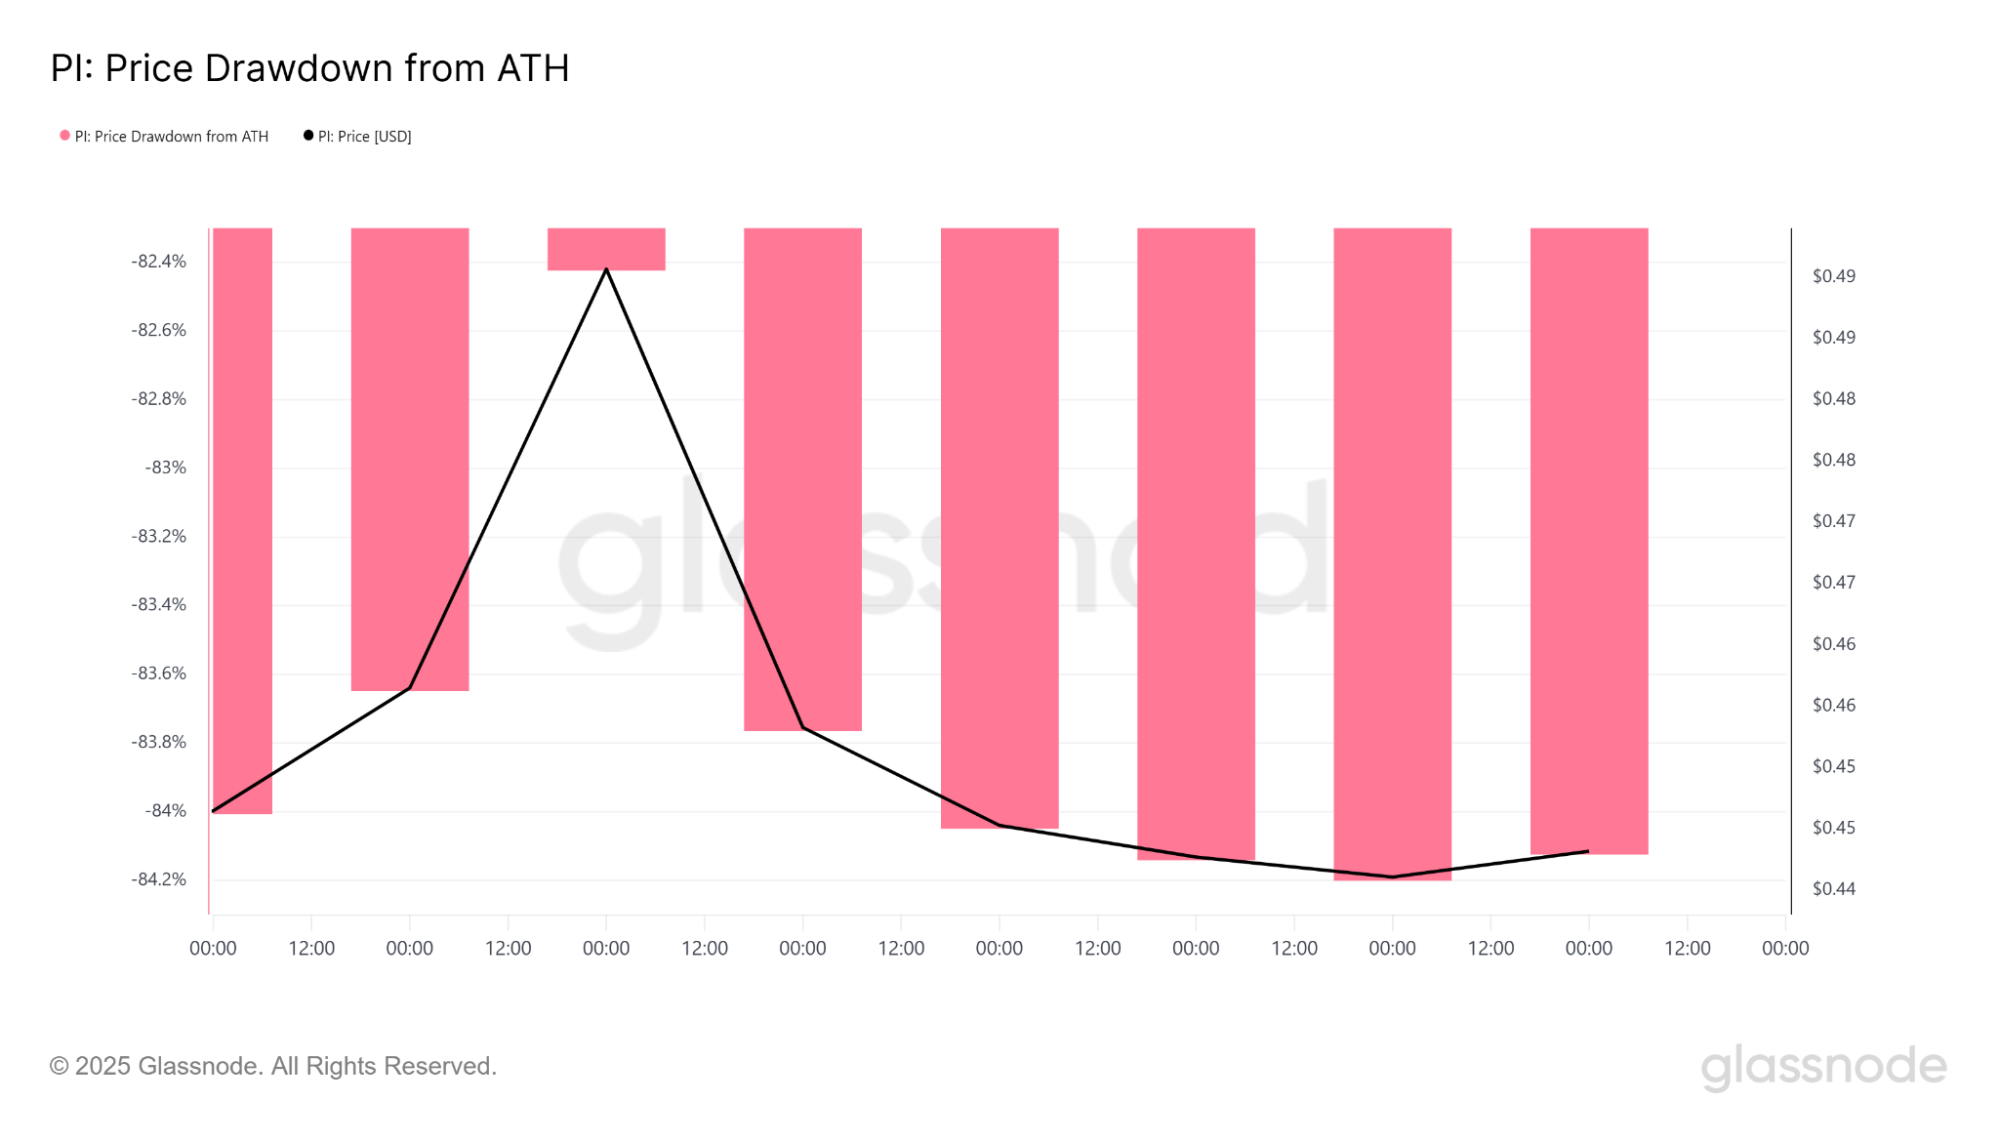
The broader price drawdown still sits at around -84% from the Pi price all-time high, and while the range is narrowing, no structural breakout has followed. The pink bar drawdown chart confirms this persistent weakness, showing no lasting recovery since the decline began.
The MACD and volume indicators also show a lack of bullish pressure. While some green bars have appeared, they have not accompanied breakout candles, indicating weak confirmation.
Pi Coin price chart shows sideways movement, bearish bias remains
After launching at above $2.98 and crashing to $0.40, Pi has entered a prolonged consolidation phase. The current weekly Pi Coin chart shows the price moving sideways between $0.40 and $0.48, with declining volume and little bullish momentum.
The 7-week moving average sits at $0.4734, just above the current price. Pi Coin price continues to stay below this level, and the trend remains bearish-neutral until the bulls take it back.
There is a bullish divergence in the RSI indicator, but the signal is not supplemented by price action. RSI is moving around 69.5, at levels close to being overbought, but the price is unable to break out. This is a sign that the indicator is lagging and may not reflect the current strength of the trend.
The market is still in what technical analysts consider an “accumulation zone.” Multiple weekly candles have printed tight bodies with long wicks, showing indecision among traders. Without an increase in volume, this zone may continue for several more weeks.
It’s also notable that volume trading in Pi price is largely limited to off-exchange or over-the-counter markets, something that is a source of its thin volume and lack of price stability.
Short-Term outlook: $0.50 resistance key to reversal
Pi Coin remains locked in a bearish structure, with strong resistance at $0.50 and soft support at $0.44. The pattern is one of weak momentum, frequent failed breakouts, and thin trading volume.
A close over $0.50 with strong volume could trigger a short-term bounce to $0.60. But until the bulls reoccupy this level, the current structure is biased towards consolidation or a decline.
Traders watching Pi should keep an eye on the $0.44 support and the $0.50 resistance. A confirmed break above these levels needs to happen before any wider bullish or bearish movement can occur. Until then, the outlook is neutral with a bearish bias.
eToro: Best platform for beginners and social trading
- Trade cryptocurrencies, stocks, ETFs, and commodities on one easy-to-use platform
- Follow and copy top-performing traders with eToro’s unique social trading tools
- Earn passive income with staking on popular coins like ETH, ADA, and TRX
- Fully regulated in multiple jurisdictions with strong security protocols
- 0% commission on real stock trading and competitive spreads on crypto
- 30+ million registered users across 100+ countries
eToro is a multi-asset investment platform. The value of your investments may go up or down. Your capital is at risk. Don’t invest unless you’re prepared to lose all the money you invest. This is a high-risk investment and you should not expect to be protected if something goes wrong.
Source:: Pi Coin Price Analysis: Is $10 a Realistic Target For PI?