Key highlights:
- KAS price is closing in on the $0.10 resistance level, with higher highs and higher lows reflecting bullish pressure within a declining wedge.
- Major support areas of $0.093 and $0.086-$0.090 are still crucial for the bulls to sustain the momentum.
- A breakout above $0.115-$0.120 can lead to a rally to $0.15.
Kaspa market activity is generating interest as the price consolidates close to a strong resistance zone, with traders assessing the potential for a breakout. At the time of writing, the KAS price is at $0.099937, higher than long-term support and testing the $0.10 level.
Several charting websites, such as TradingView and Glassnode, show tightening technical conditions as market data leans towards buyers, with momentum gradually favoring them. On-chain metrics reflect circulating supply stability, and market cap trends are consistent with price movement trends.
Kaspa market cap, supply data, and on-chain signals
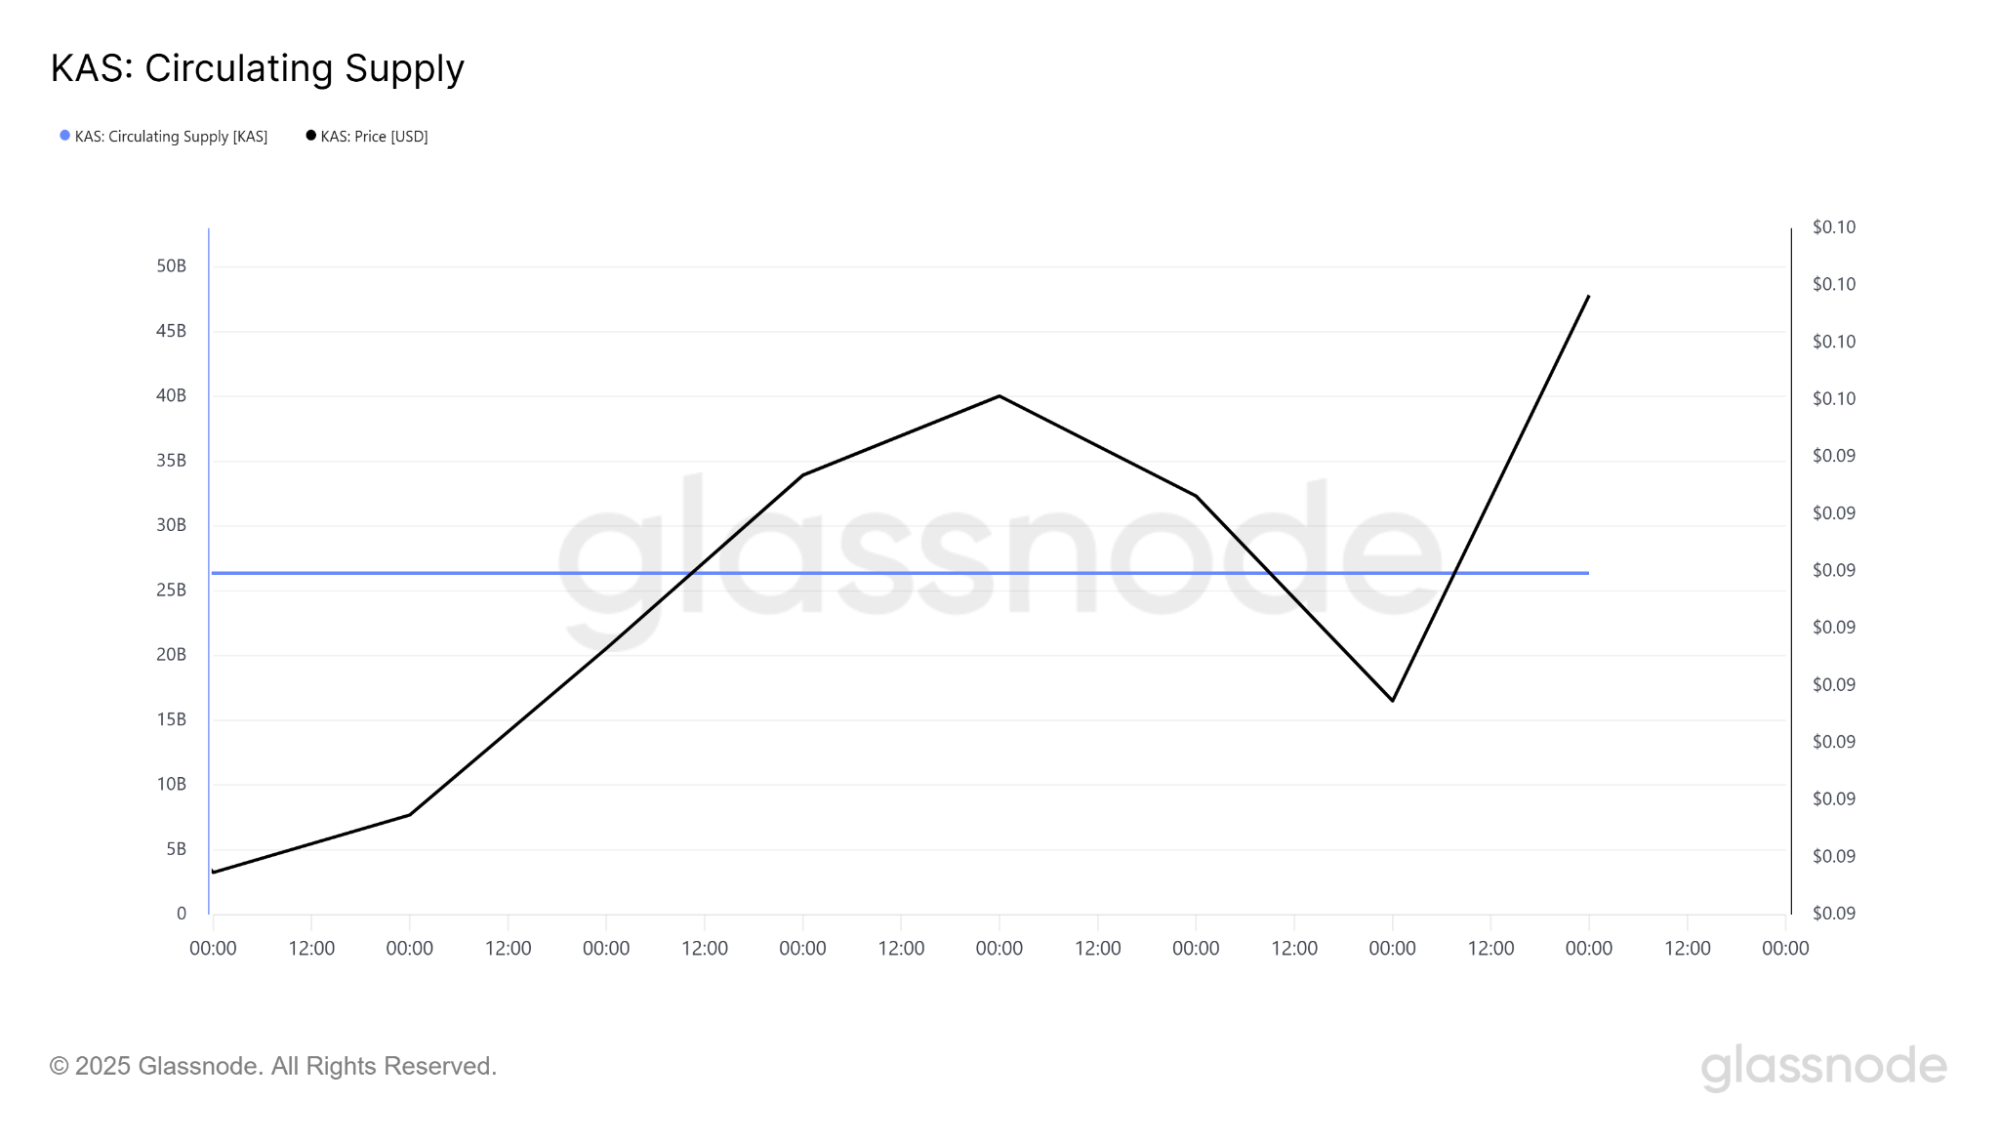
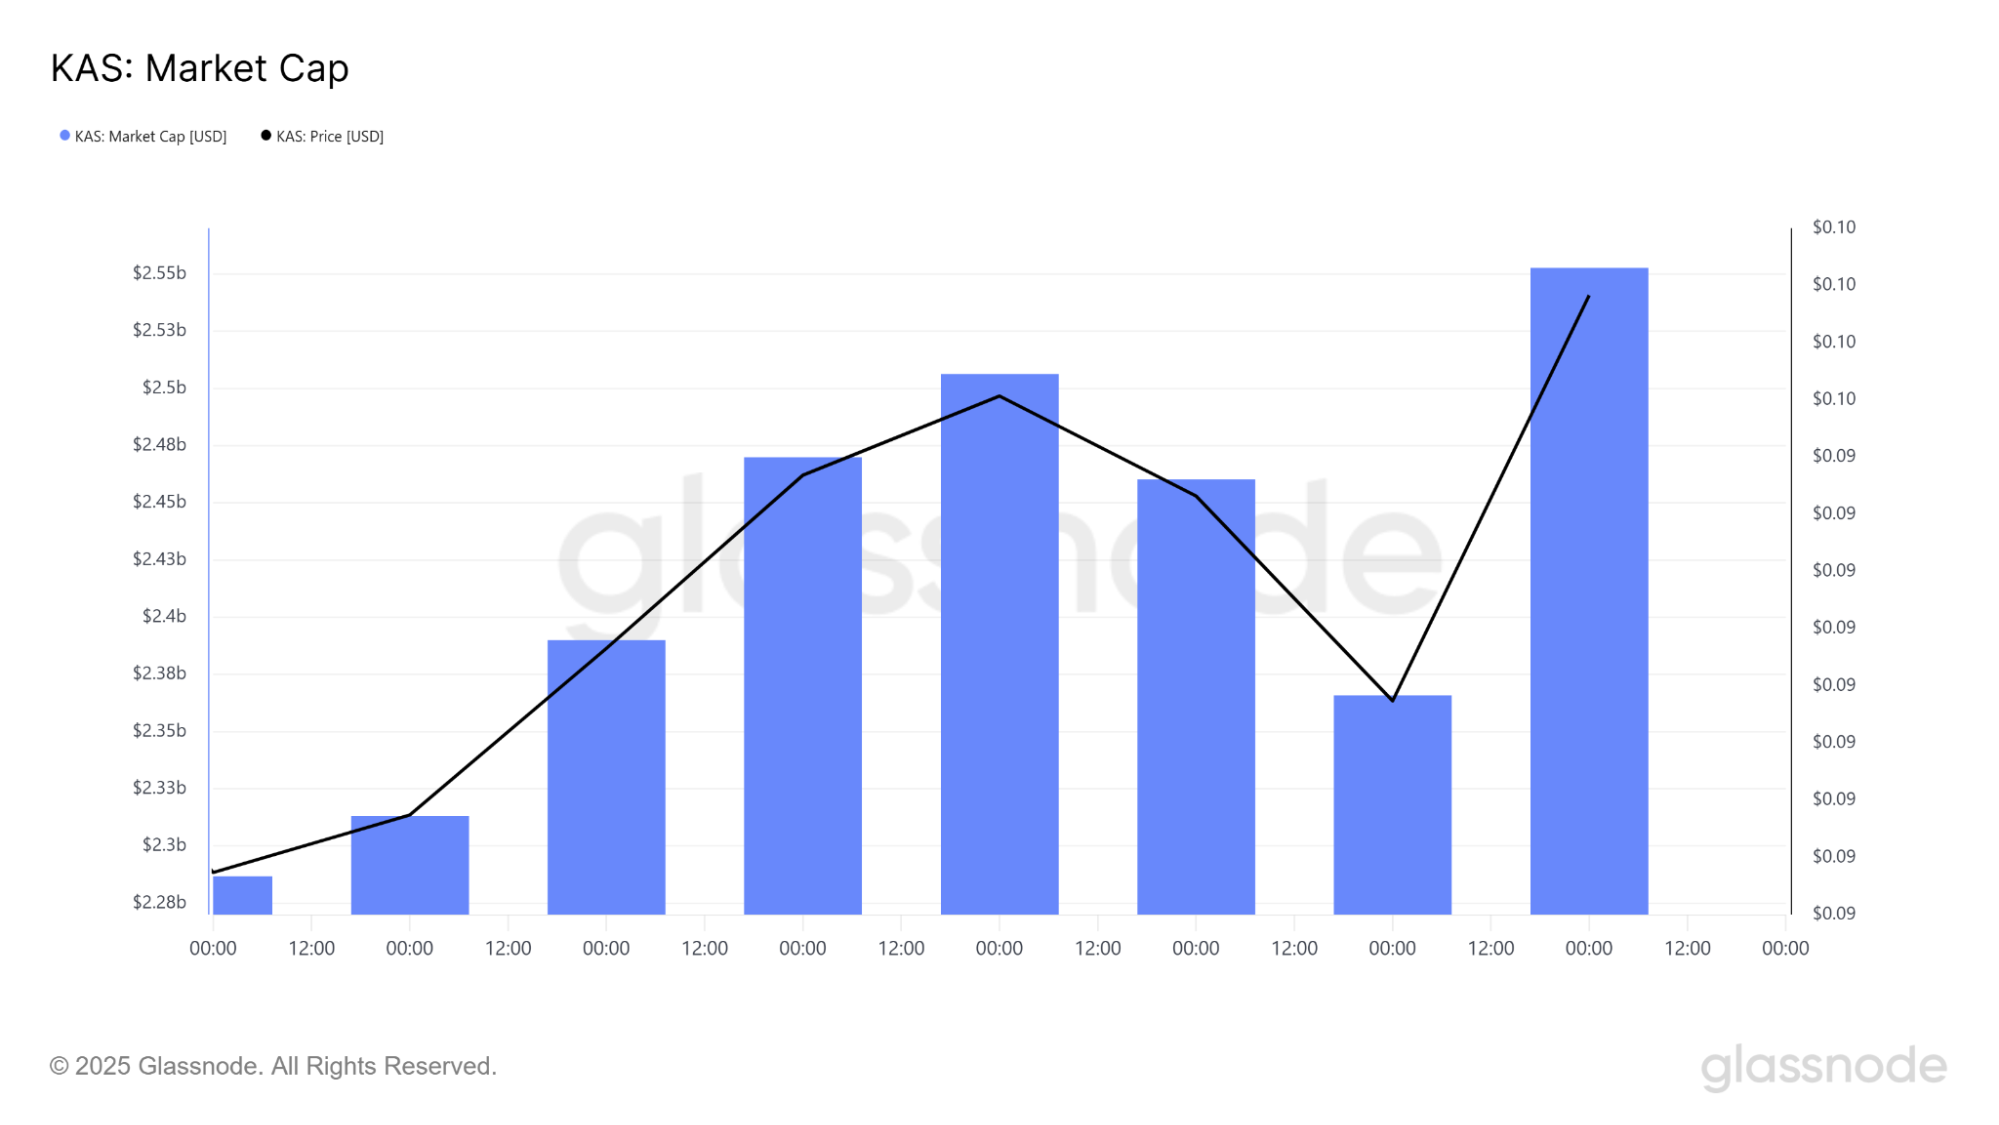
Glassnode market cap data confirms that recent price action has pushed valuations from around $2.37B to approximately $2.55B, with KAS price tracking closely to market cap movements due to the flat circulating supply of around 26 billion KAS. This supply stability means price gains are driven purely by market demand rather than changes in token issuance.
Support in market cap terms lies between $2.34B and $2.38B, equivalent to $0.090–$0.092. Resistance is seen at $2.50B–$2.55B ($0.096–$0.100+) and $2.60B ($0.10+).
A break and hold above $2.55B–$2.60B would align with a price breakout above $0.10 and could allow room toward $2.70B–$2.80B in market cap, mapping to $0.104–$0.108 if supply remains constant.
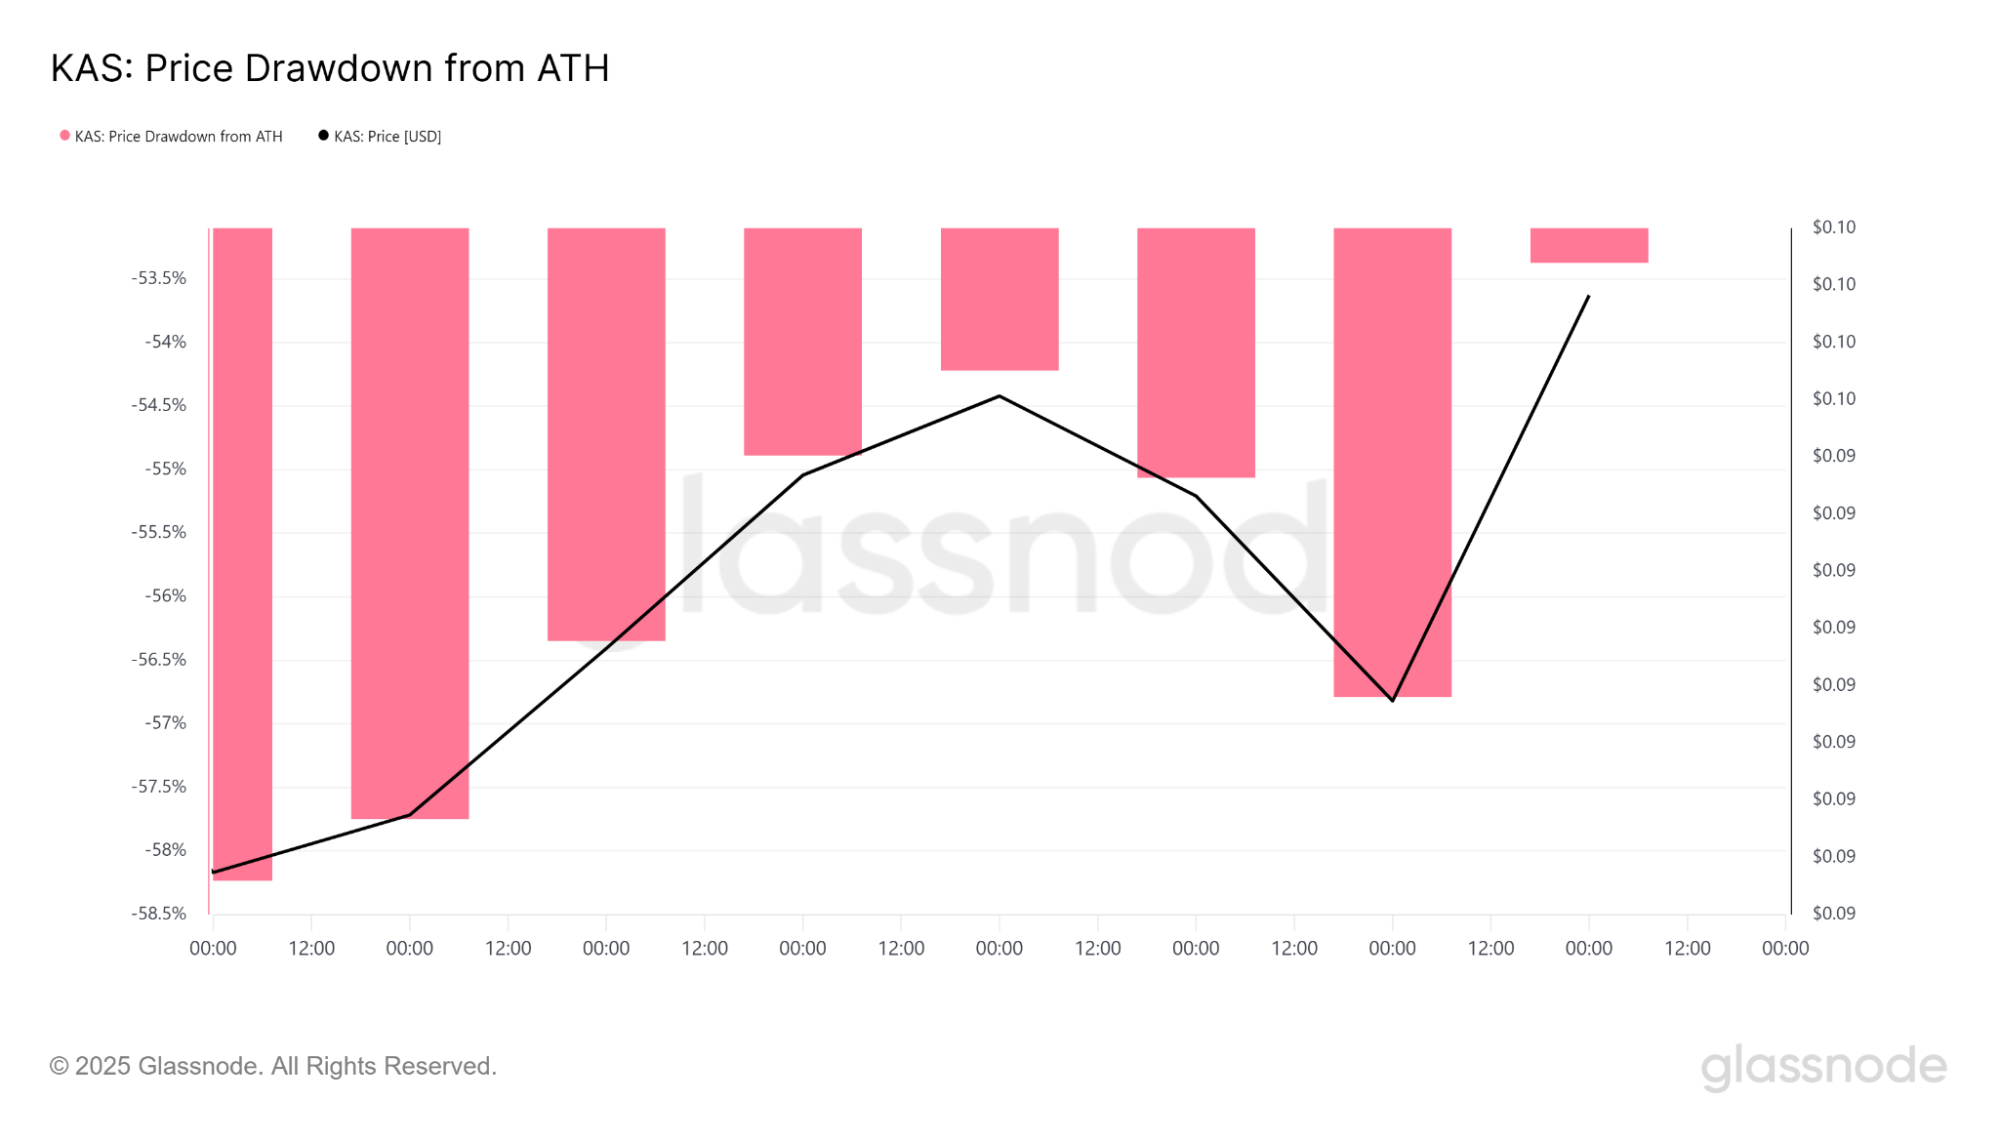
Drawdown analysis from all-time highs shows KAS price has moved from -58% to -53.5% in recent sessions, marking its strongest recovery level on this chart. Historically, -53.5% to -54% has acted as a stalling area, matching the $0.100–$0.105 resistance range.
Kaspa technical structure and trend patterns
The daily KAS chart shows it is trading within a broad contracting range. The descending resistance, positioned between $0.115 and $0.123, has capped upward moves for several weeks, while a rising trendline from mid-July, currently near $0.086–$0.087, continues to lift higher lows.
Kaspa Price action has rebounded from the rising trendline and reclaimed the 200-day SMA, located near $0.0887, which now serves as an immediate layer of support. The higher low formed on this rebound maintains the short-term upswing structure.
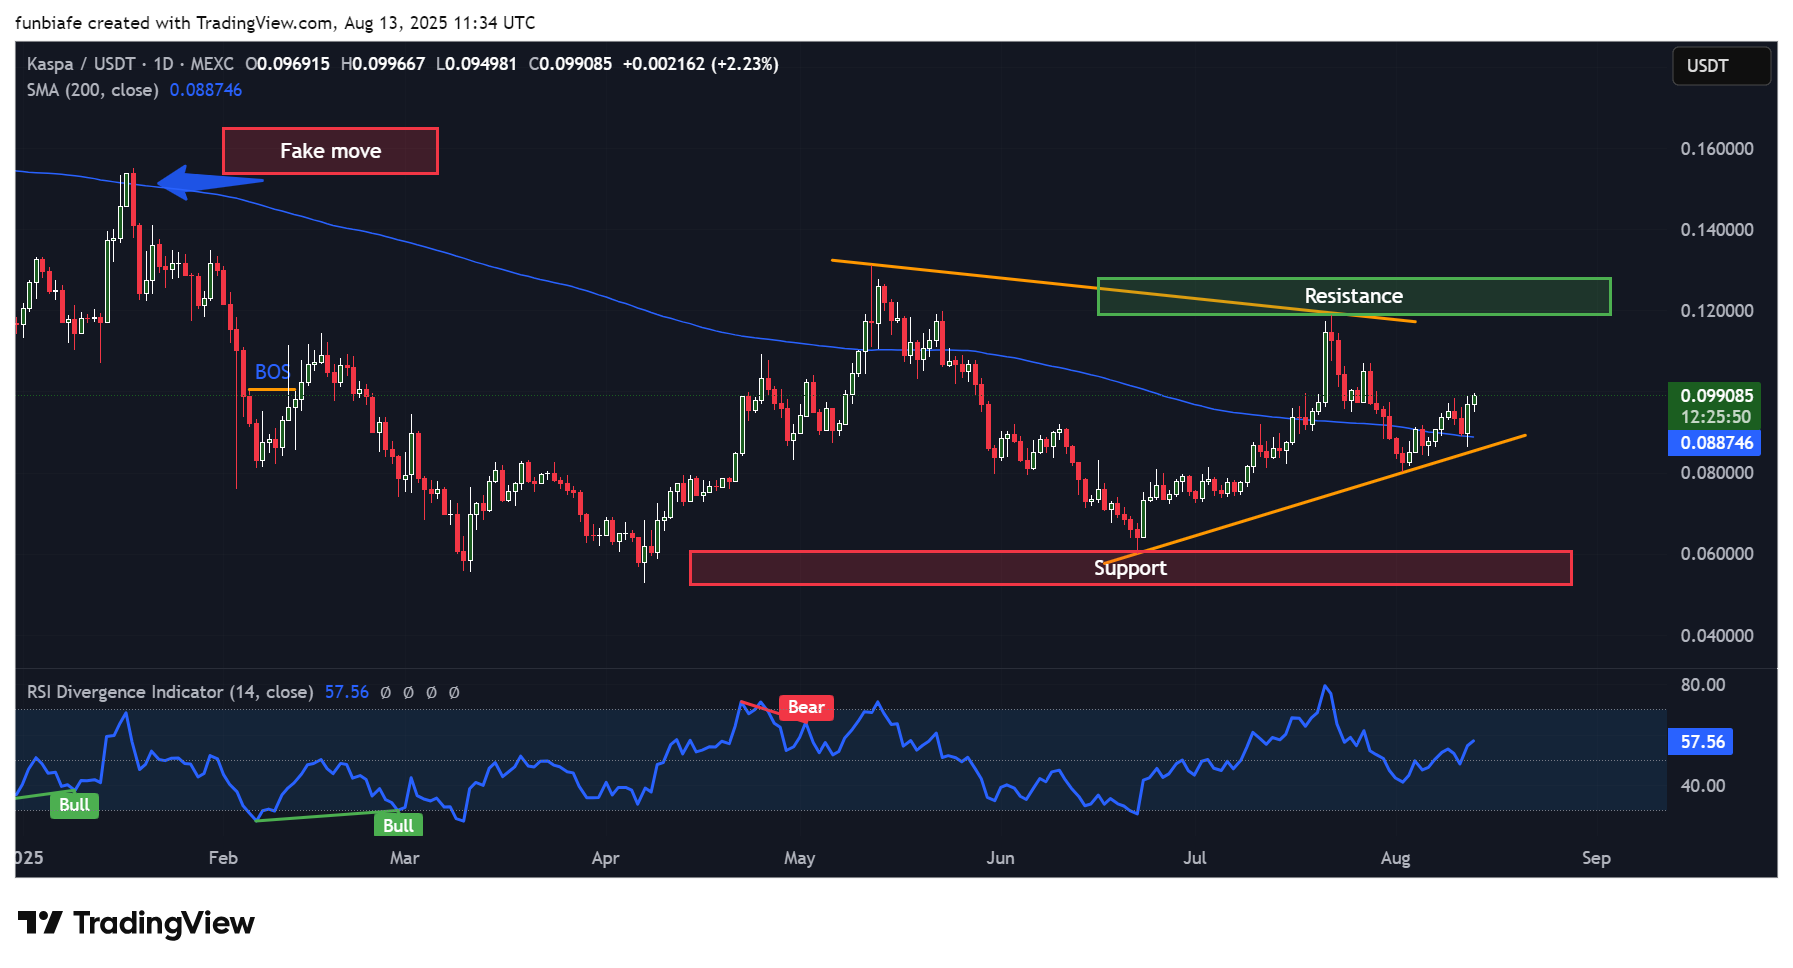
Kaspa daily chart. Source: Tradingview
Resistance is concentrated at $0.100–$0.102, with further supply zones at $0.108–$0.112 and the wedge top at $0.115–$0.123. A confirmed breakout through this upper boundary could open price targets at $0.128–$0.130 and later $0.14–$0.15.
KAS support, resistance, and market data
The near-term support is between $0.089 and $0.090, closely tracking the 200-day SMA and recent daily closes. The uptrend trendline provides additional technical support at $0.086–$0.087, and $0.080 is the previous pivot low.
On the upside, $0.100–$0.105 is the short-term breakout point, which coincides with the round-number level, Fibonacci resistance, and trendline pressure.
Further beyond that, $0.107–$0.110 and $0.113–$0.114 are the next objectives before hitting $0.118–$0.120 and the wedge top. A decisive day-close above $0.115–$0.123 would be evidence of a structural breakout, with support from a measured move projection to $0.15–$0.16.
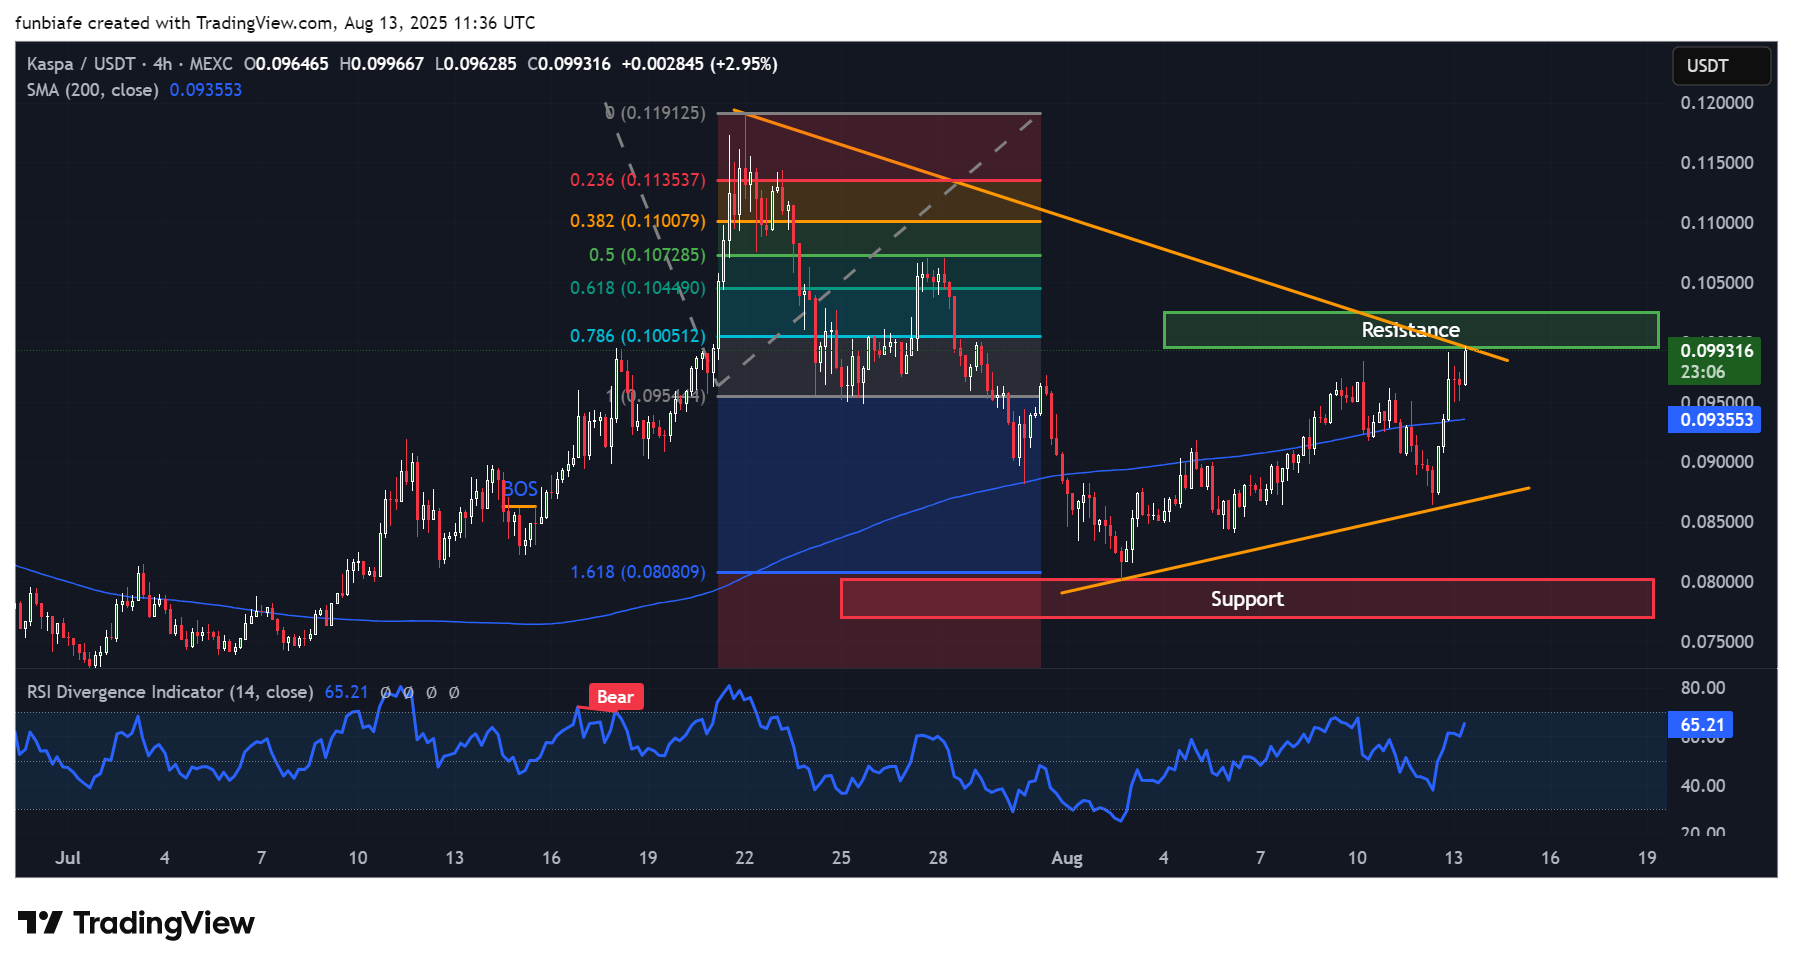
Kaspa 4h chart. Source: Tradingview
The four-hour chart corroborates the bullish bias. Since the $0.119 peak, KAS price has created lower highs under a descending trendline but found a base near $0.0808 before reversing.
The rising intraday trendline of $0.086–$0.087 still holds, with dynamic support at $0.0936 being 200-SMA (4H). Fibonacci retracements of the $0.119–$0.081 movement reflect stacked resistance, with 0.786 at $0.1005 being the first heavy confluence level.
Indicators and momentum outlook for Kaspa
The daily RSI of around 57.6 shows bullish strength without the burden of being overbought. Past bullish divergences in February and March resulted in rallies, and in May, the recent major drop was signaled by the bearish divergence.
Currently, RSI is trending higher in line with KAS price, without divergence signals. On the four-hour chart, RSI is near 65, entering higher momentum territory but still under extreme readings.
I’m Bullish on $KAS. pic.twitter.com/inEKNNegTl
— LordKuba 𐤊 (@Lord_Kuba) August 12, 2025
Bollinger Bands on the daily KAS chart show price riding the upper half, with the bands re-expanding after a period of compression. If price begins “walking the band,” sustained momentum could follow. Volume remains steady but has yet to produce a breakout-level surge.
The “I’m Bullish on $KAS” tweet from Lord Kuba aligns with the current technical posture, higher lows, RSI crossover, and price above the 20-SMA, but the chart still requires a clean break of the wedge top for confirmation.
Breakout or rejection: What’s next for KAS?
Kaspa price action is moving towards a decision moment as it tests the $0.10 level, supported by a rising trendline, flat on-chain supply figures, and improving market cap figures.
While technical and on-chain data favor the bulls, the $0.115-$0.123 level remains the key resistance level that needs to be broken for a confirmed breakout. The traders will be watching both the $0.10 level and the top wedge boundary for indications that the next surge might be near.
eToro: Best platform for beginners and social trading
- Trade cryptocurrencies, stocks, ETFs, and commodities on one easy-to-use platform
- Follow and copy top-performing traders with eToro’s unique social trading tools
- Earn passive income with staking on popular coins like ETH, ADA, and TRX
- Fully regulated in multiple jurisdictions with strong security protocols
- 0% commission on real stock trading and competitive spreads on crypto
- 30+ million registered users across 100+ countries
eToro is a multi-asset investment platform. The value of your investments may go up or down. Your capital is at risk. Don’t invest unless you’re prepared to lose all the money you invest. This is a high-risk investment and you should not expect to be protected if something goes wrong.
Source:: KASPA (KAS) Price Analysis: Will These Key Levels Spark the Next Surge?