Key highlights:
- The ICP price is right up against a long-term trendline that has rejected every rally for months.
- Momentum on the 4-hour chart is picking up, and price is holding above key moving averages.
- If this breakout sticks, higher levels come into play. If not, the broader downtrend stays in control.
Internet Computer is waking up, and it’s doing it at a pretty critical moment. Over the past 24 hours, ICP has climbed 6.55% to around $2.57, clearly outperforming a broader market that hasn’t done much.
The ICP price is pressing directly into a long-term descending trendline that has capped rallies for months. And as World Of Charts pointed out, if this level finally breaks, the upside could be far larger than this initial bounce.
Is the 2x rally idea realistic?
World Of Charts mentioned that a confirmed breakout above the descending trendline could lead to a 2x rally. Is that realistic? Technically, yes, but only if key conditions are met.
First, the ICP price needs a confirmed daily close above the descending trendline. Not a quick wick. A sustained break. Second, the $2.70 zone must flip from resistance into support. That level has rejected price multiple times. If both of those conditions are satisfied, the $3.80–$4.50 range becomes a logical upside target.
$Icp #Icp Approaching Towards Trend Line, After Successful Breakout It Can Give More Than 2x Rally pic.twitter.com/7bTR4OS1JL
— World Of Charts (@WorldOfCharts1) February 27, 2026
From current levels near $2.57, that already puts a near 2x move on the table. Anything beyond that would likely require broader market strength and a stronger altcoin rotation. For now, the breakout is in progress. It isn’t fully confirmed.
ICP market cap and drawdown: The bigger context
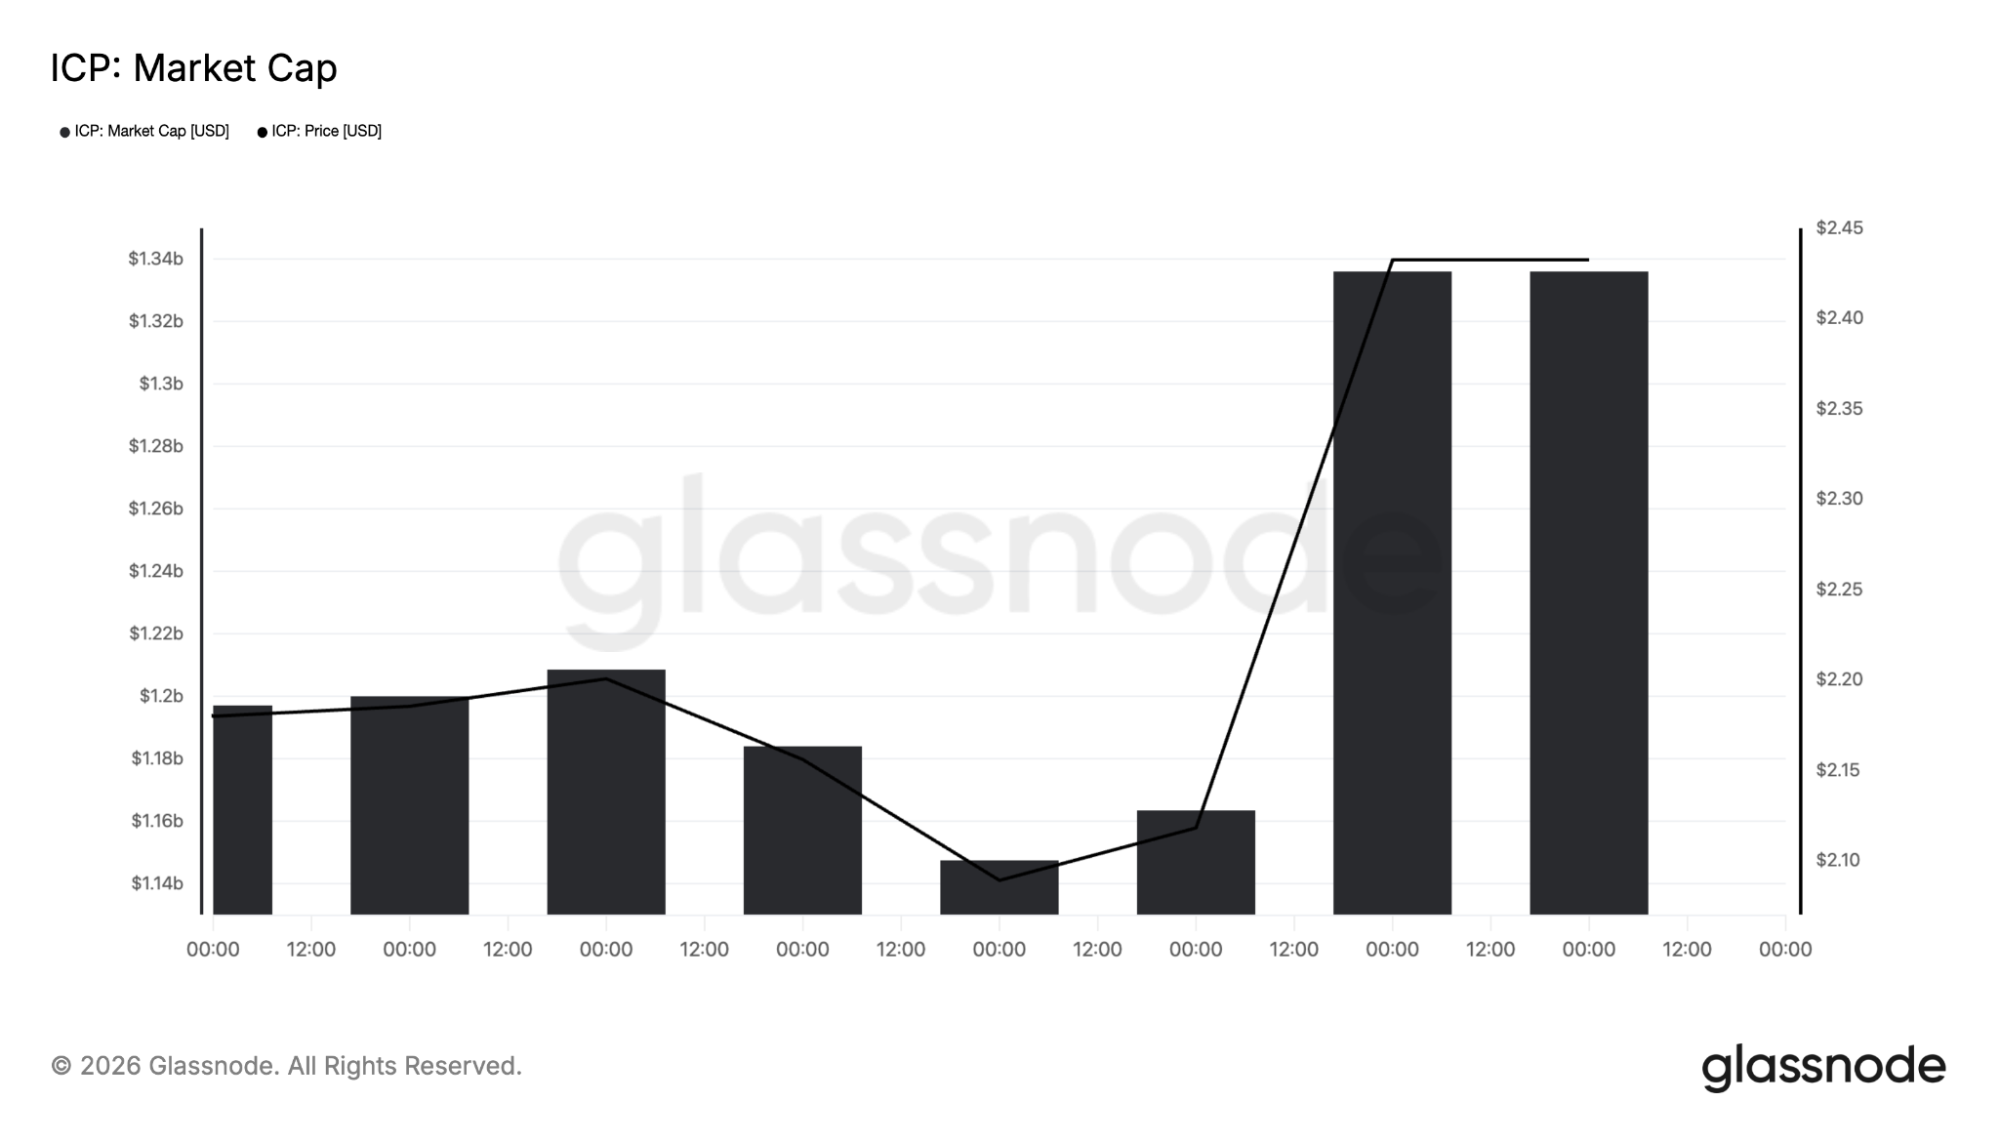
The on-chain data from Glassnode adds another layer to this setup. ICP’s market cap has rebounded toward $1.34 billion after dipping closer to $1.14 billion earlier in February. That’s a noticeable recovery in a short time. Capital is flowing back in, even without a clear coin-specific catalyst.
At the same time, the ICP drawdown chart shows just how much damage has already been done. The ICP price is still down more than 98% from its all-time high. That’s extreme compression.
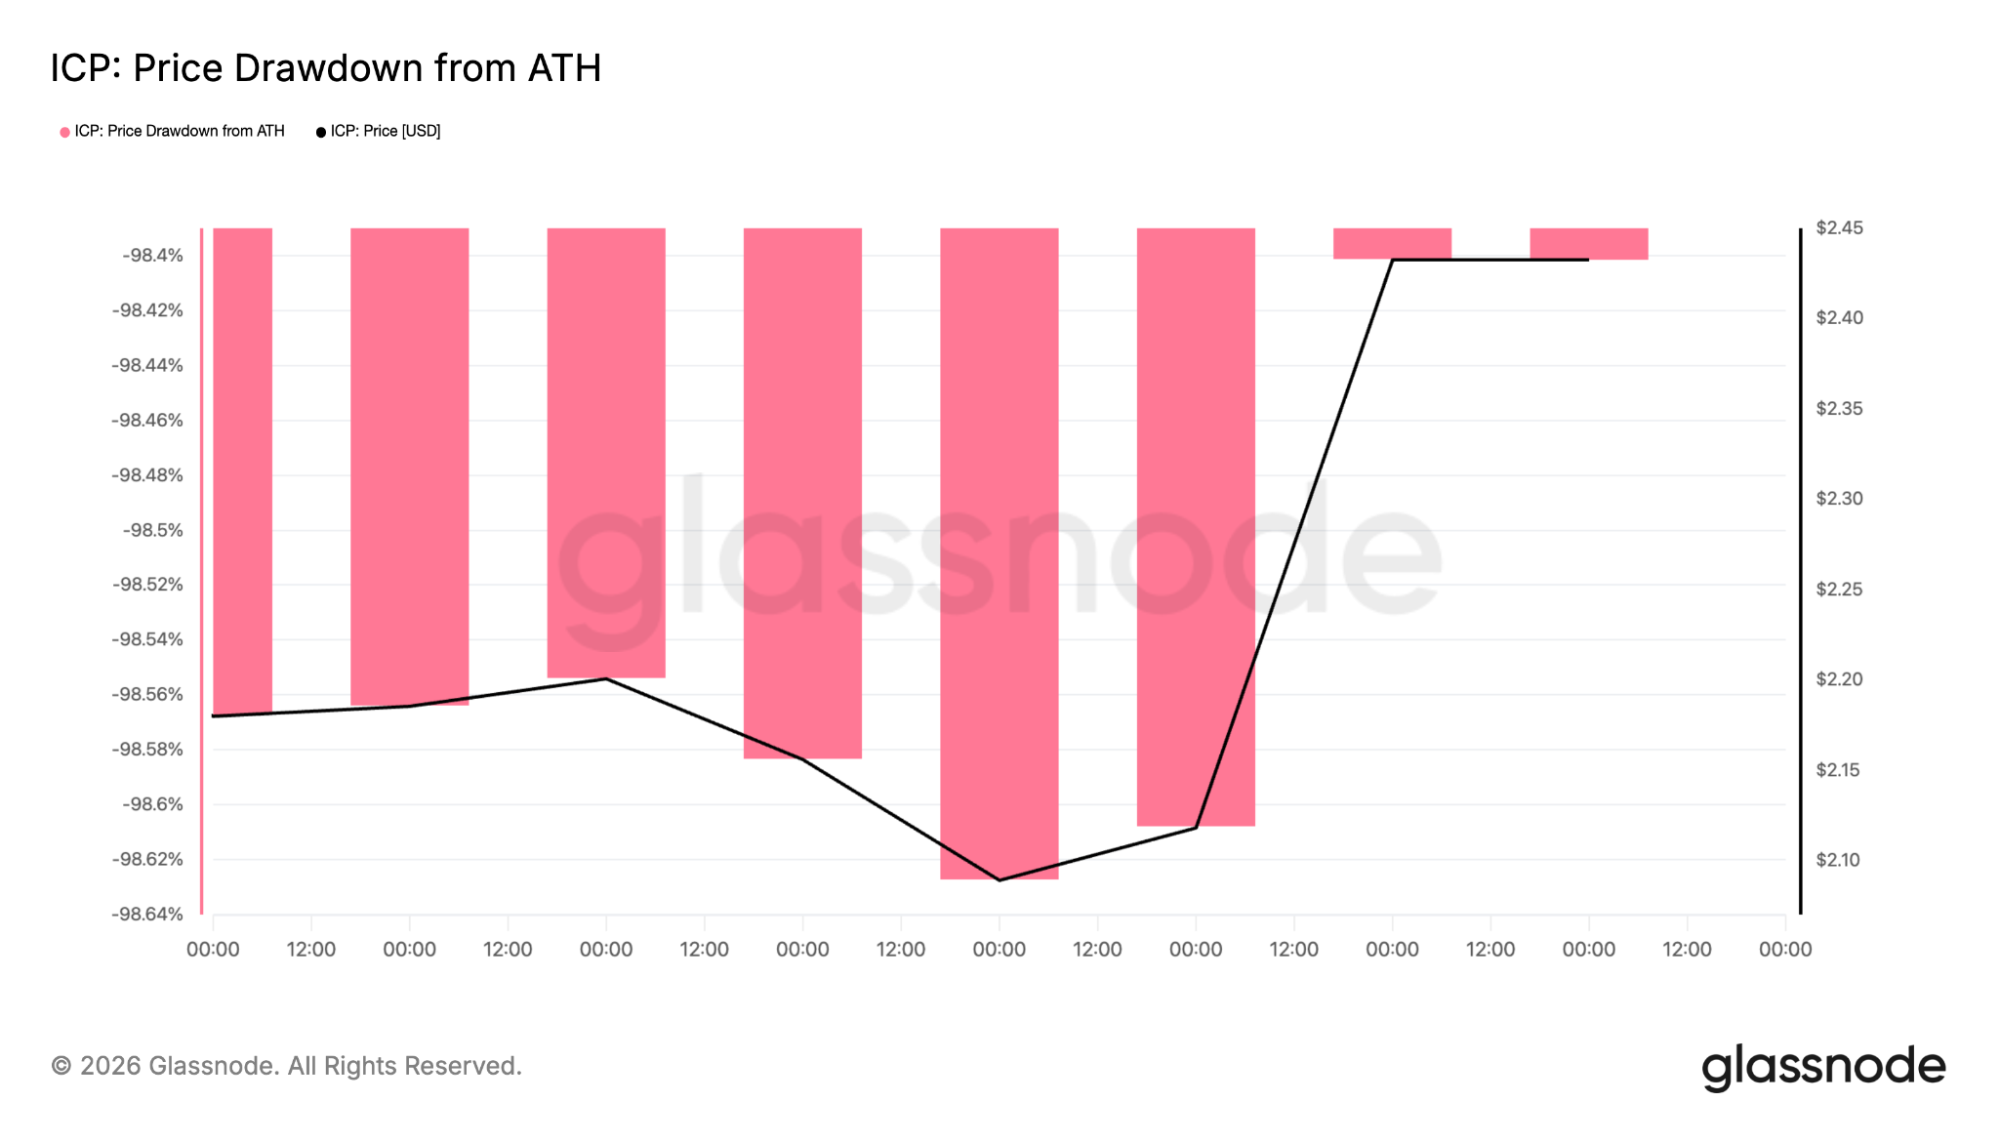
Deep drawdowns create overhead supply, yes. But they also create asymmetric setups. When an asset has been crushed for that long, a confirmed structural breakout can produce outsized moves.
The ICP daily chart: A downtrend meets its first real test
On the daily chart, ICP has been moving lower ever since the spike up into the $10–$11 area. This area represents a blow-off top, and ever since, the ICP price has been tagging lower highs and lower lows all the way until early 2026.
There’s a strong horizontal support zone between $2.00 and $2.20. You can see it clearly on the chart. This area represented a support base after the most significant selloff, with the ICP price consistently seeing buyers come in to defend it. From there, ICP started creating higher lows, gradually moving up towards the trendline resistance.
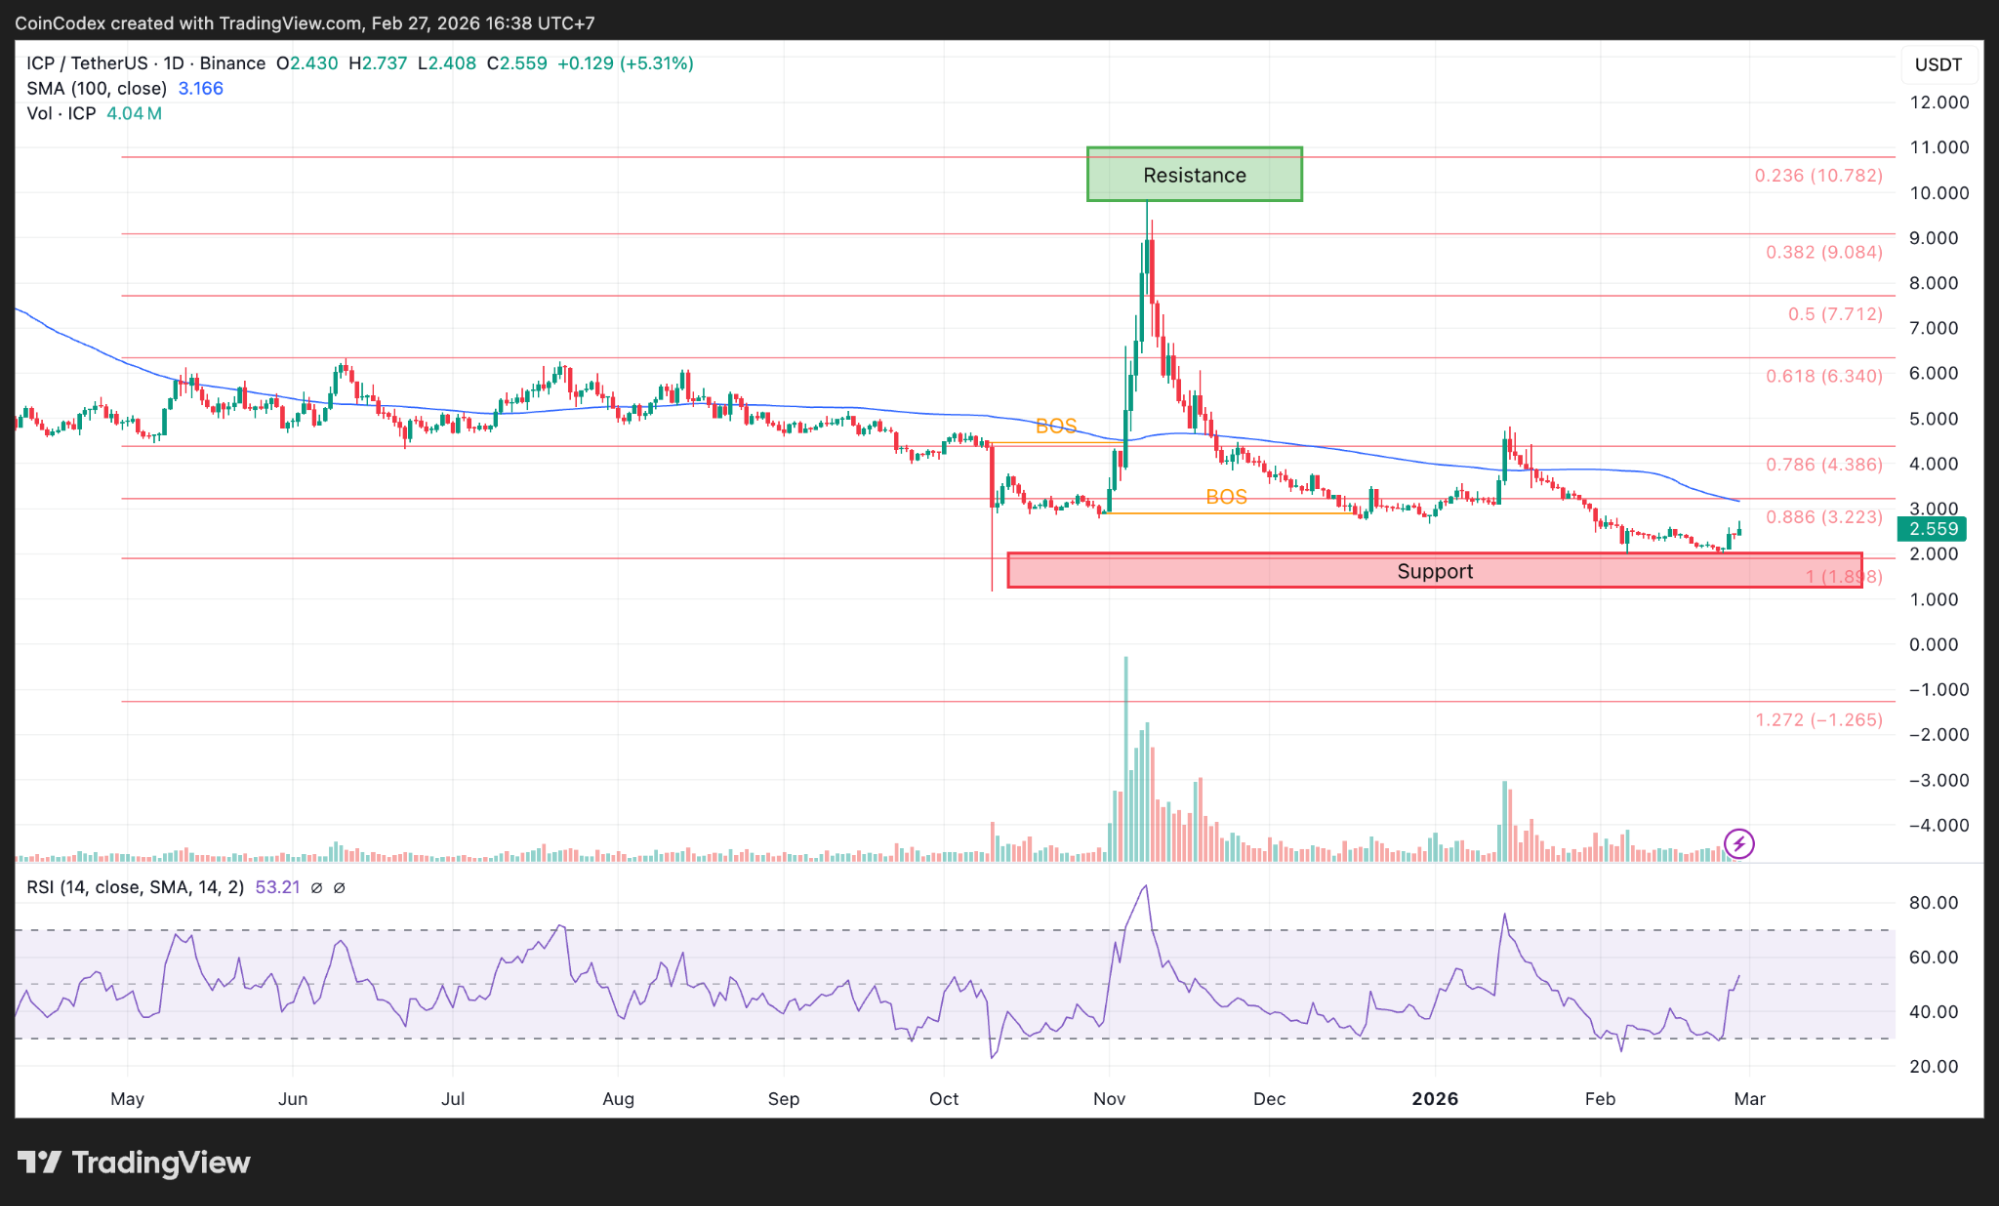
Daily ICP price chart analysis
At the moment, the price is trading around $2.55–$2.60, right beneath that falling trendline. A clean daily close above it would mark the first meaningful structural break in months.
From a Fibonacci perspective, ICP is also reclaiming key retracement levels from the last decline. The $2.56 level is a short-term pivot point, and holding above here certainly helps to reinforce the bullish narrative. The next level to break here is around $2.61–$2.70; this level has already been a point of rejection.
If this level can be cleared, then the path to $3.20–$3.80 is open. Further out, the $4.30–$4.60 level represents the next level of interest, which matches the 0.786 retracement level from the November high.
The ICP 4-hour chart: Momentum is already leaning bullish
Drop down to the 4-hour chart and you can see the shift in momentum more clearly. The ICP price has reclaimed the 100-period moving average and is holding above it. That’s important because this moving average acted as dynamic resistance throughout the downtrend. Now it’s flattening out and starting to turn.
Price also pushed above the 2.558 Fibonacci extension level on the lower timeframe, a level that previously rejected bounce attempts. This time, it broke through with rising volume. That gives the move more credibility.
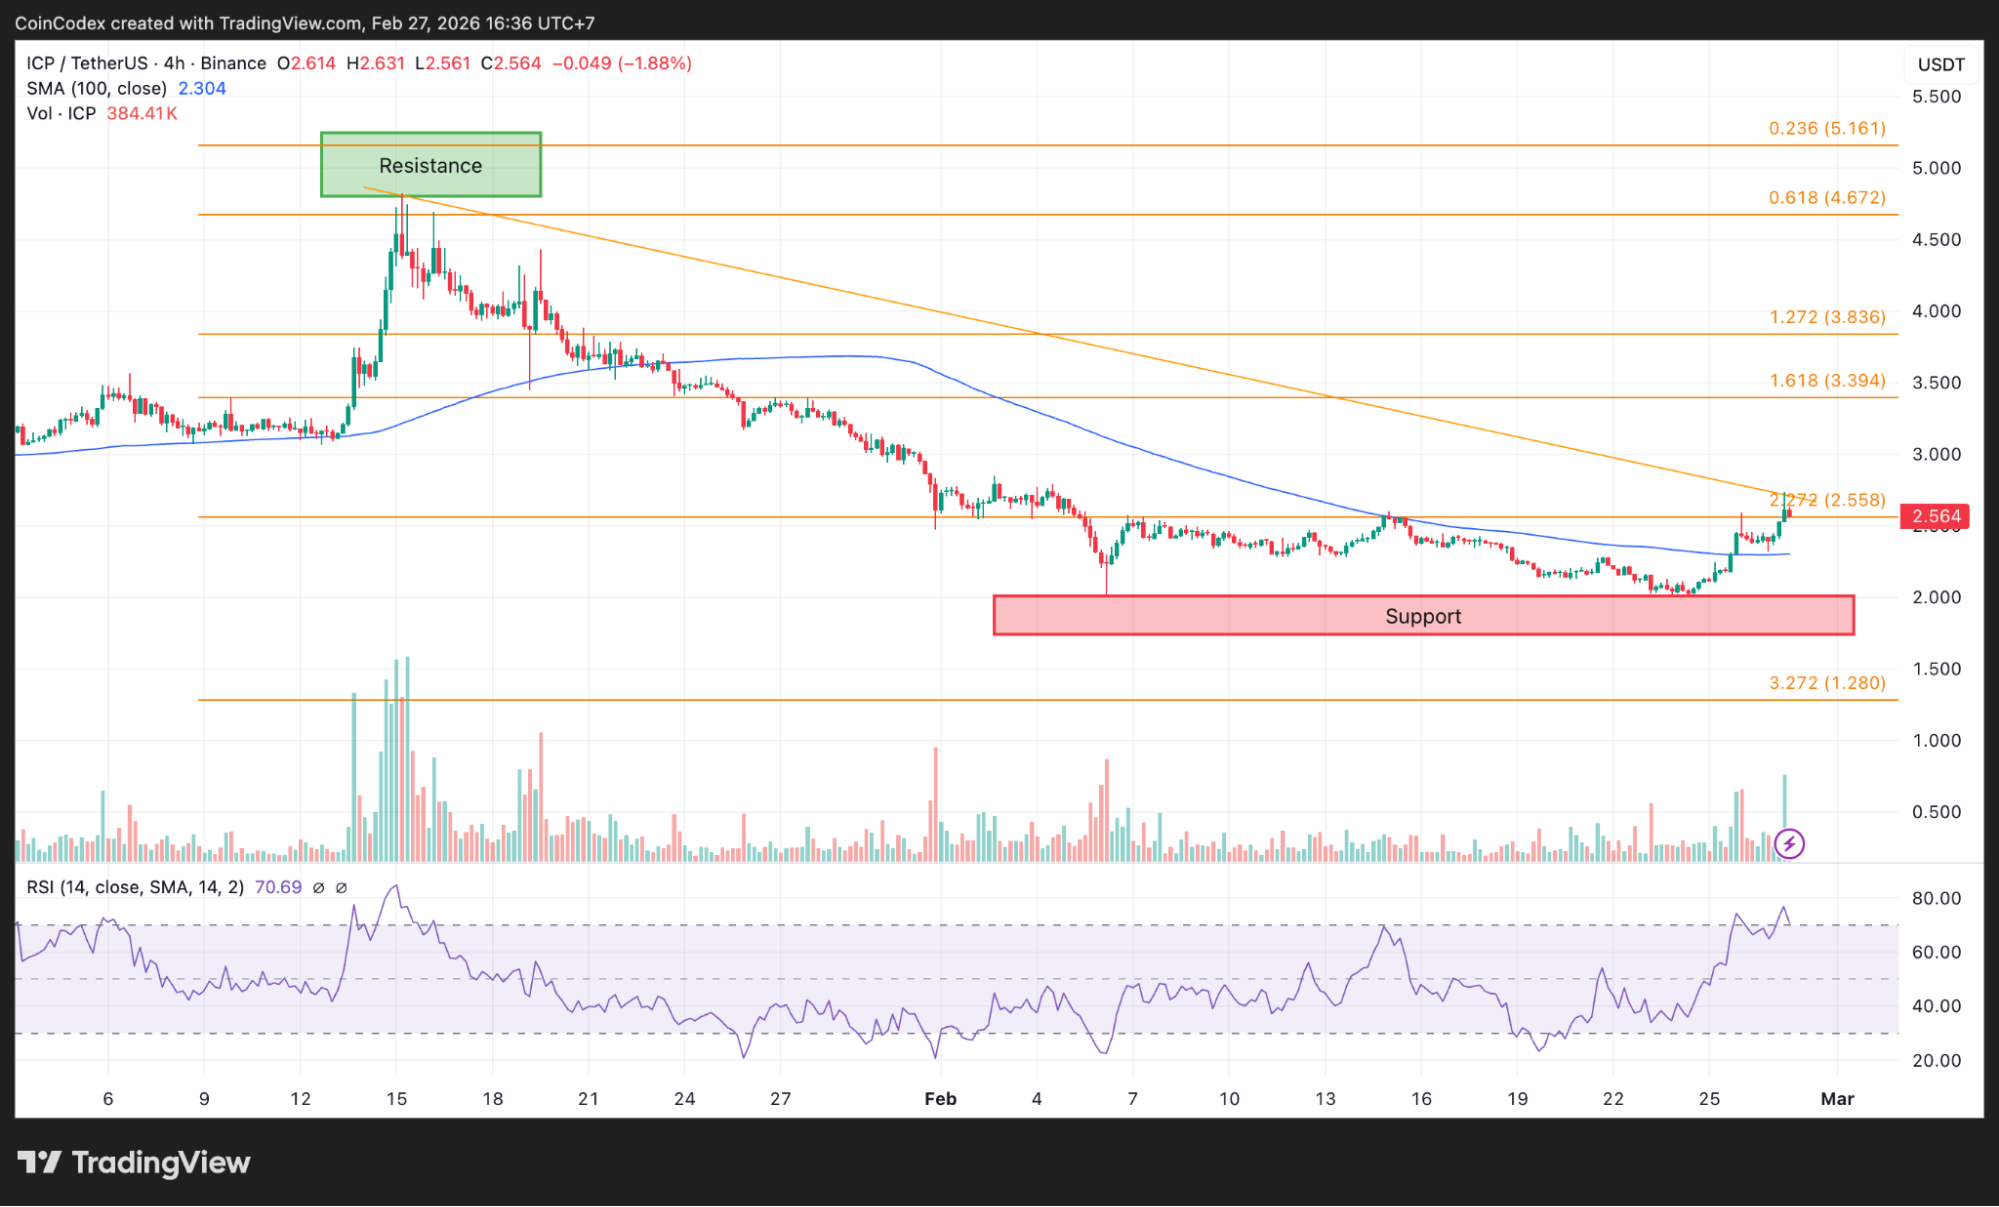
4-hour ICP price chart analysis
The RSI on the 4-hour chart is in the upper 60s and even rose above 70 at one time. That’s good momentum, but not at levels which indicate a pullback is imminent.
The key short-term risk level sits around $2.44. If the ICP price drops below that, it would weaken the structure and increase the odds of a pullback toward the 30-day moving average. As long as price holds above $2.56 and keeps printing higher lows on this timeframe, bulls have the upper hand.
What comes next for ICP
The ICP price is doing something it hasn’t done in months. It’s seriously challenging a long-term descending trendline with momentum behind it.
If the ICP price fails at the descending trendline and falls back below $2.44, this turns into another lower high within the broader downtrend. That would increase the probability of a move back toward $2.20 or even a retest of the $2.00 base.
CoinCodex’s 6-month ICP price prediction sits at $2.08, which would imply downside from current levels and a possible drift back toward lower support if momentum fades and sellers regain control.
Right now, ICP is testing the line that separates recovery from continuation of the downtrend. The next few daily closes will decide which side wins.
Kraken: Best crypto exchange for security & reliability
- Buy, sell, and trade 400+ cryptocurrencies with industry-leading security
- Spot, Futures & Margin trading – leverage up to 5x for advanced traders
- Earn rewards with staking on top cryptocurrencies
- 24/7 customer support and high liquidity for fast trades
- Regulated in the US with strong compliance and security measures
- 13+ million users worldwide
Disclaimer: This content is for informational purposes only and does not constitute financial, investment, or other advice. Nothing on this page is a recommendation or solicitation. Always seek independent professional advice before making investment decisions. Some links may earn us a commission at no extra cost to you.
Source:: Internet Computer Price Prediction: ICP Tests Key Level That Could Trigger a 2x Rally