Key highlights:
- The HYPE price has finally broken out of its long downtrend, changing the way the chart looks for the first time in months.
- Traders are now focused on a key reclaim zone that could decide whether this move actually has staying power.
- Market and on-chain data indicate HYPE may be entering a phase where direction starts to matter more than chop.
After months of frustrating price action, Hyperliquid is finally starting to feel interesting again. Not because it has already broken out, but because something has clearly changed under the surface.
A recent update from Crypto Bully puts that into perspective, pointing to a key liquidity sweep and a level that now matters more than anything else on the chart.
Why the sweep of the October lows matters for HYPE
One of the biggest changes on the HYPE chart came when price took out the October lows, referred to by Crypto Bully as the “10/10 lows.” On the daily chart, that move stands out clearly.
The HYPE price pushed below its previous support, took out stops, shook out weak holders, and then snapped back higher. That kind of move is usually not random.
After a long downtrend, the market often needs one last flush to clear out sellers before it can even think about building something more constructive. That does not mean the bottom is guaranteed, but it does indicate that the easy part of the downside may already be behind us.
$HYPE scheduled update
After some choppy price for past few months, we took out the 10/10 lows which should result in good development with price.
Looking for a reclaim of this level marked in green as an over and under setup with stops below the recent lows. If we reject from… pic.twitter.com/m4rzbBnmEs
— Crypto Bully 🔥 (@BullyDCrypto) January 27, 2026
What makes this more interesting is what happened right after. Instead of drifting sideways or continuing lower, the HYPE price reacted quickly and reclaimed lost ground, which tells us buyers were ready to step in once that sell-side pressure was gone.
With those lows taken out, attention has shifted to the reclaim zone marked in green on the chart. This is the level Crypto Bully is focused on, describing it as an over-and-under setup. In simple terms, price needs to get above that area, hold it, and then treat it as support rather than getting rejected at it.
Market data supports the idea of a recovery attempt
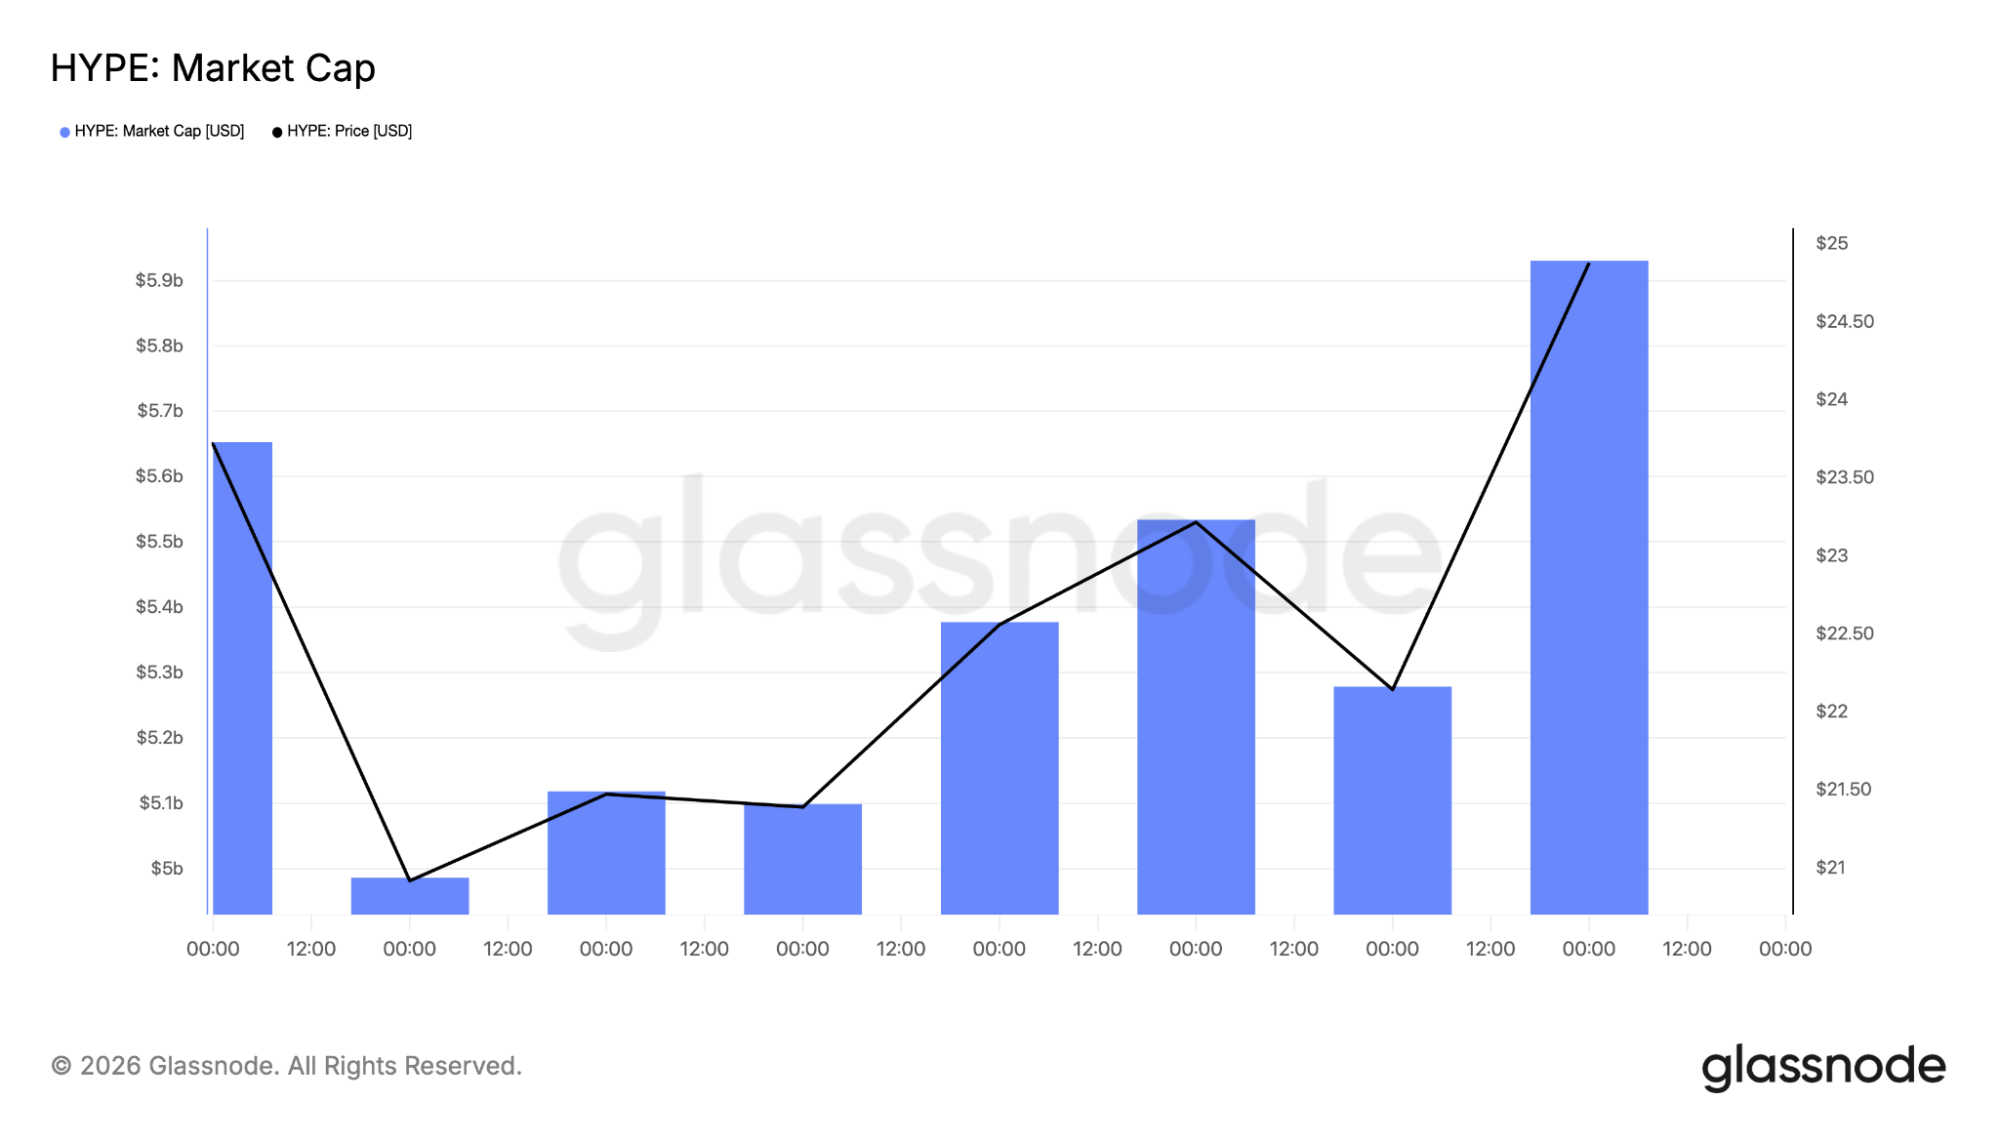
Looking beyond price itself, the Glassnode data adds confidence to this setup. The market cap chart shows that HYPE has climbed back toward the $5.9 billion area after previously falling close to $5.0 billion. That indicates capital is flowing back in, not just short-term traders chasing a bounce.
At the same time, HYPE is still sitting around 58% below its all-time high. That is important because it means price is still deeply discounted and nowhere near a zone where profit-taking pressure usually becomes heavy.
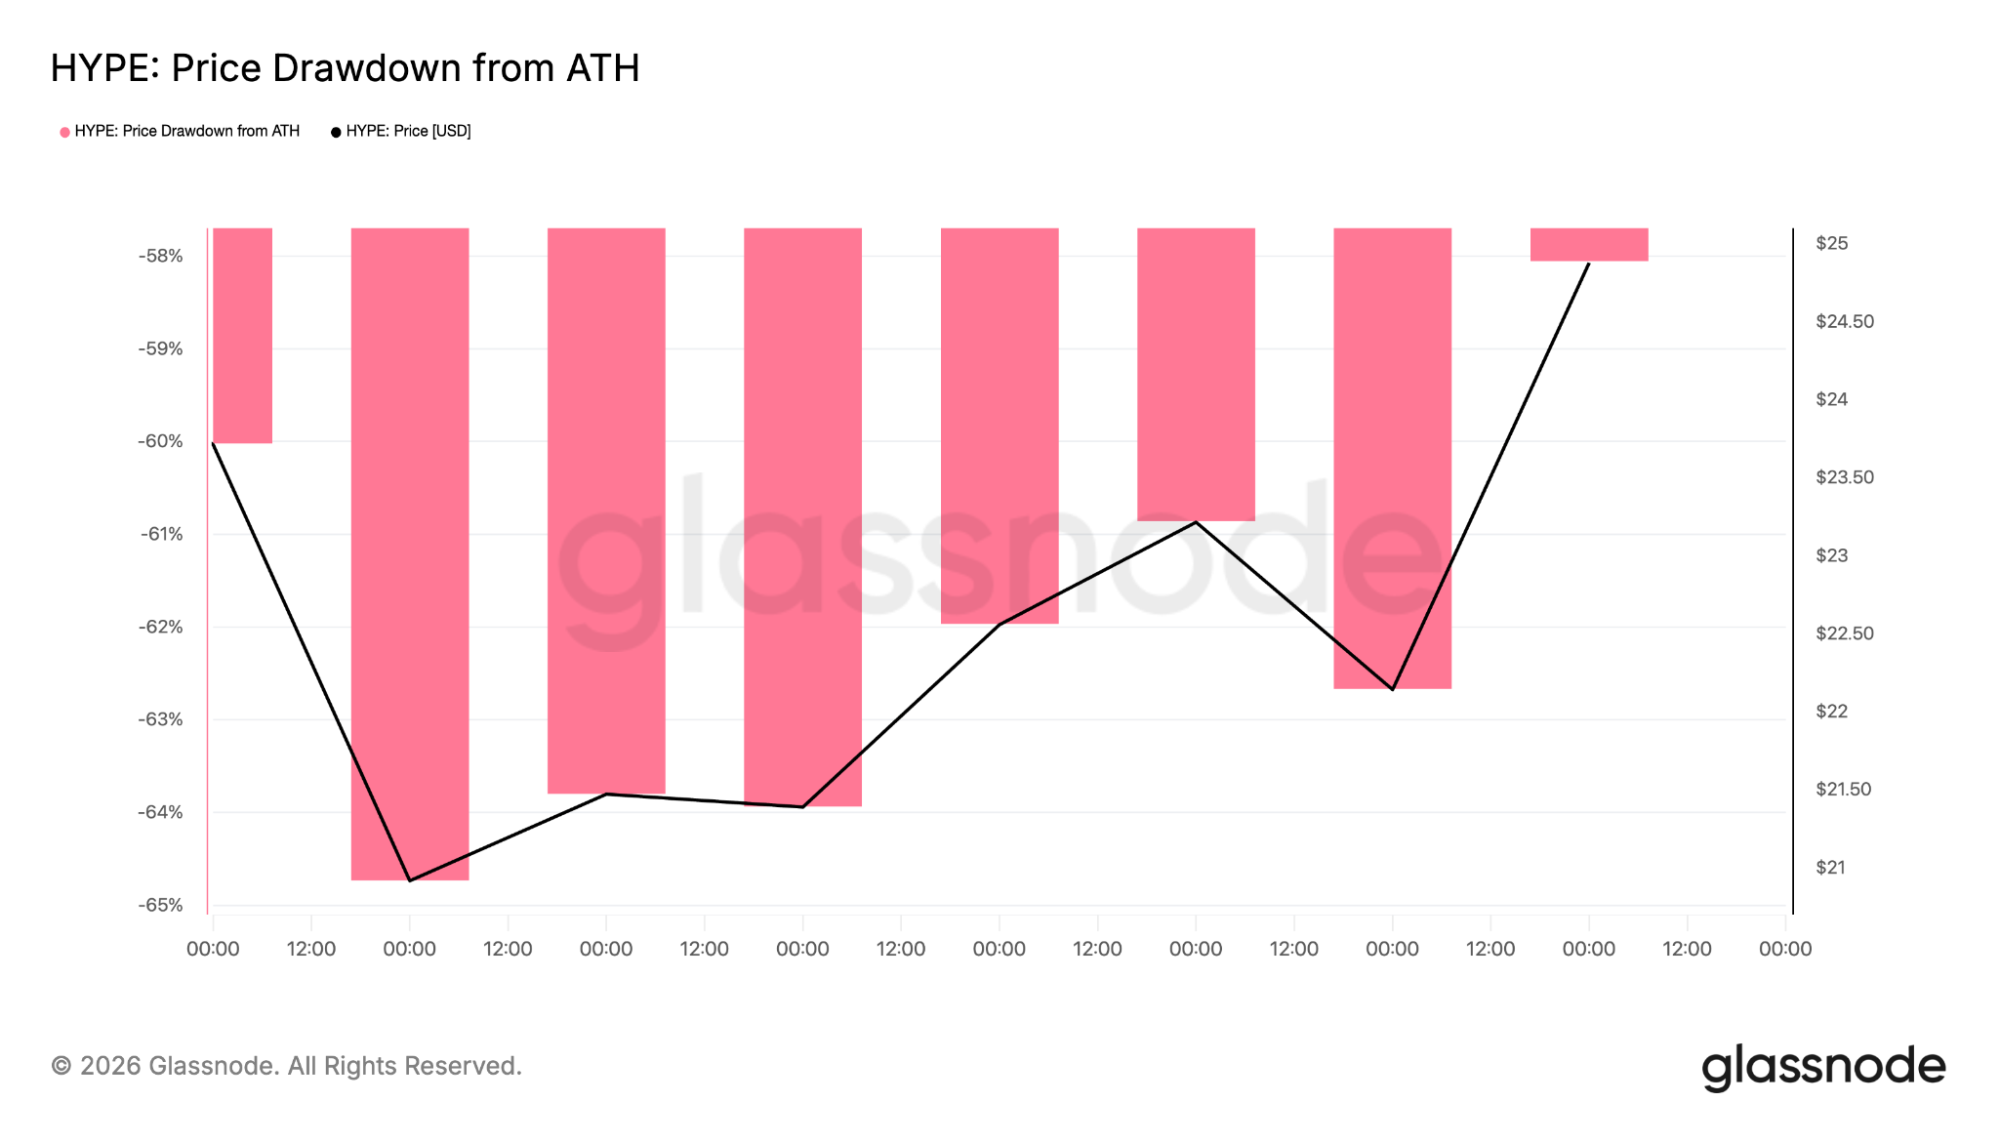
Historically, when assets start to recover while still far below their highs, they often have room to build a more sustained move, assuming the wider market does not fall apart.
The HYPE 4-hour chart shows buyers are finally showing up
Dropping down to the lower timeframes adds more detail to the picture. On the 4-hour chart, the HYPE price reacted off the support zone in the low $20s and moved back toward the mid-$20s with strength.
That area has now become the short-term base. Each time price dipped into it, buyers stepped in fairly quickly, which is a big change from past months when every bounce was sold and price kept sliding lower.
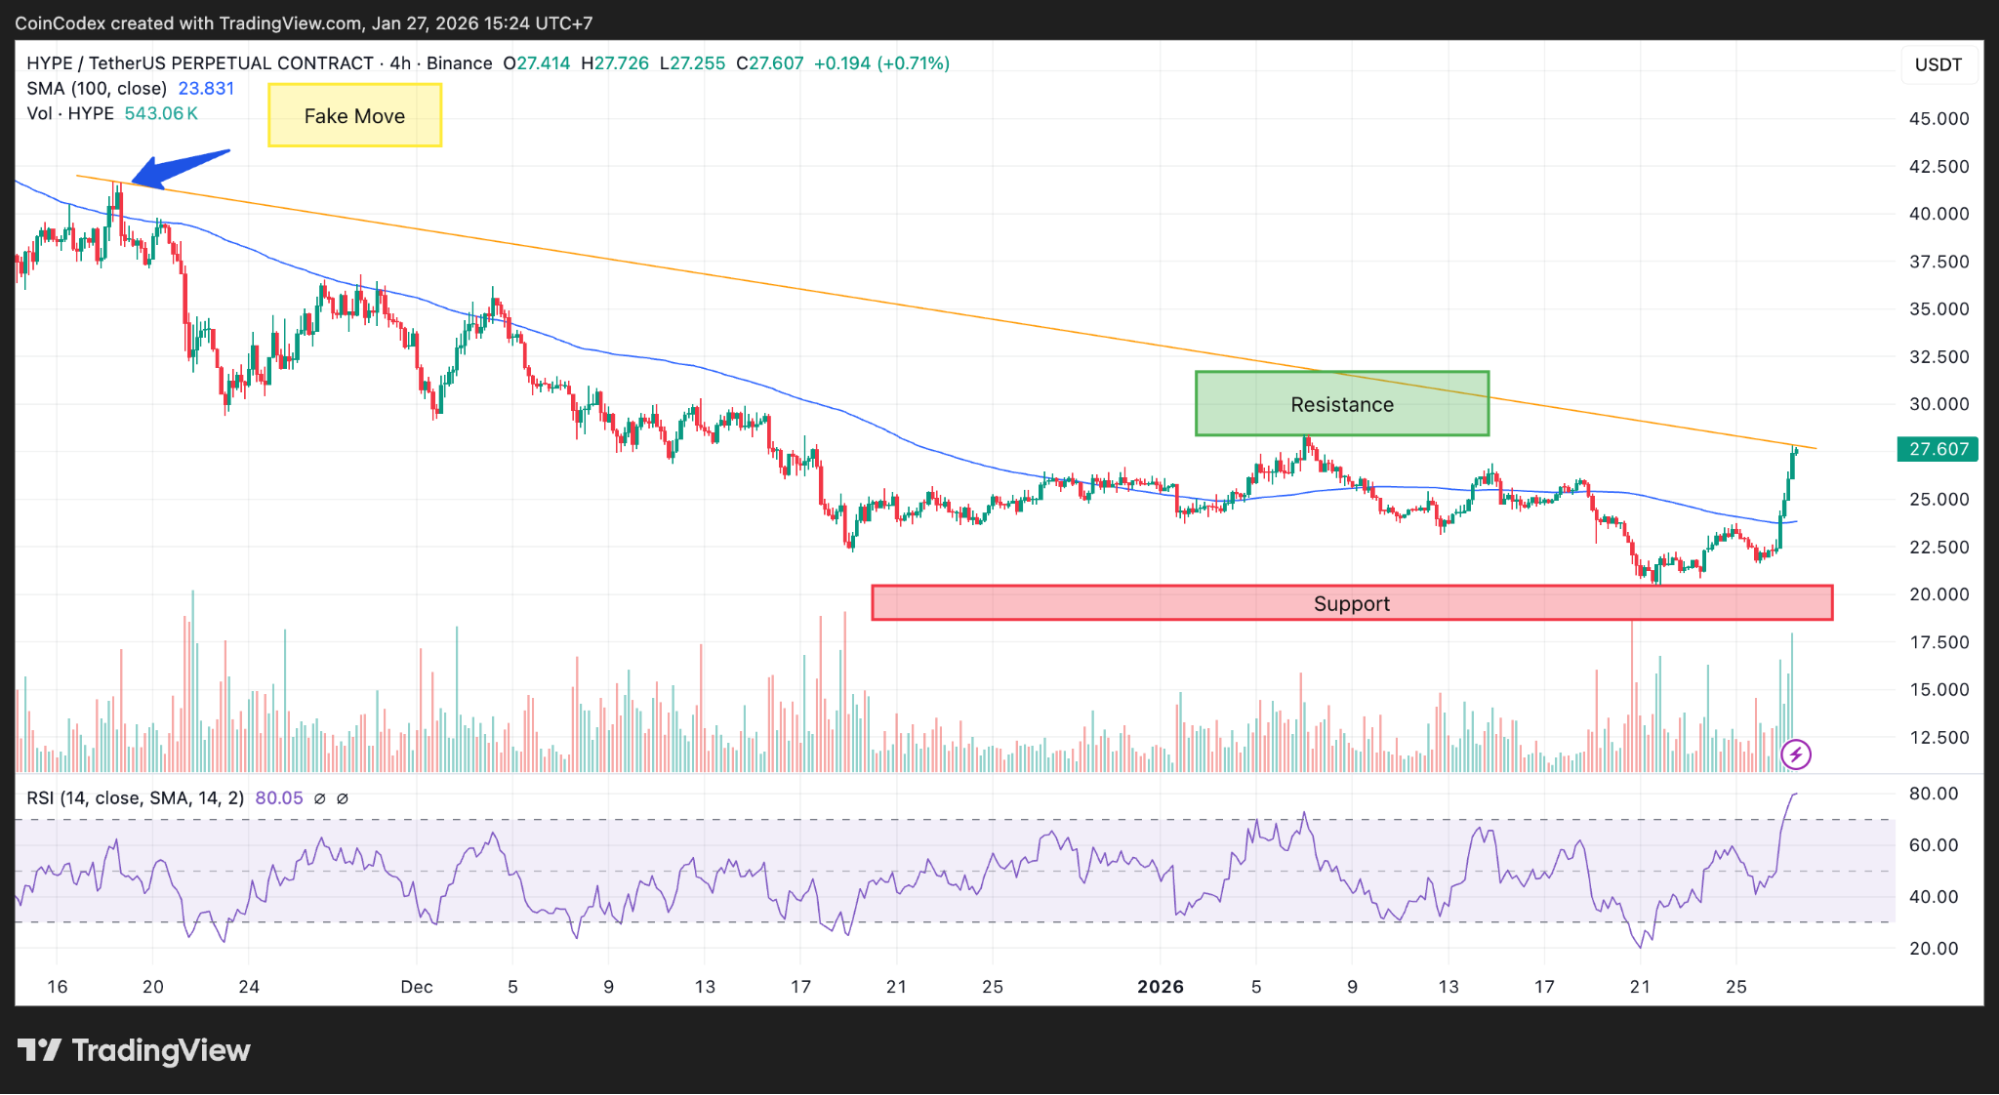
4-hour HYPE price chart analysis
At the same time, price is now pushing into a descending trendline and a visible resistance area around the high $20s. This zone has rejected the price before, so it is not going to give way easily. A clean break above it would go a long way toward confirming that the market is actually changing character.
The HYPE daily chart hints at a possible shift
When you zoom out and look at the daily chart, it becomes pretty clear why the HYPE price suddenly feels different from what we’ve seen over the past few months.
For a long time, every bounce was getting sold, and the trend stayed firmly bearish as price slid from the $40–$45 area all the way down into the low $20s.
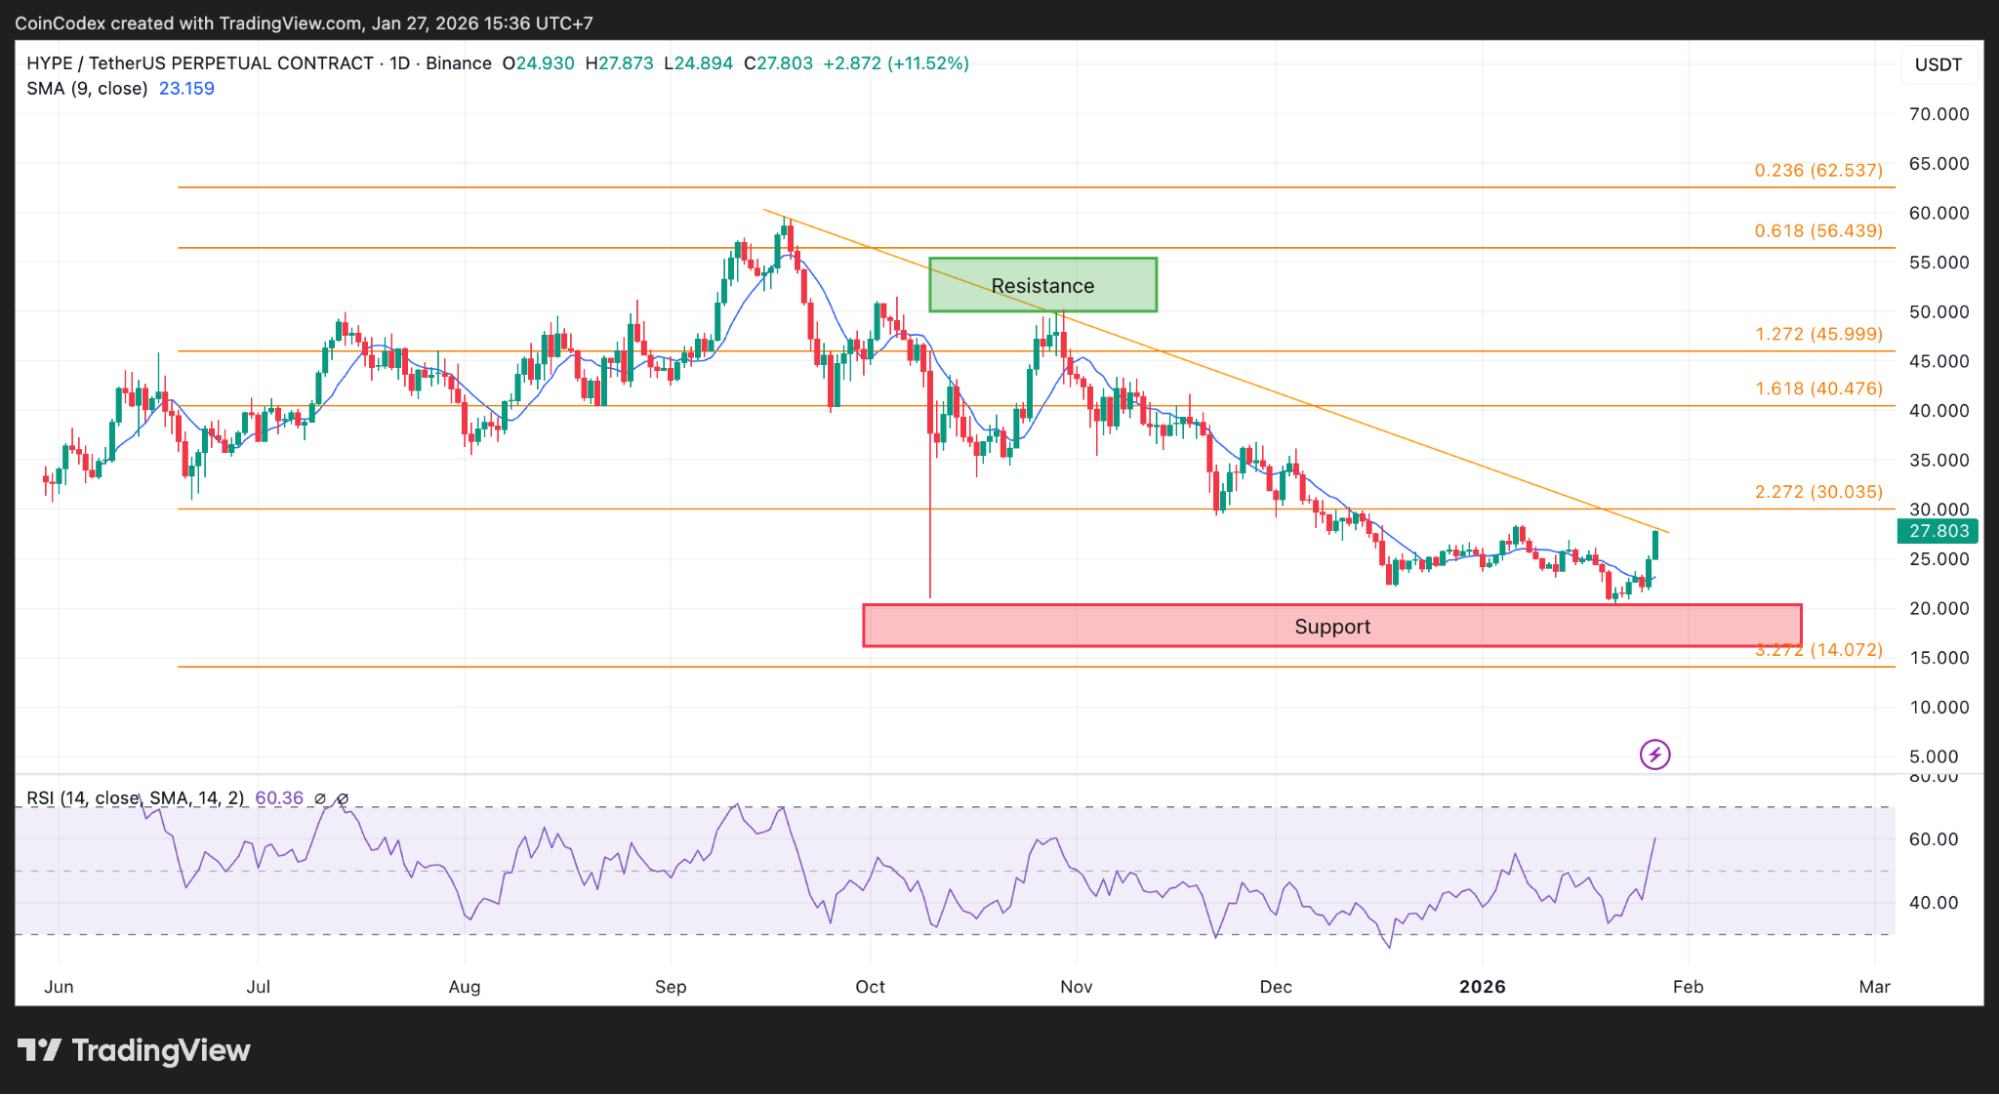
Daily HYPE price chart analysis
That started to change after HYPE swept the October lows around $21–$22. Instead of rolling over again, the HYPE price pushed higher and began printing stronger daily closes. That does not mean the trend has fully flipped just yet, but it does suggest that sellers are starting to lose control.
Now all eyes are on the $27–$29 zone, where old resistance and the falling trendline come together. As long as HYPE can stay above the $21–$22 support area, the idea of a broader recovery stays very much alive.
Where the HYPE price could go next
From here, the roadmap is fairly straightforward. If the HYPE price manages to reclaim the green zone and hold above it on daily closes, that would strongly support a broader recovery phase.
In that case, attention would likely shift toward the low to mid-$30s, where previous breakdowns happened and where sellers may start to appear again.
If price fails at the reclaim and starts slipping back below the mid-$20s with speed, then the focus shifts back to the low $20s and potentially lower. That would indicate the recent move was just a bounce within a larger downtrend.
According to CoinCodex’s 1-month HYPE price prediction, HYPE could move toward $19.48, which reflects the more bearish view of where the market might head.
In practical terms, the market is offering a very clear structure. Either HYPE proves its strength by holding reclaimed levels, or it shows weakness quickly and invalidates the bullish case.
Kraken: Best crypto exchange for security & reliability
- Buy, sell, and trade 400+ cryptocurrencies with industry-leading security
- Spot, Futures & Margin trading – leverage up to 5x for advanced traders
- Earn rewards with staking on top cryptocurrencies
- 24/7 customer support and high liquidity for fast trades
- Regulated in the US with strong compliance and security measures
- 13+ million users worldwide
Disclaimer: This content is for informational purposes only and does not constitute financial, investment, or other advice. Nothing on this page is a recommendation or solicitation. Always seek independent professional advice before making investment decisions. Some links may earn us a commission at no extra cost to you.
Source:: Hyperliquid Price Analysis: HYPE Breaks Its Downtrend – But Can It Hold?