Key highlights:
- Ethena has just emerged out of a bear flag, but whether it has legs to stand on or if further downside can be expected is now in question.
- The recent bounce has been a weak one, which shows a measure of restraint on the part of traders who are holding out for further signs.
- On-chain data points to stabilization, not strong buying, which keeps ENA in a wait-and-see phase for now.
Ethena has been doing exactly what the chart hinted at weeks ago. After spending time trapped in a well-defined bear flag, the price finally broke down and followed through to the downside.
There was no hesitation once that structure failed. From the breakdown point, the ENA price slid more than 30%, confirming that sellers were firmly in control and that the market simply wasn’t ready to turn higher yet.
Moves like this tend to reset sentiment fast. Late buyers are shaken out, and short-term optimism fades, forcing traders to take a step back and reassess.
A bear flag that sees a clean break will more likely indicate a continuation rather than an exhaustion move. That context matters, especially now that ENA is hovering around the $0.2100 area and trying to find its footing.
Why the Ethena bear flag was a big deal
Crypto trader Umair shared a chart showing a bear flag. The bear flag didn’t form by accident. It developed after a sharp impulsive sell-off, followed by a slow and overlapping grind higher.
That type of price action usually points to weak demand. Buyers step in carefully, but there’s no urgency and no real follow-through.
$ENA 📉📊
In the last update, ENA was clearly stuck in a bear flag, and the breakdown played out exactly as expected. Price is now down over 30%, a clean move if you were positioned correctly.
The max pain zone around $0.12 is still on the table. Midway, the chart is trying to… https://t.co/Bru7NrPulJ pic.twitter.com/jPsf7wlUK0
— Umair Crypto (@Umairorkz) December 25, 2025
As long as the ENA price stayed inside that flag, there was always a risk that price would roll over again. Once the lower boundary finally gave way, downside momentum picked up quickly.
The breakdown lined up with falling moving averages and fading volume support, which made the move feel structural rather than emotional. This wasn’t a fakeout or a brief stop run. It was the market doing exactly what the structure indicated it would do.
ENA price pauses near $0.21, but no real shift yet
After the sharp drop, ENA has started to slow down. The price is no longer cascading lower candle after candle. Instead, it’s chopping sideways near the lower end of the range, roughly between $0.2000 and $0.2100. That naturally sparked some discussion about whether a short-term bottom could be forming.
But pauses are common in downtrends. They don’t automatically signal a reversal. Sometimes the market just needs time to reset before deciding on the next leg.
Right now, ENA looks like it’s in that waiting phase. Selling pressure has cooled, but buyers haven’t shown enough strength to flip the structure yet.
How on-chain data reflects current market behavior
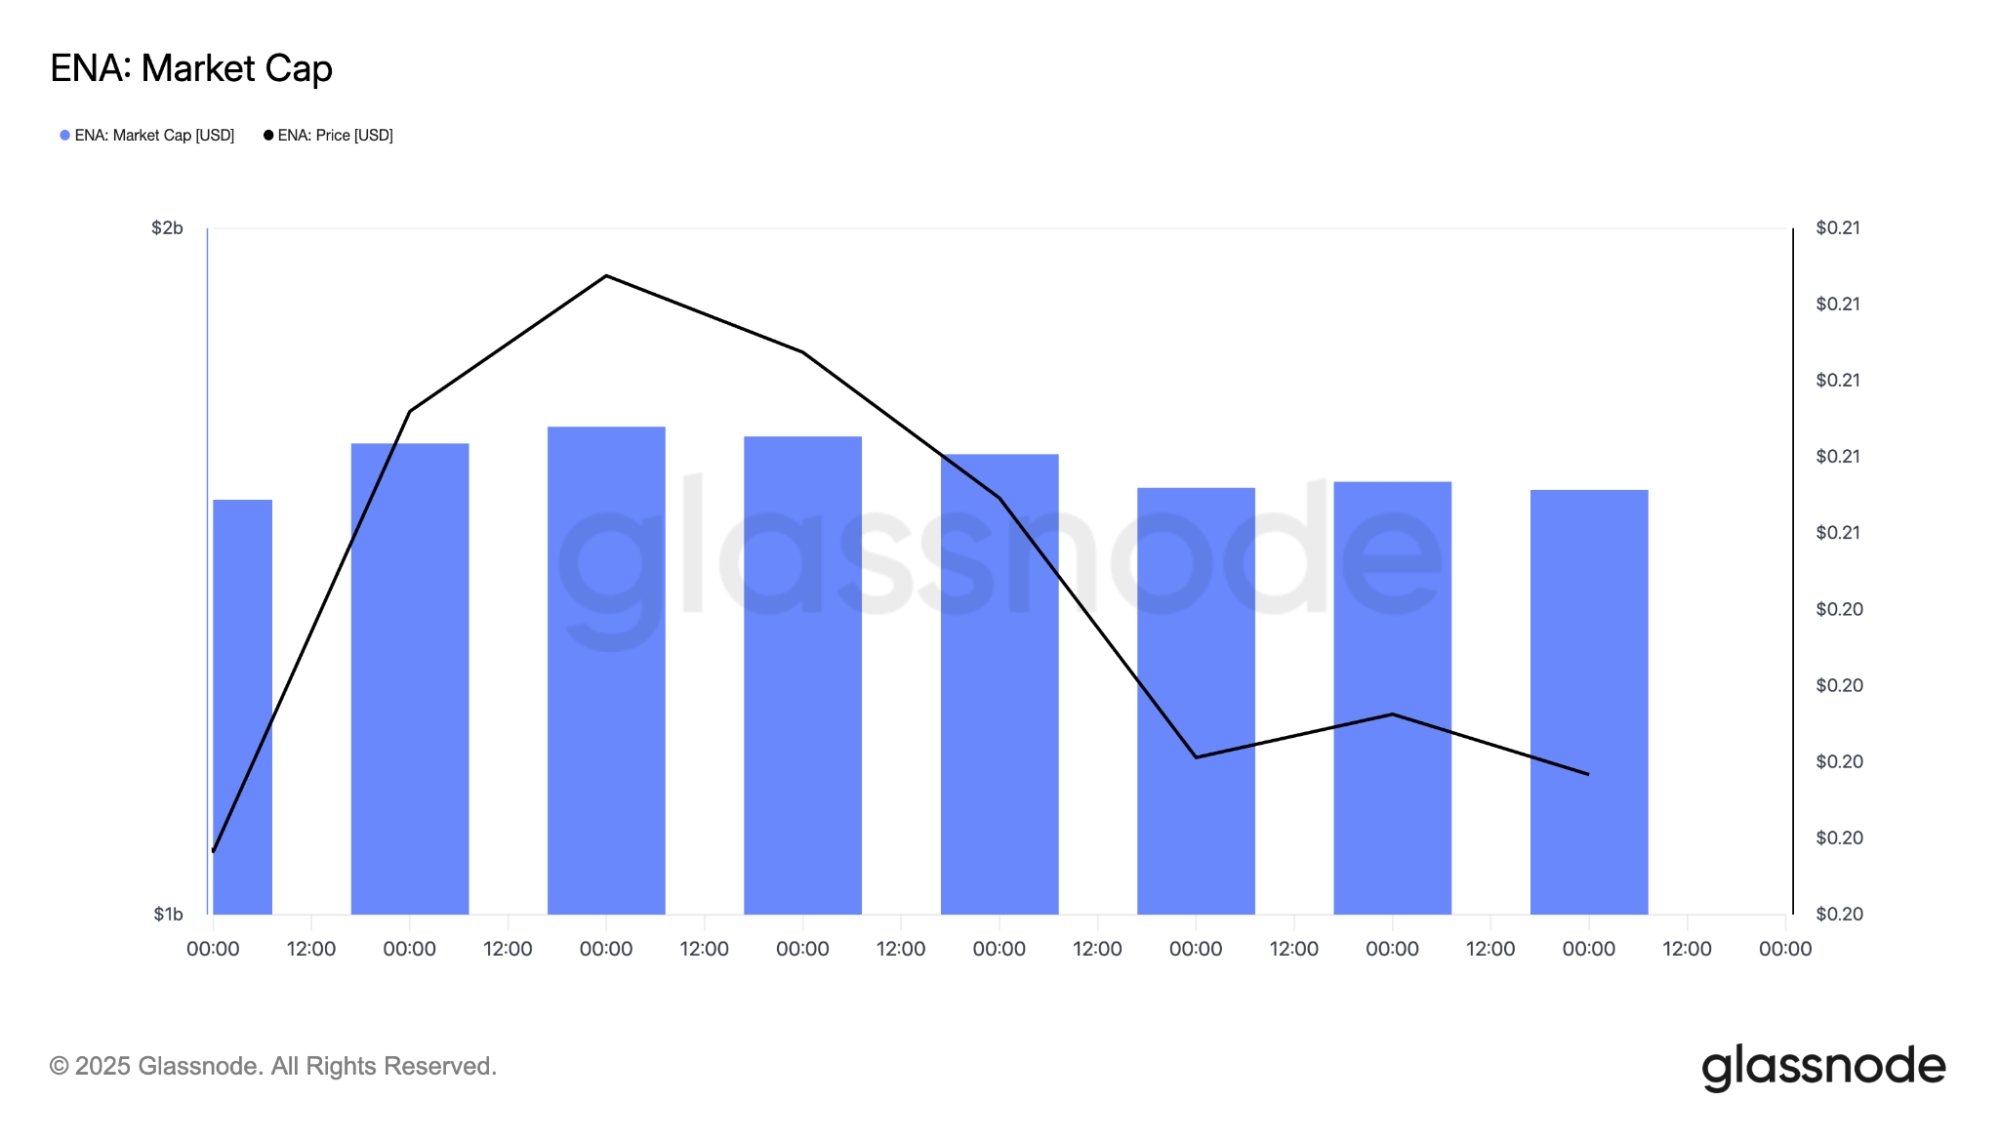
The on-chain data from Glassnode tells a pretty similar story to what we’re seeing on the chart.
ENA’s market cap has stopped sliding and is moving sideways with price, which indicates the heavy selling pressure has eased. But at the same time, it doesn’t look like fresh capital is rushing in yet.
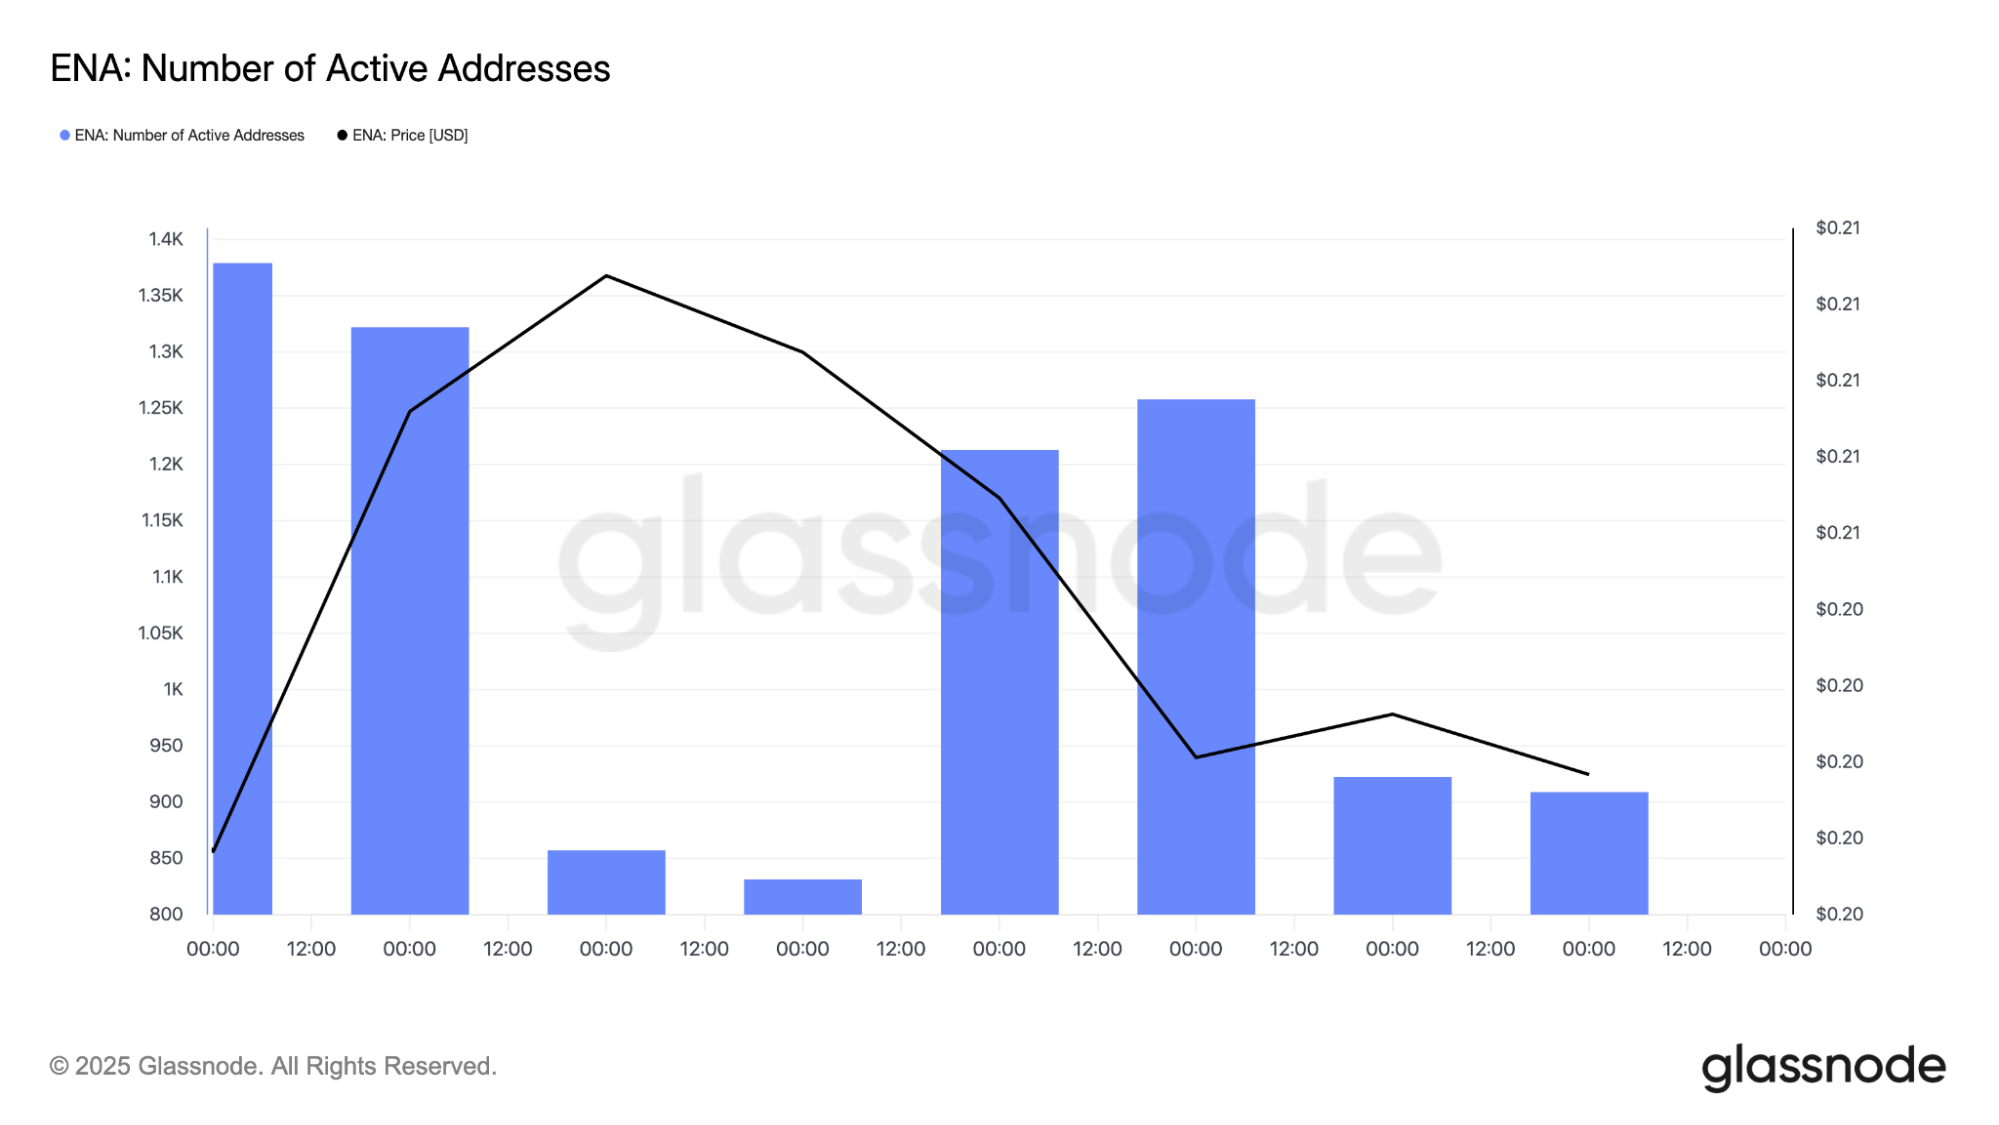
Active addresses pick up when the price makes short pushes toward $0.2100, but those bursts of activity fade quickly. That usually points to traders jumping in for quick moves rather than longer-term accumulation.
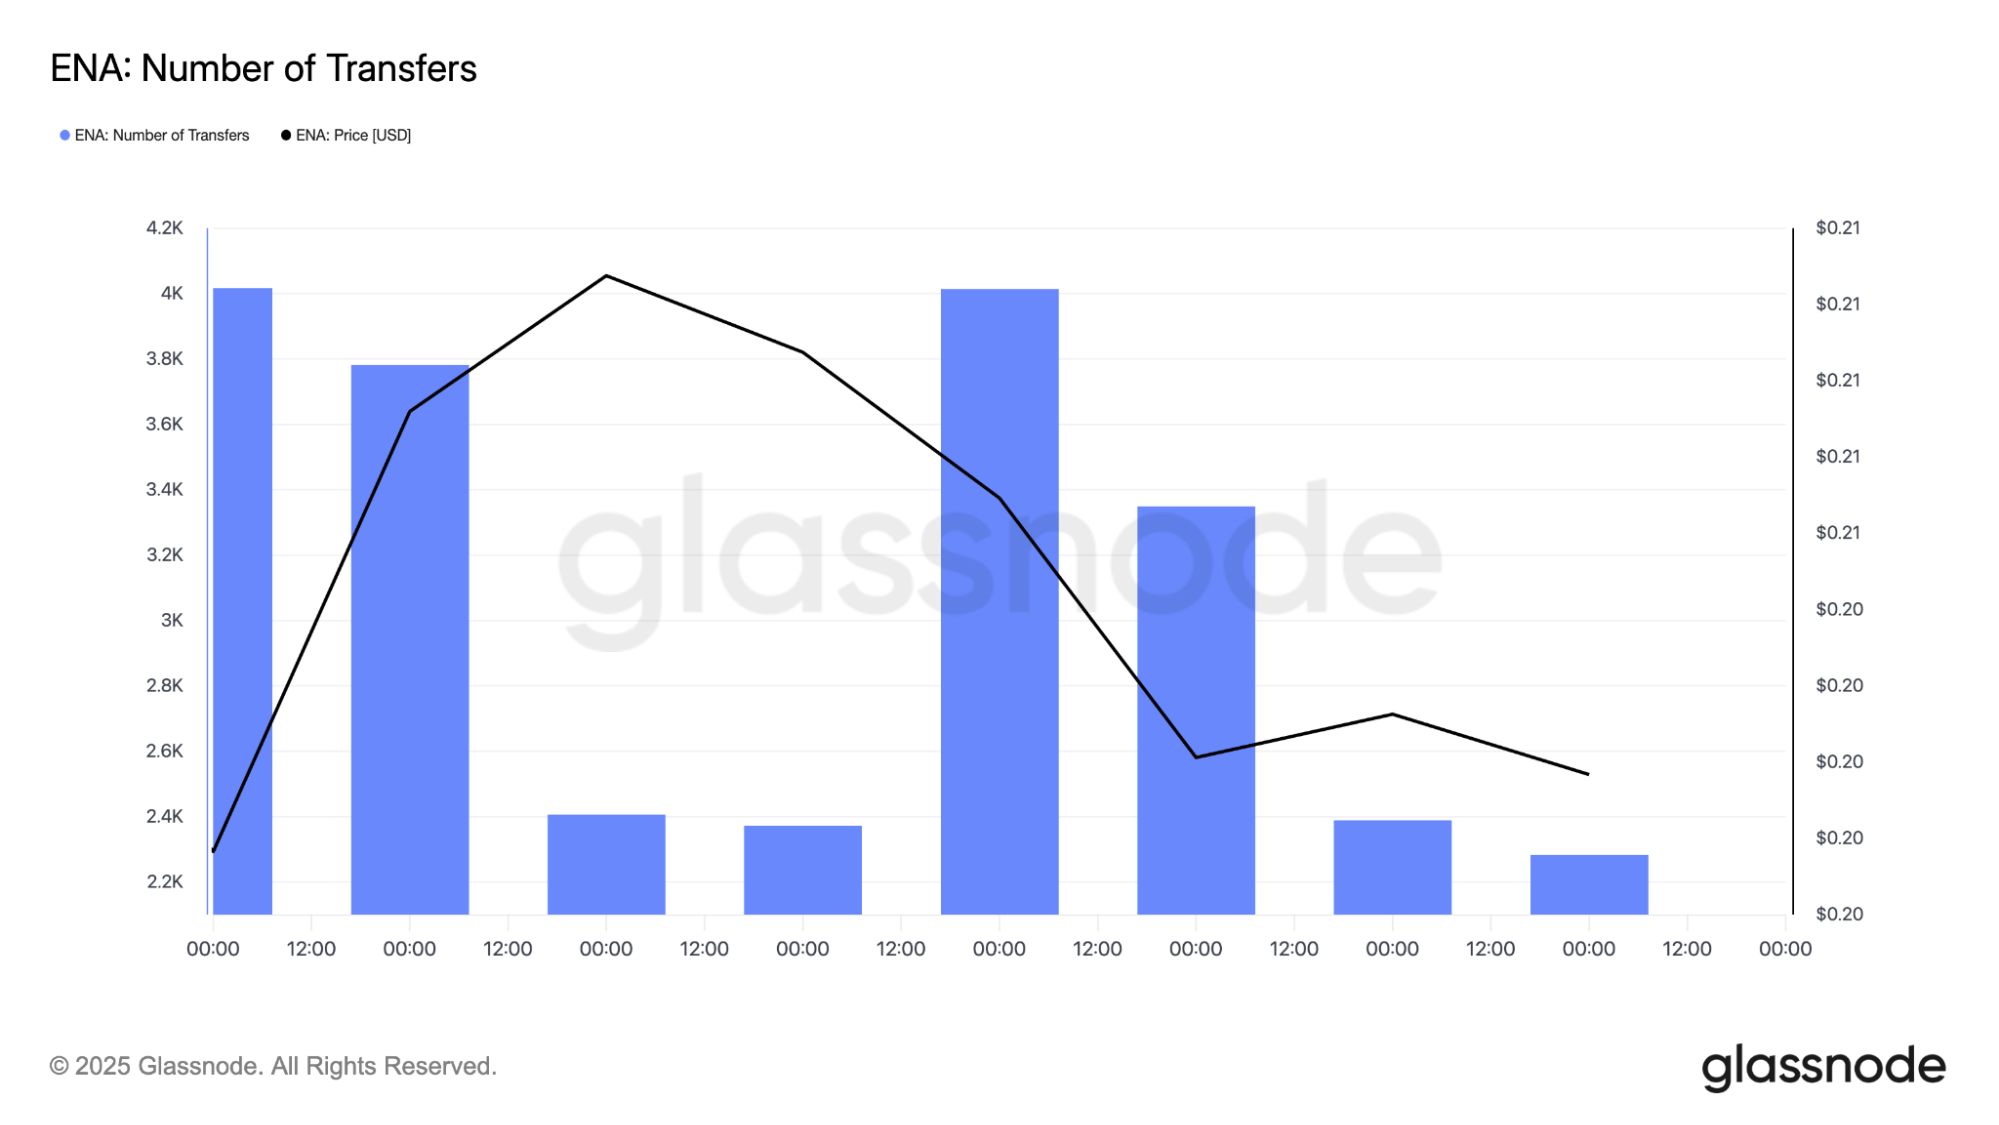
Transfer counts follow the same pattern, with spikes during volatility that don’t really stick around. Taken together, it feels like the market is still cautious. There’s interest, but it’s selective. Most participants seem to be trading the range and waiting for clearer confirmation before committing to a bigger move.
Ethena tests a potential double bottom
One pattern that’s getting attention is a possible double bottom. This setup can sometimes hint that sellers are losing control, especially if the price starts reclaiming key levels above recent highs.
For ENA, that key level sits around $0.2160 on the daily chart. A clean daily close above that zone would matter. It would indicate buyers are finally stepping in with some conviction and breaking the sequence of lower highs.
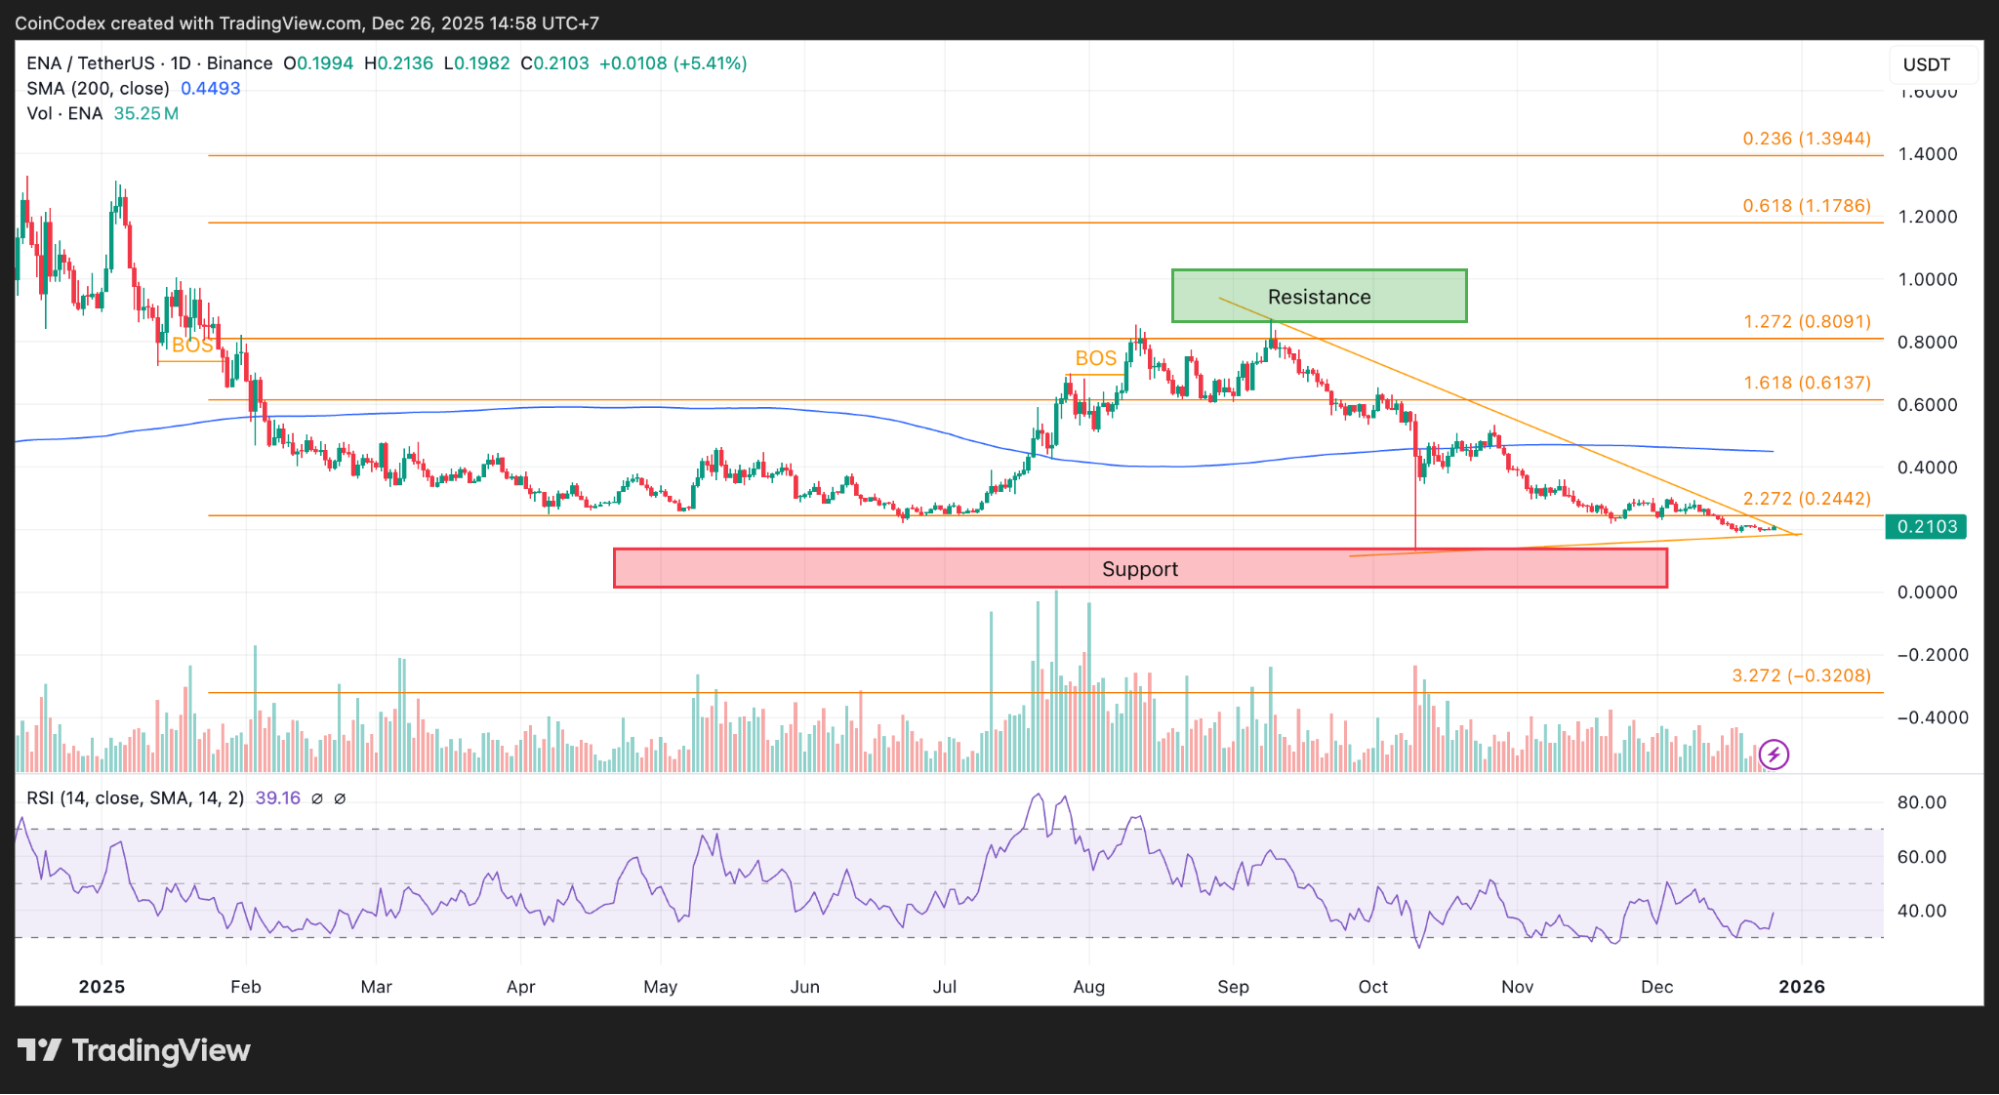
Daily ENA price chart analysis.
Until that happens, the double bottom is just a possibility, not a signal. Markets don’t reward anticipation. They reward confirmation, and ENA hasn’t delivered that confirmation yet.
The $0.2160 area isn’t arbitrary. It lines up with previous structure, short-term moving averages, and the midpoint of the recent breakdown. That’s why traders are watching it so closely.
If the ENA price can reclaim $0.2160 and hold above it, the tone changes. At that point, a relief move toward $0.2400 becomes realistic. That wouldn’t mean the downtrend is over, but it would signal that the market is ready to breathe a little and reassess, rather than continue lower immediately.
The ENA price at a crossroads: Rally or reversal
On the downside, the max pain zone near $0.1200 hasn’t disappeared. It’s well below current price, but it remains relevant as long as the broader structure stays bearish. In strong downtrends, the price often revisits deep liquidity zones where weak hands are forced out.
If the ENA price fails to reclaim $0.2160 and starts rolling over again, that lower area stays in play. It’s not a prediction, but it’s a risk that traders can’t afford to ignore. Downtrends have a habit of punishing complacency.
RSI adds another layer to the picture. Momentum has lifted off extreme oversold levels, which helps explain why selling pressure slowed near $0.2000. At the same time, RSI hasn’t pushed into a strong bullish range either.
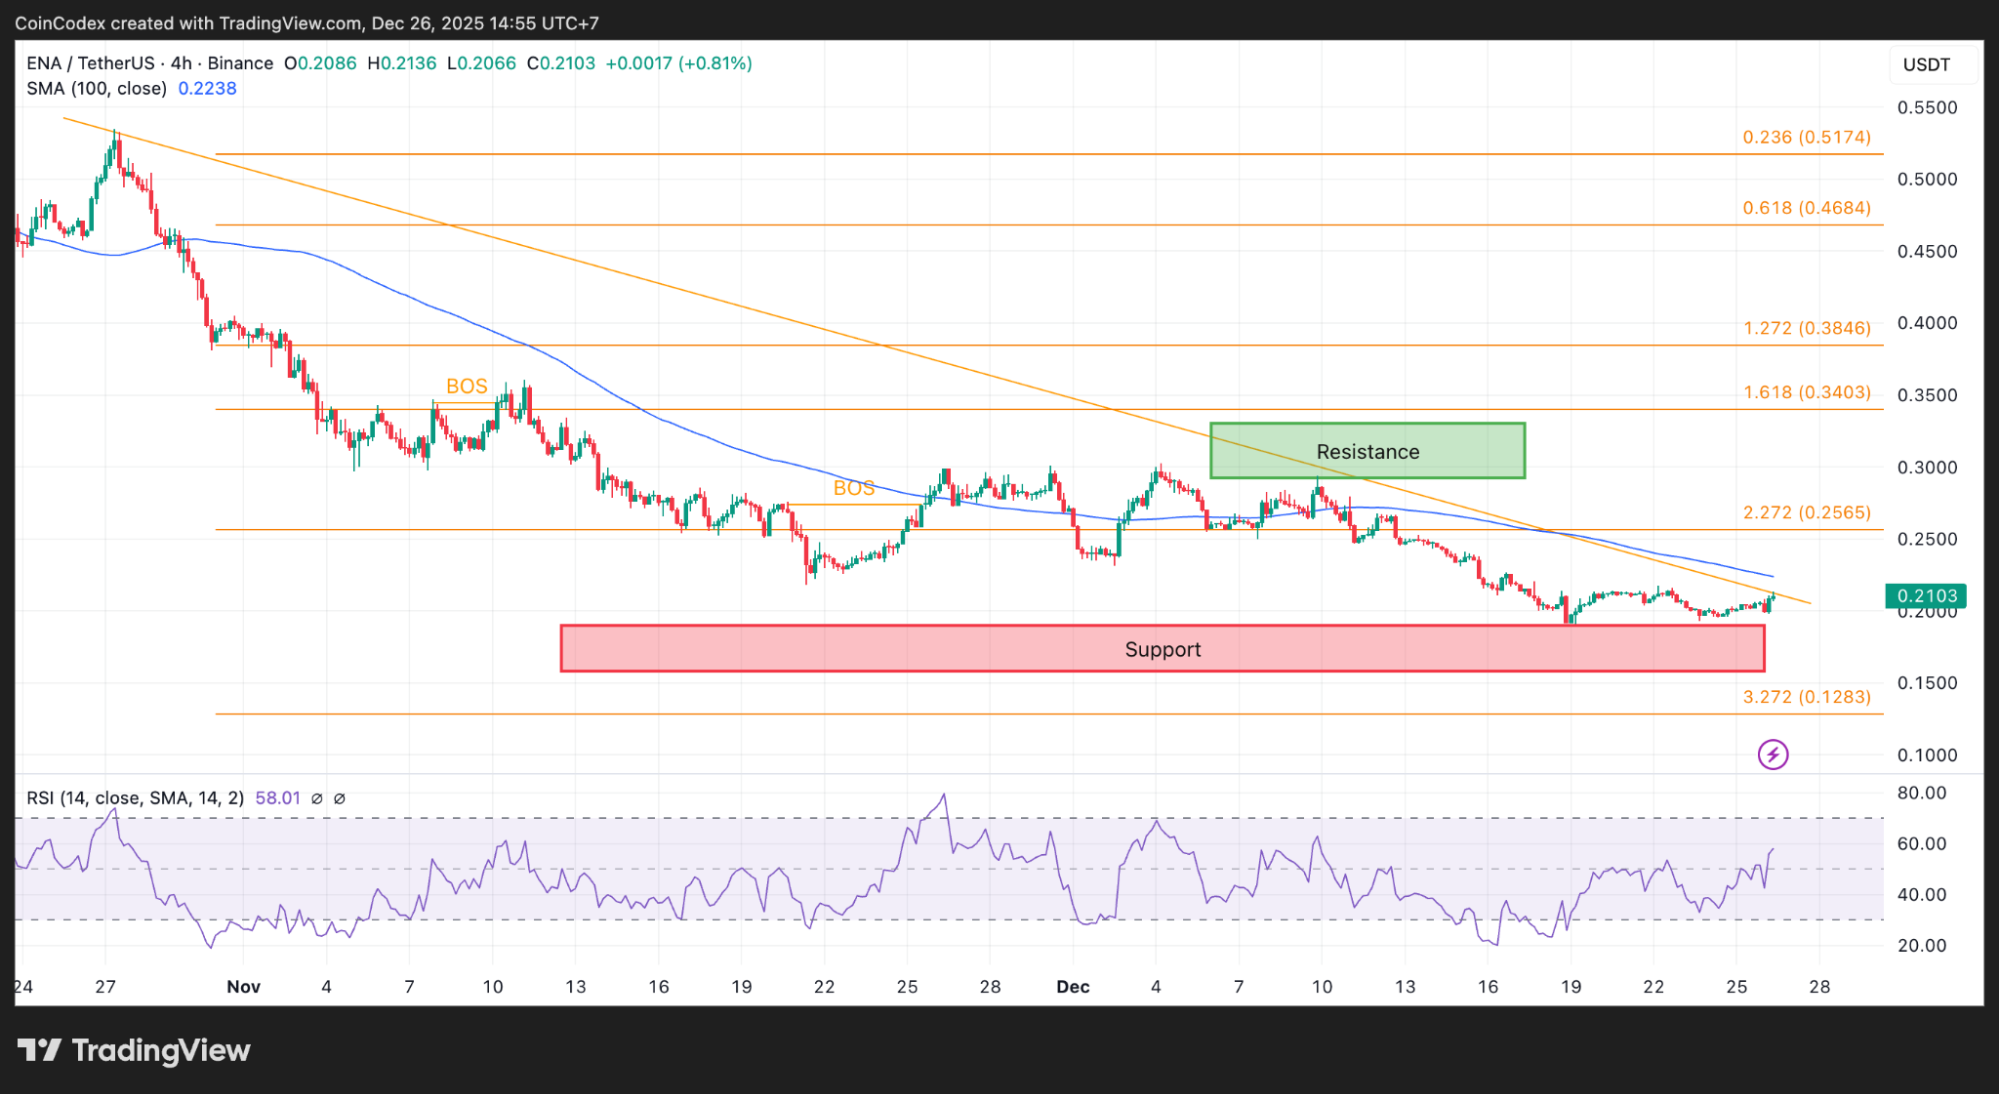
4-Hour ENA price chart analysis.
That neutral momentum fits the current price action. The ENA price isn’t collapsing anymore, but it also isn’t showing the kind of strength you’d expect from a real reversal. This kind of indecision often resolves in the direction of the higher-timeframe trend unless something changes.
There’s an important distinction to make here. A relief rally is a short-term move driven by oversold conditions and short covering. A true reversal requires sustained demand, higher highs, and higher lows across multiple timeframes.
For the ENA price, the optimistic short-term scenario is a push toward $0.2400 if $0.2160 gets reclaimed. Anything beyond that would need more proof. Until then, the broader structure remains bearish first, neutral second, and bullish only with confirmation.
What’s next for Ethena?
The next few daily closes will matter far more than intraday noise. How the ENA price behaves around $0.2160 will tell traders a lot.
Strong volume and follow-through would indicate buyers are finally stepping up. A lack of follow-through would signal that sellers are still waiting overhead.
At the same time, losing support around $0.2000 without a meaningful bounce would increase the odds of another leg lower toward $0.1200. This is a decision zone, and patience matters more than prediction.
The ENA price drop was clean, technical, and largely expected given the structure. Now the market is digesting that move. Whether this turns into a base near $0.2100 or another continuation lower depends entirely on confirmation.
According to CoinCodex’s ENA price prediction, Ethena could move toward $0.1549 over the next month. If support near $0.2000 gives way, the risk shifts toward a move lower. Any real bounce, though, depends on ENA reclaiming key levels and actually holding them.
For now, this remains a bearish structure first, with any bullish outcome dependent on confirmation, not hope.
Kraken: Best crypto exchange for security & reliability
- Buy, sell, and trade 400+ cryptocurrencies with industry-leading security
- Spot, Futures & Margin trading – leverage up to 5x for advanced traders
- Earn rewards with staking on top cryptocurrencies
- 24/7 customer support and high liquidity for fast trades
- Regulated in the US with strong compliance and security measures
- 13+ million users worldwide
Disclaimer: This content is for informational purposes only and does not constitute financial, investment, or other advice. Nothing on this page is a recommendation or solicitation. Always seek independent professional advice before making investment decisions. Some links may earn us a commission at no extra cost to you.
Source:: Here’s Where Ethena (ENA) Price Could Go Next After the Bear Flag Breakdown