Key highlights:
- Ethereum maintains its position around the critical $2,000 support zone as analysts raise alarms about a possible drop to $1,900 levels.
- On-chain data shows that network usage remains strong despite price weakness.
- Daily and 4-hour charts are showing strong resistance levels around $2,300 to $2,400.
Ethereum has been having a rough time recently. The price of ETH declined in February and March as the market struggled to come to terms with geopolitical factors and various macroeconomic headwinds. Every time the asset attempted a comeback, selling pressure emerged to send the price to a series of lower highs.
Through it all, one level kept appearing in conversations. $2,000. The psychological barrier that separates optimism from despair. Analyst Ted shared on X a straightforward observation: the ETH price is still holding above $2,000, but this is a must-hold zone. Otherwise, Ethereum could drop toward the $1,900 level again.
On-chain data reveals a network in transition
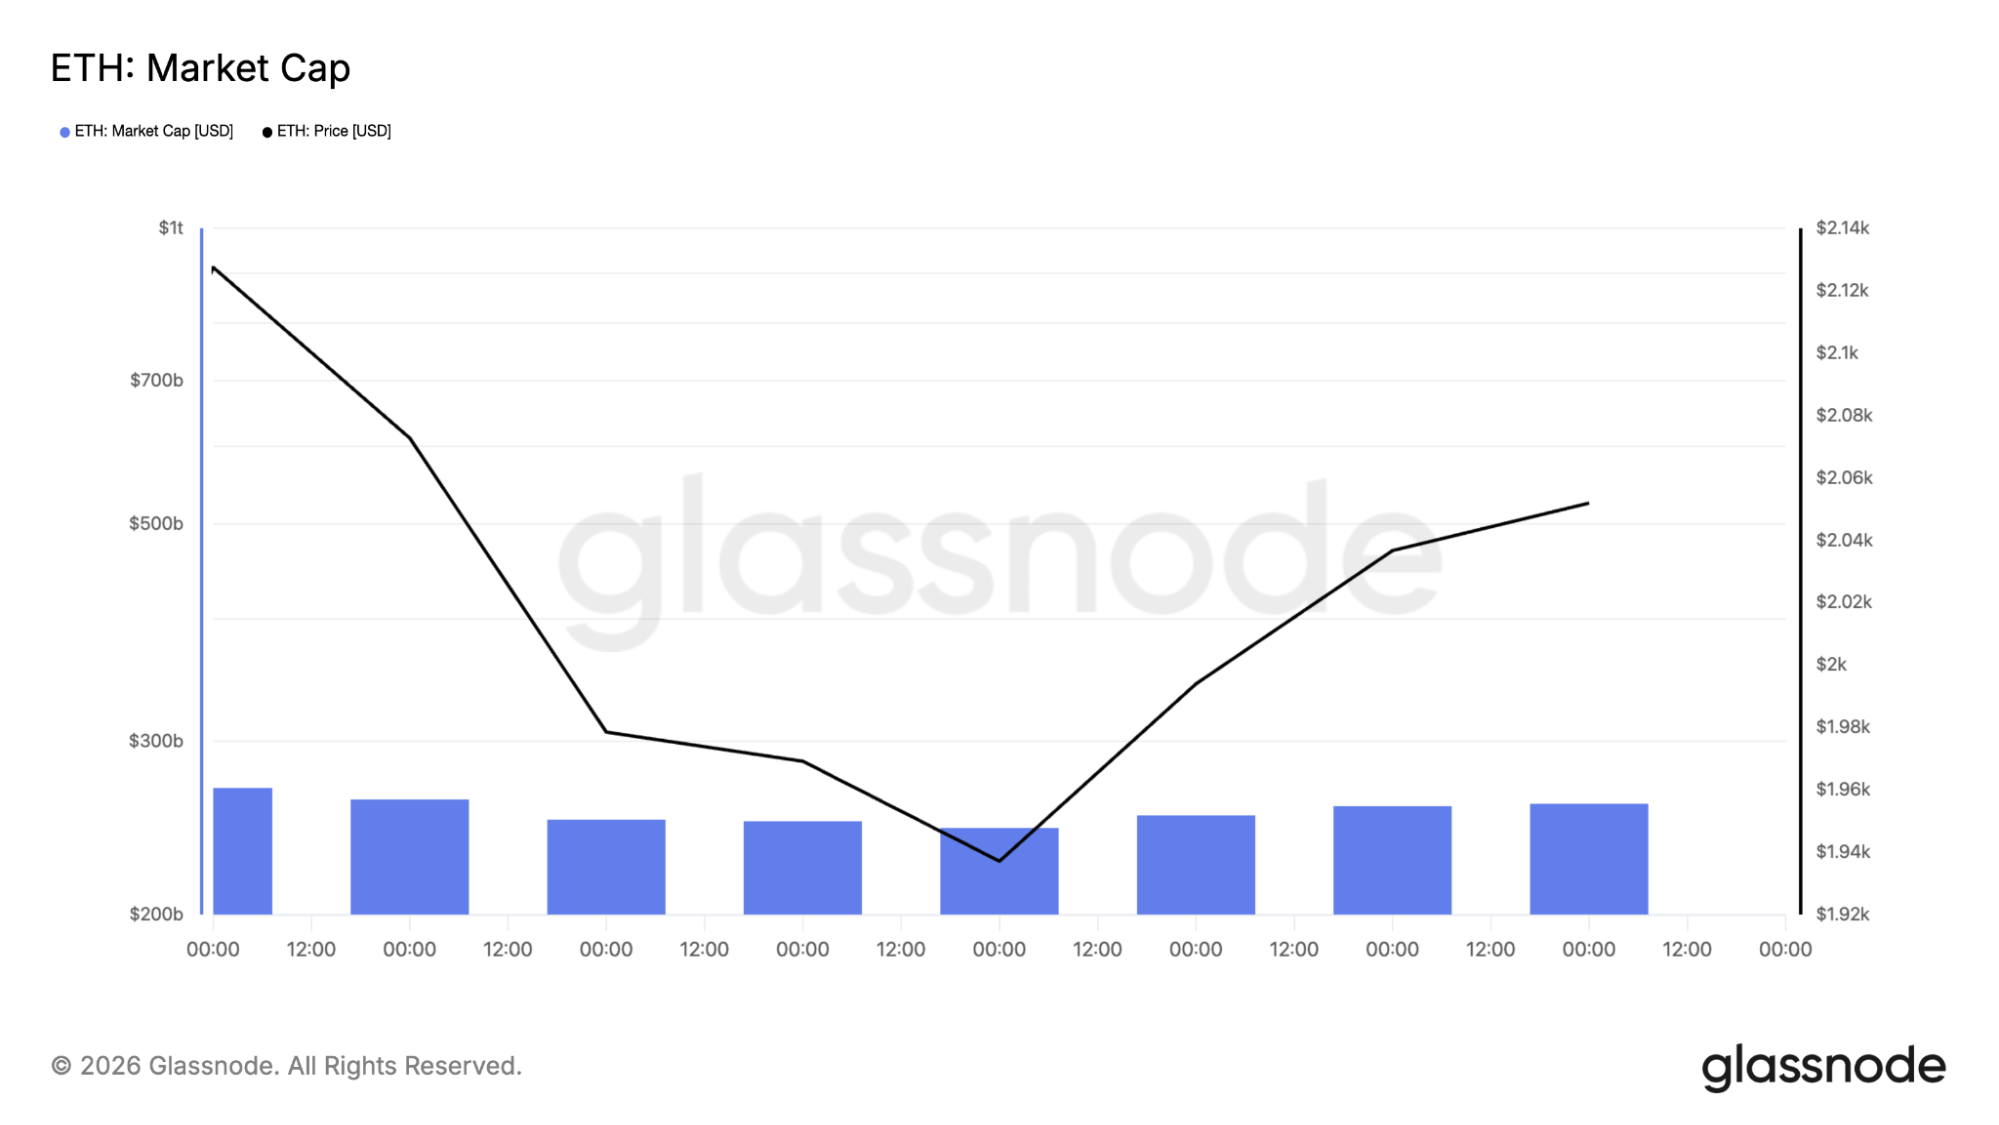
The data from Glassnode provides more depth to what we are seeing in terms of price action. For ETH, the market capitalization has been moving in a zig-zag fashion within a tight range. This indicates that traders are not taking a strong position on the asset.
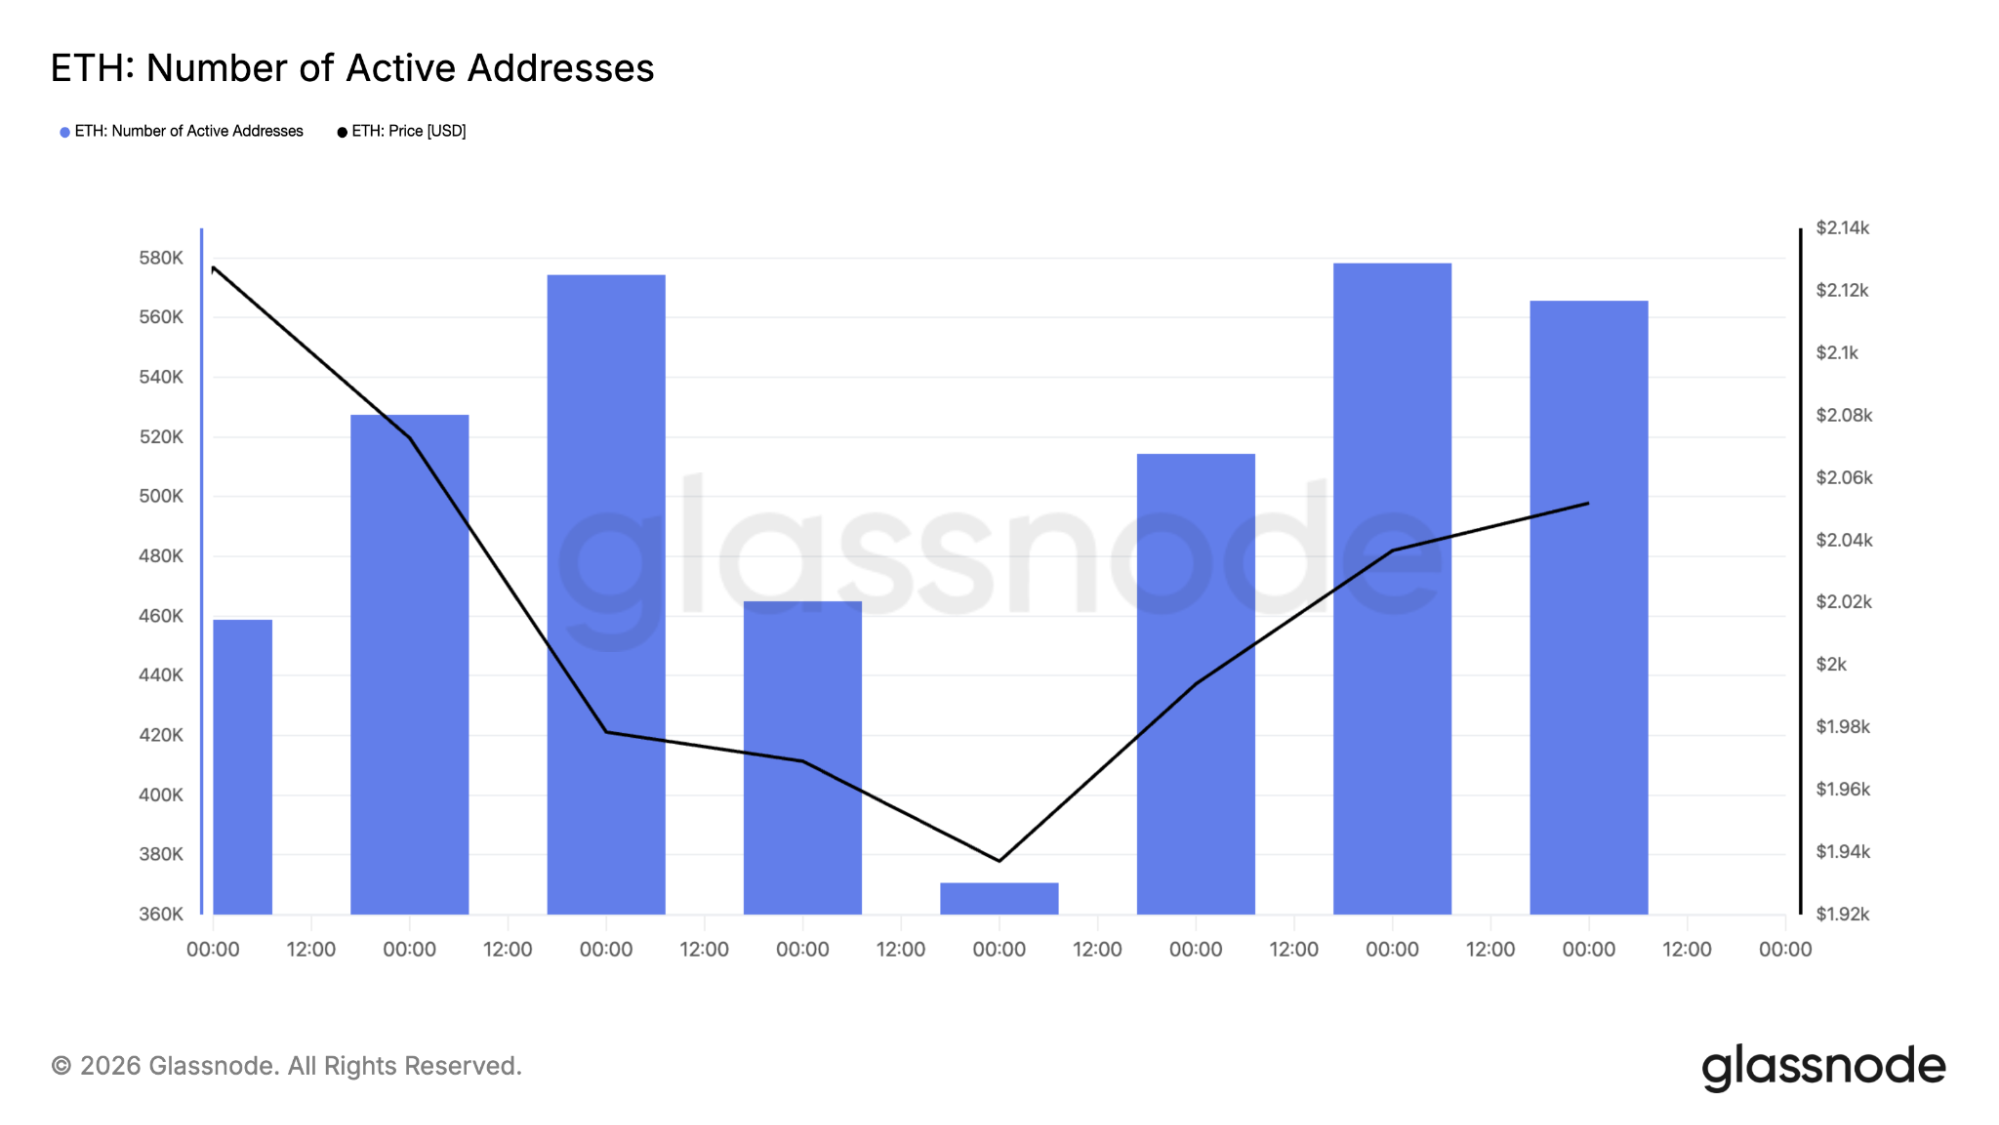
What is interesting is how the network is being utilized. For ETH, active addresses have remained between 380,000 and 520,000. This indicates that the network is being utilized even though the price is facing headwinds.
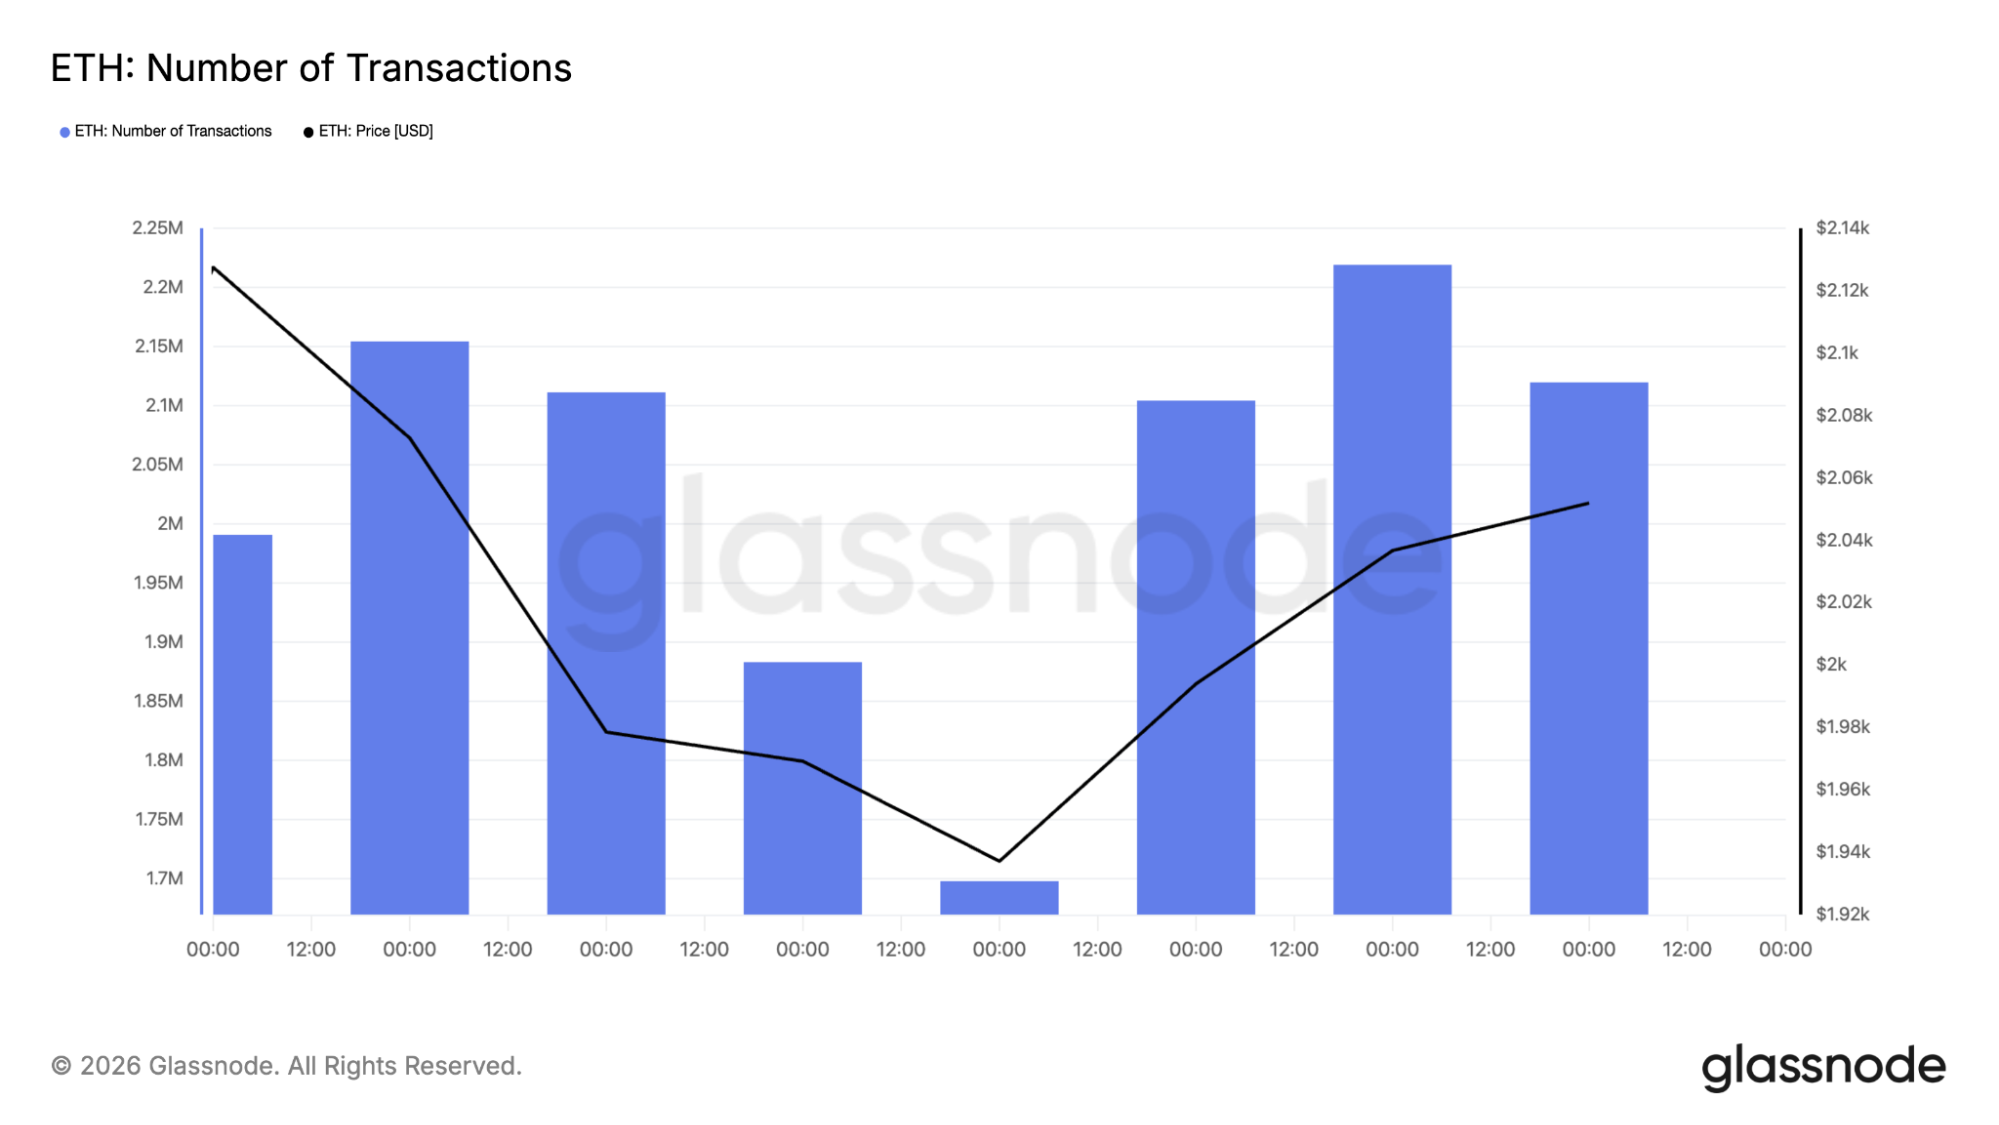
Daily transactions have remained between 1.7 million and 2.2 million. There has not been a fall in transactions during the recent sell-off. Hence, even though the market may be seeing a fall in the price of ETH due to a lack of speculative fervor, usage of the Ethereum network remains healthy.
What Ted’s analysis means for the ETH price
Ted’s observation is simple but important. The ETH price being above $2,000 leaves the door open for a possible rebound. This is because stability around this price may attract investors who are looking to invest around this key psychological price.
Once ETH gets some steam from here, the targets would be around the $2,300 to $2,400 range. However, if ETH fails to hold up above $2,000, the situation changes quite dramatically.
$ETH is still holding above the $2,000 level.
This is a must-hold zone; otherwise, Ethereum could drop towards the $1,900 level again. pic.twitter.com/56NFsFE65k
— Ted (@TedPillows) March 11, 2026
According to Ted, the next support could be around the $1,900 level. If ETH falls below $1,900, the path is paved to test the support around the $1,800 level.
The on-chain data provides some comfort. Active addresses and transaction counts remain healthy, indicating the network is not being abandoned even as price struggles. This divergence between price and usage often precedes trend changes, though timing remains uncertain.
The daily chart shows Ethereum at a crossroads
Ethereum is currently priced at $2,028.58 on the daily chart. This is a decline of 1.14% for the day. However, the 100-period simple moving average is significantly higher at $2,638.31, emphasizing the bearish picture, which has been in place since the rally from the $5,000 handle.
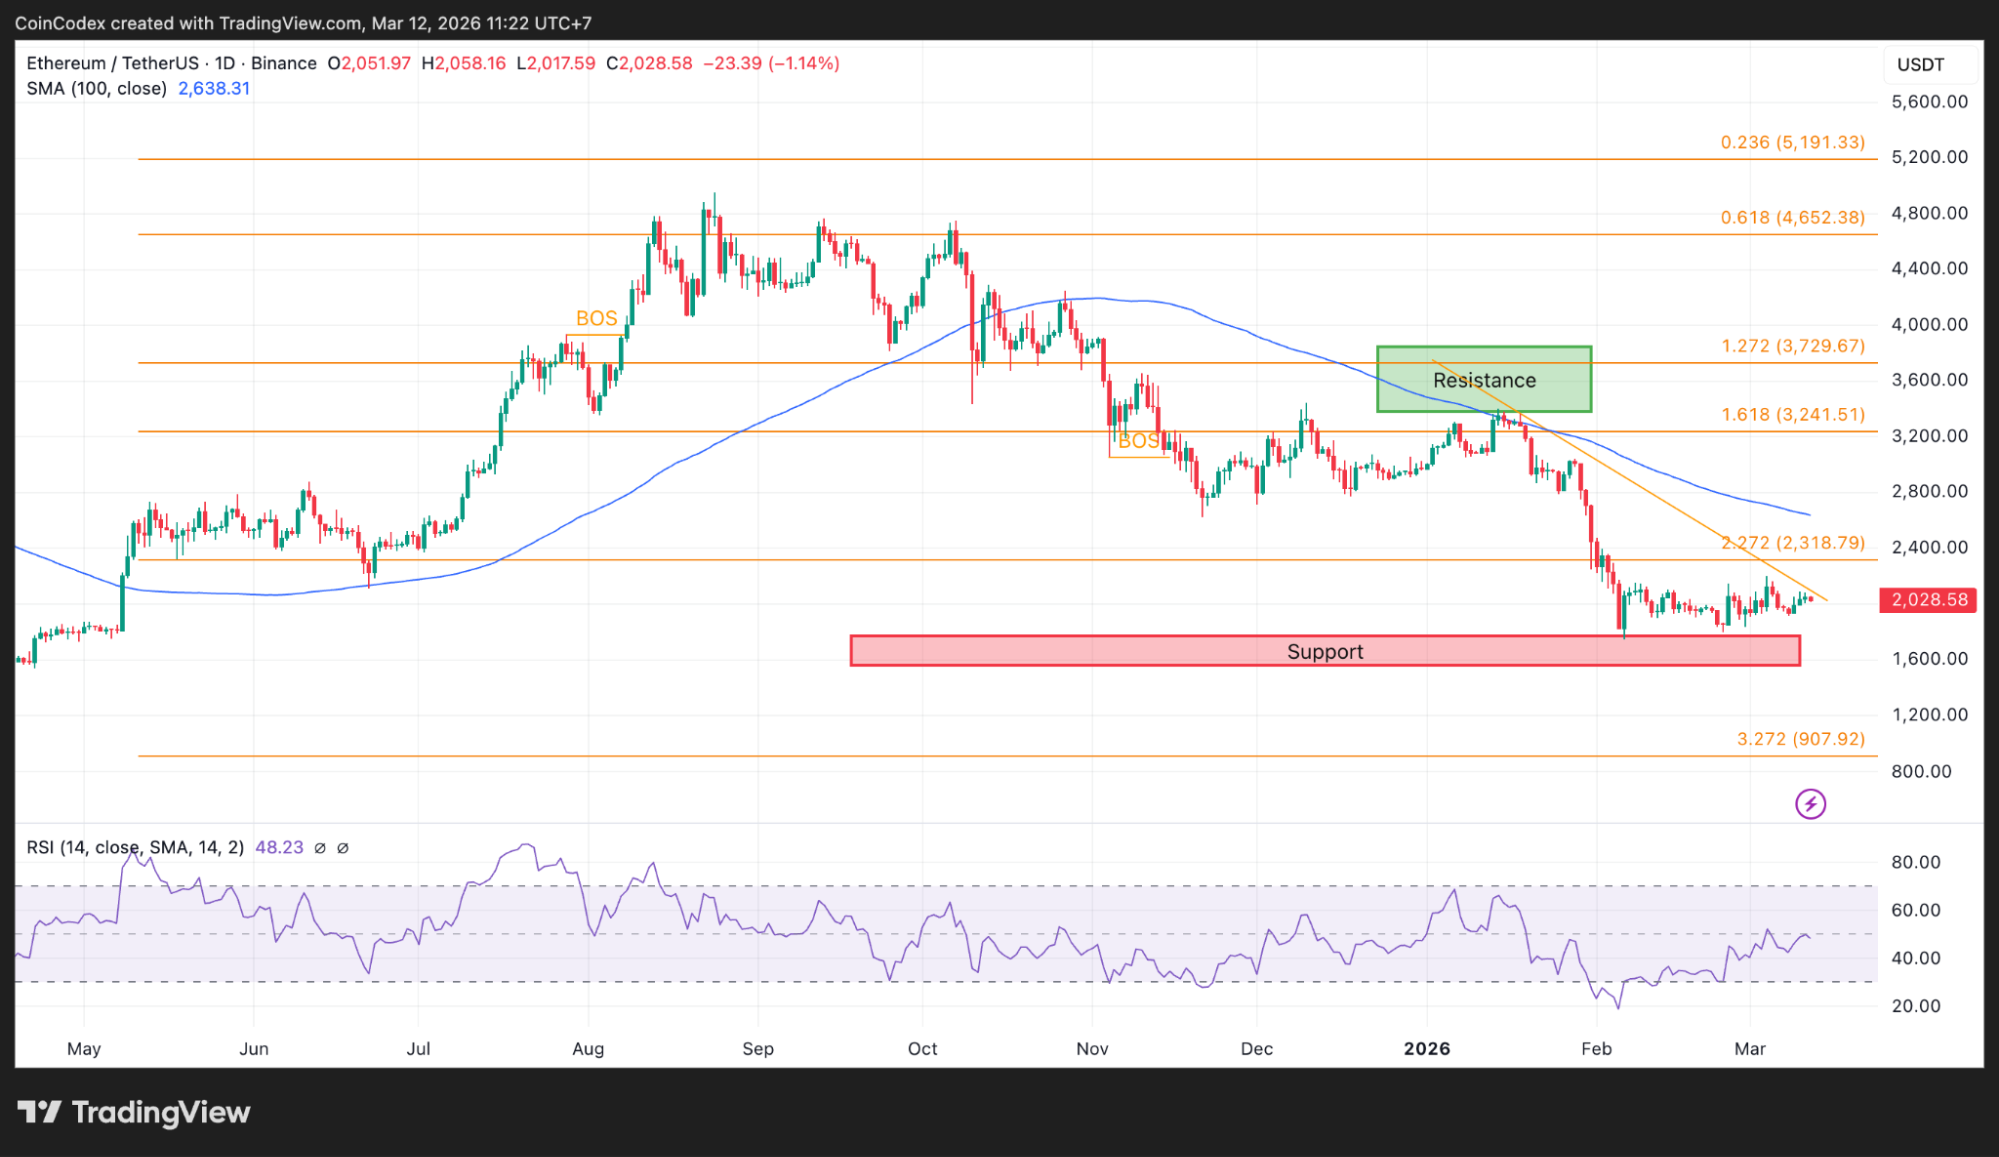
Daily ETH price chart analysis.
However, the Fibonacci levels on the chart provide the road map. The 2.272 extension sits at $2,318.79, representing immediate resistance above. Below, the 3.272 extension at $907.92 marks a distant downside target if the structure completely breaks.
The chart shows a clear break of structure (BOS) that occurred during the downtrend, with the ETH price now attempting to stabilize above support. The RSI on the daily reads 48.23, neutral and with room to move in either direction. No overbought or oversold signals here, just a market waiting for direction.
The ETH 4-hour chart reveals key levels
The 4-hour chart provides a closer look at the ongoing battle. The price of Ethereum is currently at $2,028.74 and rising by 0.26%. The 100-period simple moving average is at $1,993.32, slightly below the price. It has acted as a support during the last couple of days.
4-hour ETH price chart analysis.
Resistance above is clearly marked near $2,400 to $2,600, with the break of structure level representing the first major hurdle. Support below sits near $1,800, with the recent lows marking the zone that would come into play if $2,000 fails. The RSI on this timeframe reads 50.90, perfectly neutral and offering no clues about the next move.
Ted’s analysis focuses on the $2,000 level for good reason. This zone has acted as both support and resistance in the past, and the way the ETH price reacts here will likely set the tone for the coming weeks.
The levels that matter now
For traders watching the ETH price, the levels are clear. $2,000 is the line in the sand. Hold above it, and the bias tilts toward a grind higher toward resistance. Lose it, and $1,900 becomes the next stop, followed by $1,800 if selling intensifies.
The daily chart shows larger targets above, but those only come into play if the ETH price can reclaim structure. The 100-day SMA at $2,638 represents the first major resistance in any sustained recovery. Until then, the market remains range-bound and reactive.
The ETH price sits at a decision point where the next move could define the trend for months. Holders watch the $2,000 level with the kind of attention that only comes when everything hangs in the balance. CoinCodex’s 1-month ETH price forecast places Ethereum at $2,363, pointing to a modest rebound from current levels if that critical support holds.
Kraken: Best crypto exchange for security & reliability
- Buy, sell, and trade 400+ cryptocurrencies with industry-leading security
- Spot, Futures & Margin trading – leverage up to 5x for advanced traders
- Earn rewards with staking on top cryptocurrencies
- 24/7 customer support and high liquidity for fast trades
- Regulated in the US with strong compliance and security measures
- 13+ million users worldwide
Disclaimer: This content is for informational purposes only and does not constitute financial, investment, or other advice. Nothing on this page is a recommendation or solicitation. Always seek independent professional advice before making investment decisions. Some links may earn us a commission at no extra cost to you.
Source:: Ethereum Price Prediction: Analyst Warns $1,900 ETH Could Be Next If Support Breaks