Key highlights:
- The Ethereum price is testing the key zone of $2,950–$3,000 again, which several times acted as support and resistance this year.
- The ETH chart shows early signs of strength, but ETH needs a clean breakout above $3,000 to avoid revisiting lower support zones.
- On-chain metrics, including market cap recovery and rising active addresses indicate improving sentiment beneath the surface.
Disclaimer: Always seek independent professional advice before making investment decisions. Some links may earn us a commission at no extra cost to you.
The Ethereum price is sitting right on the edge of a level that could easily decide its next move, and the market feels it.
After tapping the $2,950–$3,000 zone again and getting rejected, ETH is back in the center of attention as traders try to figure out whether this is just a pause or the start of something deeper.
The charts are looking tense, on-chain data is starting to recover, and sentiment is slowly improving after weeks of fear. At this point everything revolves around one number: $3,000.This level has been the big dividing line for ETH all month.
If the ETH price can finally push through it with conviction, a move toward $3,400 becomes a very realistic scenario. But if it keeps failing here, another leg down is still very possible. Every candle matters now, and the charts you provided highlight exactly why the market is this focused.
$3,000 rejection still dominates the ETH chart
The ETH chart shared by TedPillows shows the main story. The ETH price has hit the $2,950–$3,000 zone several times and failed every attempt to break through.
Each rejection added to the broader downtrend that’s been developing since the start of November. Until this area is finally cleared, the risk of a deeper drop stays in play.
This region has acted like a pivot all year long. Whenever Ethereum made a big breakout, it almost always happened after reclaiming this zone. Whenever it failed, momentum turned bearish quickly.
$ETH tapped the $2,950-$3,000 zone again and got rejected.
Until Ethereum reclaims this level, the chances of a new low are high.
If ETH breaks above the $3,000 level with strong volume, expect a rally towards the $3,400 level. pic.twitter.com/cj4TiB1fXJ
— Ted (@TedPillows) November 26, 2025
Right now, the ETH price is still sitting below a tight cluster of resistance made up of supply blocks, the descending trendline, and the 100-day SMA. That’s why even with improving indicators, traders aren’t calling a reversal yet.
A strong daily close above $3,000 would flip the tone immediately. It can’t be a quick wick or a brief spike; it needs real volume, because every breakout attempt without liquidity has failed in the last two weeks.
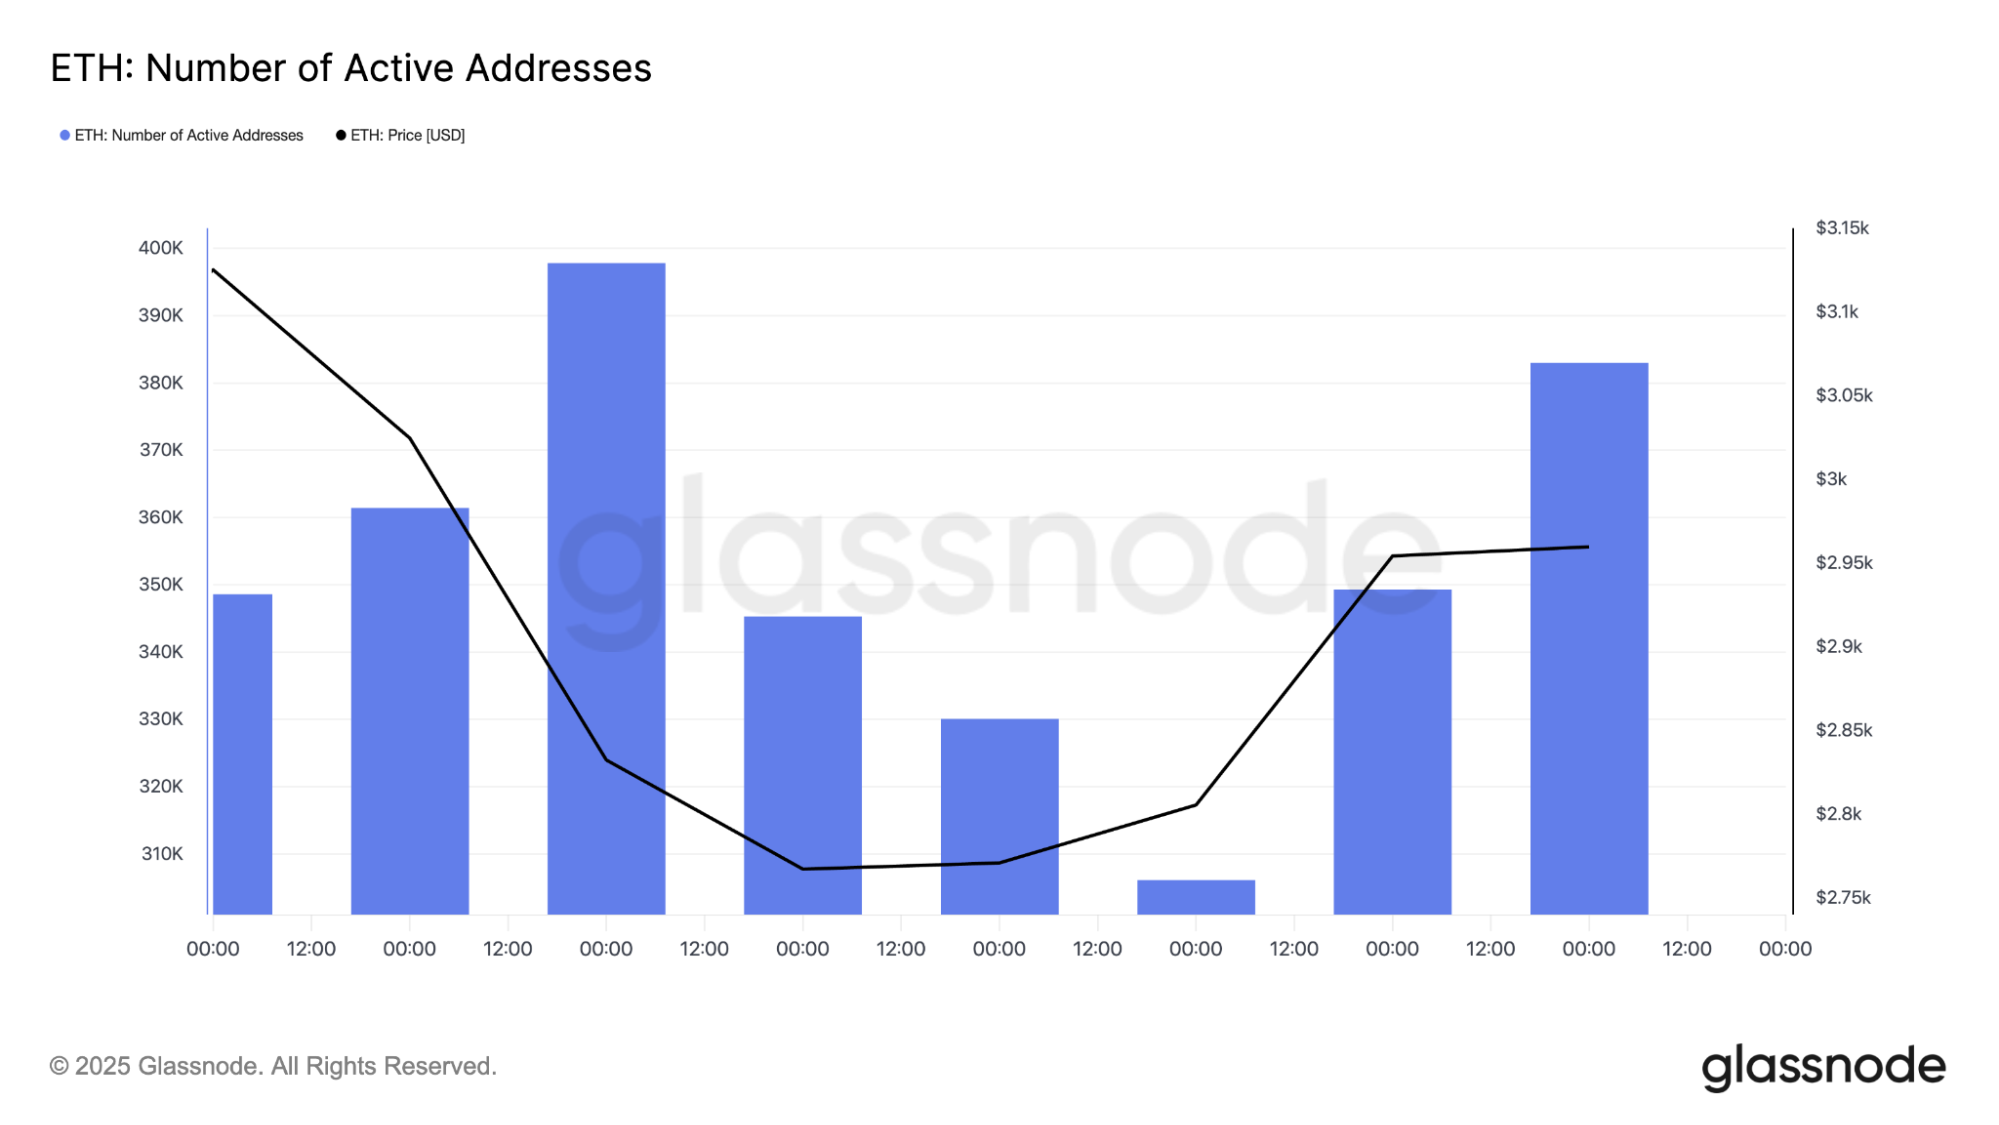
ETH on-chain data shows quiet improvement
Ethereum’s on-chain data from Glassnode is actually recovering faster than the price.
The number of active ETH addresses, one of the most important leading metrics, is ticking upward again after sliding for most of the month.
That matters because address activity often shifts before the ETH price does. When it drops, it usually signals trader exhaustion. When it rises again before price breaks out, it often marks the early stages of renewed interest.
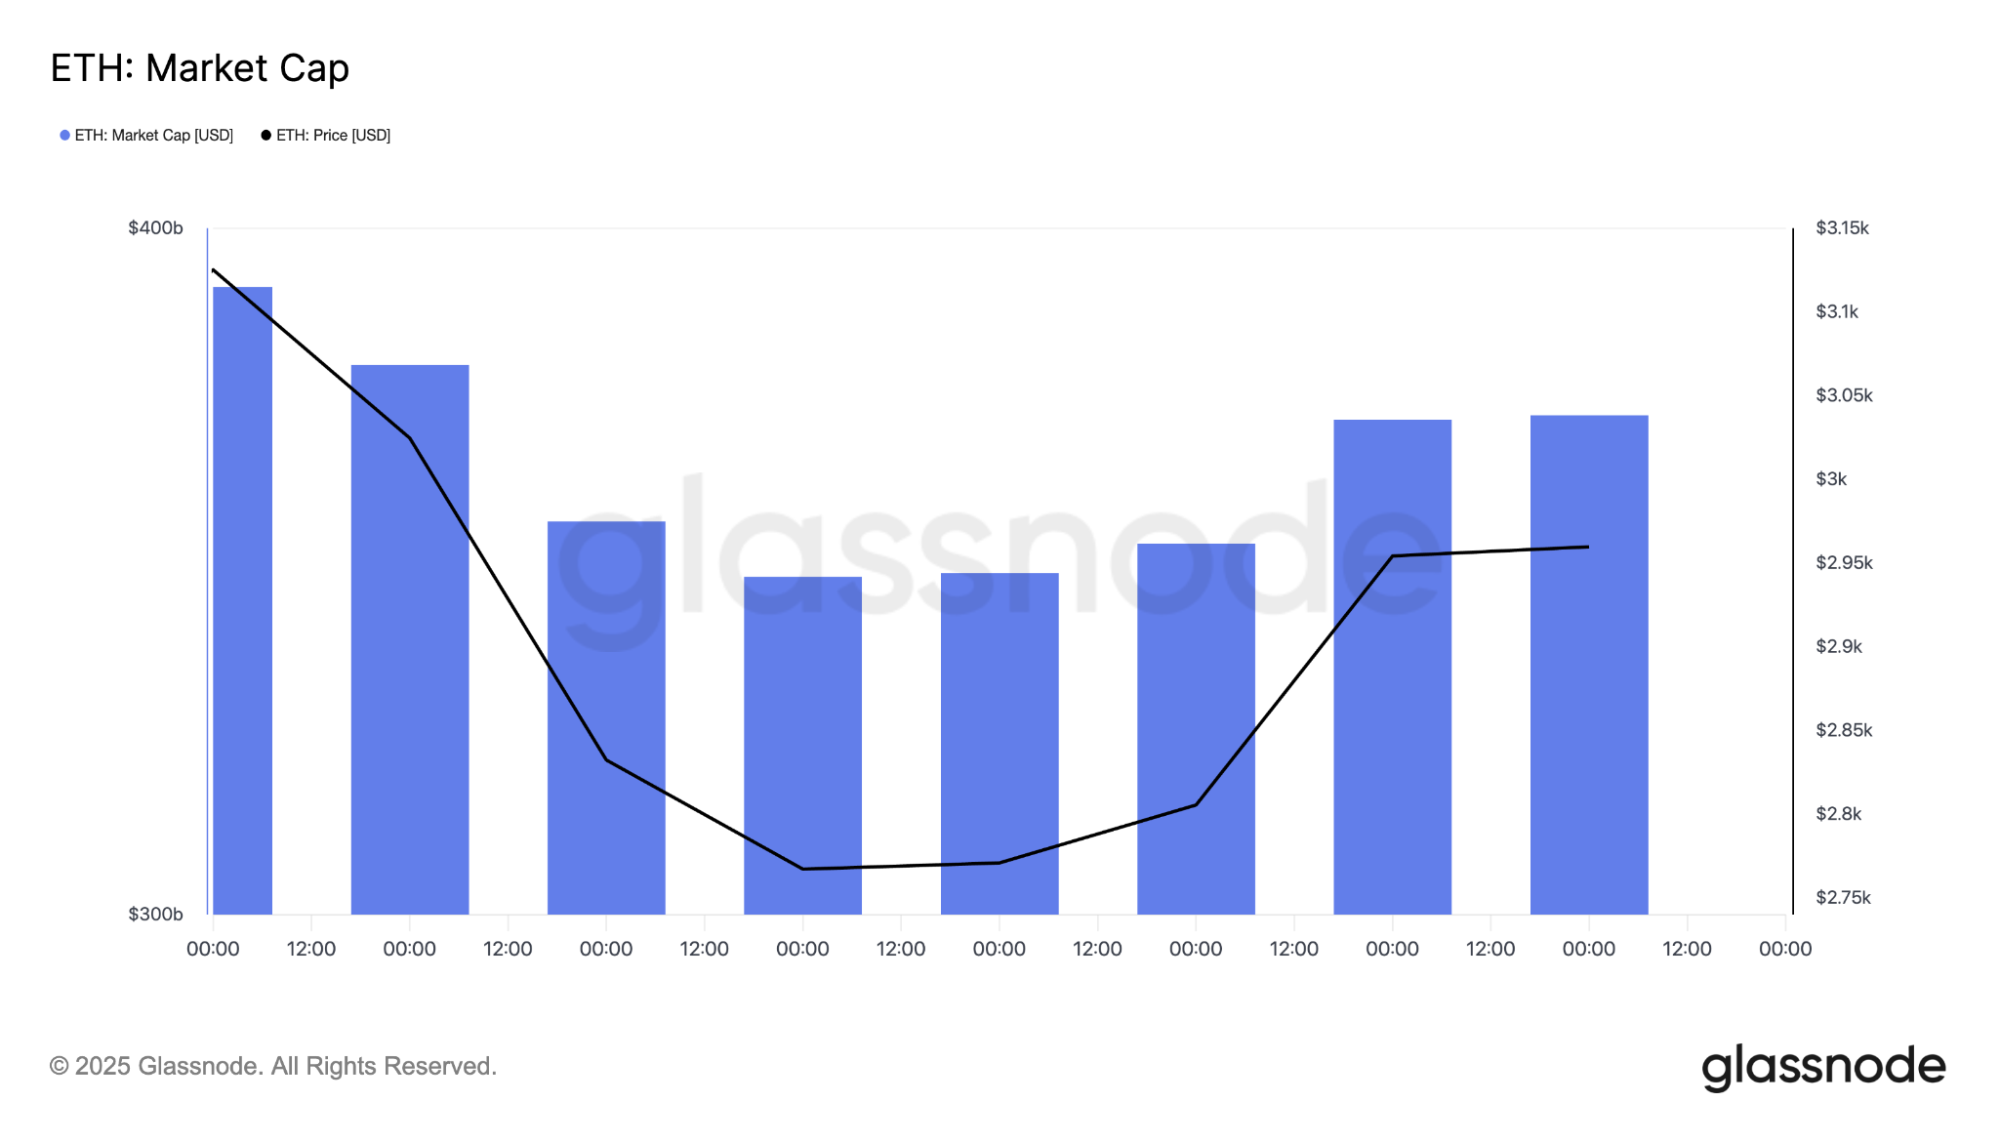
The ETH market cap bounced off last week’s lows and continues to edge higher.
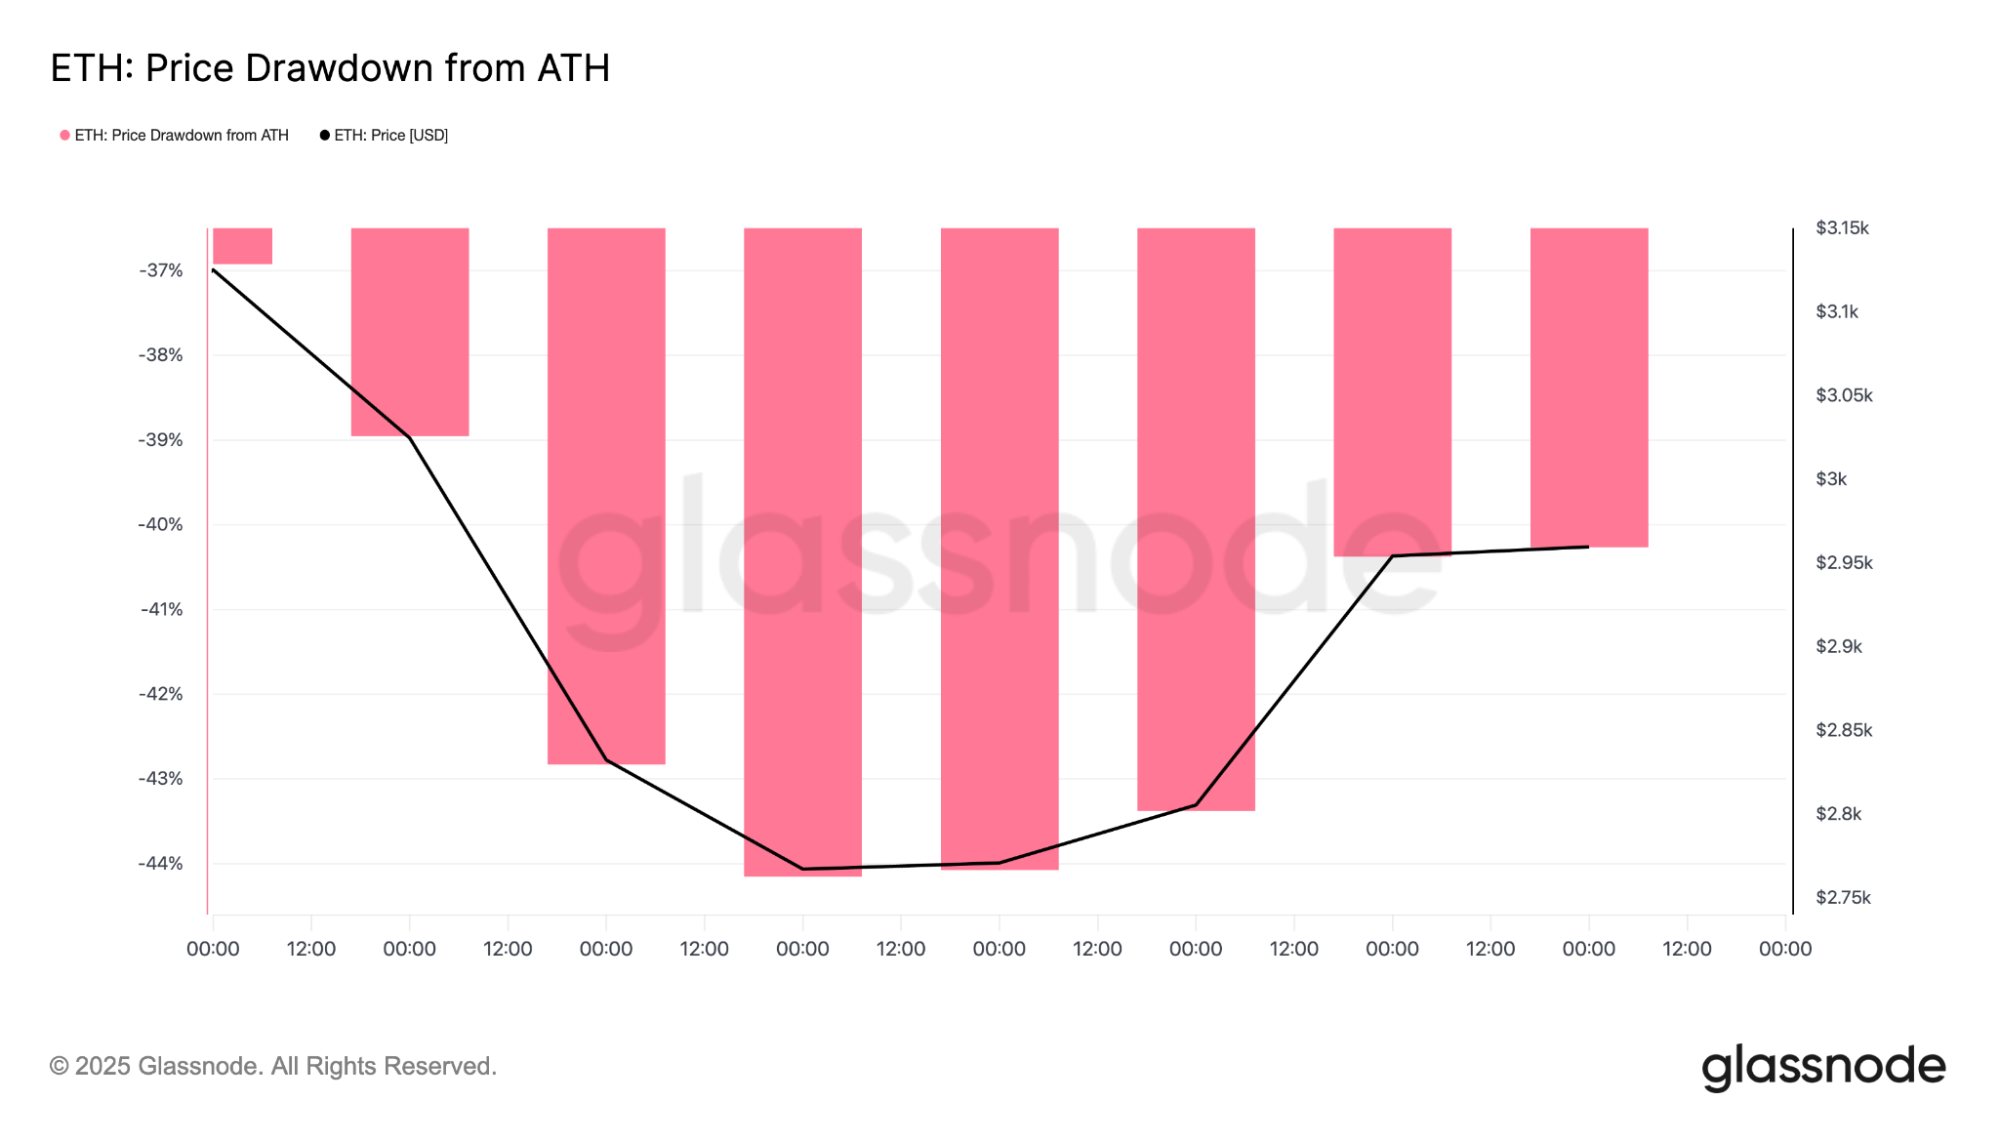
The price drawdown chart also shows recovery. ETH was nearly 44% down from its all-time high just days ago. Now the drawdown is closer to 37%. It’s not a full reversal, but it is a meaningful sign that selling pressure is cooling off.
The 4-hour chart shows Ethereum trying to shift momentum
Zooming into the 4-hour chart adds more context. ETH is pushing right against a descending trendline that has kept it pinned down all month.
Momentum signs are showing up in key places, especially with the RSI printing several small bullish divergences. The same thing happened before the previous bounce from the $2,700 area.
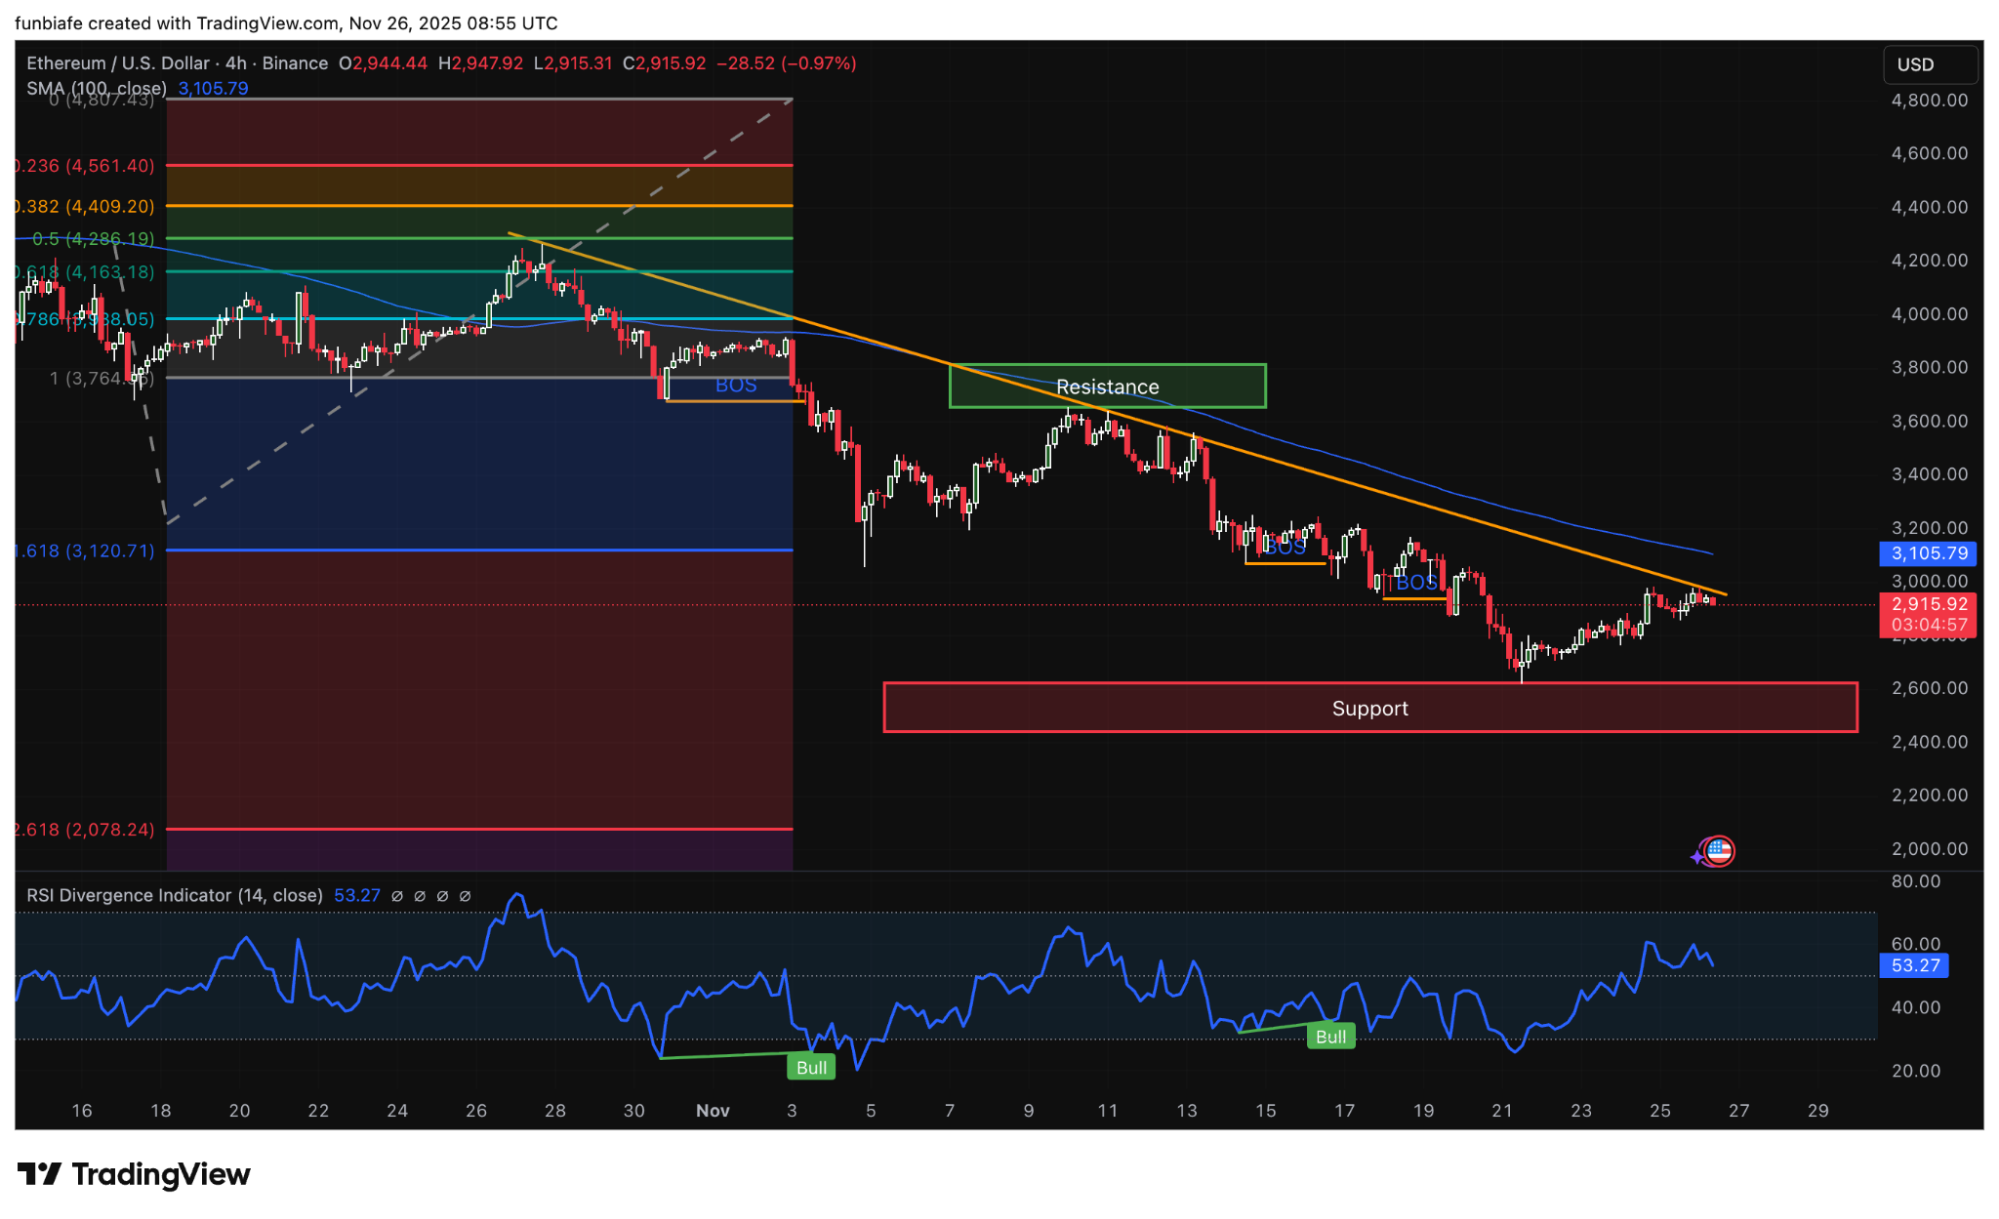
4-hour ETH price chart analysis.
The Fibonacci layout also gives a clearer target path. The ETH price already fell below the 0.618 level at $3,120 earlier, which confirmed weakness at the time. Now, if it manages to climb back toward that range, the setup changes quickly.
Reclaiming the zone between $3,000 and $3,120 opens the next major resistance at $3,400, the logical upside target if momentum continues.
On the downside, nothing changes until ETH loses $2,850–$2,900. That range acted as support multiple times this week. If it breaks, the $2,700 block will likely be tested again. A failure there exposes $2,475, which sits lower on the chart as the next heavy zone. Such a scenario would lead to a more bearish Ethereum price prediction.
The larger Ethereum trend still supports the bulls
Even with all the short-term noise, the bigger structure hasn’t broken. The daily chart shows ETH still sitting on a long-term ascending trendline that has held since early in the year.
This week’s wick hit that line almost perfectly and bounced, indicating that the long-term trend is still alive. The 200-day SMA remains above price at $3,514, but that’s not a deal-breaker.
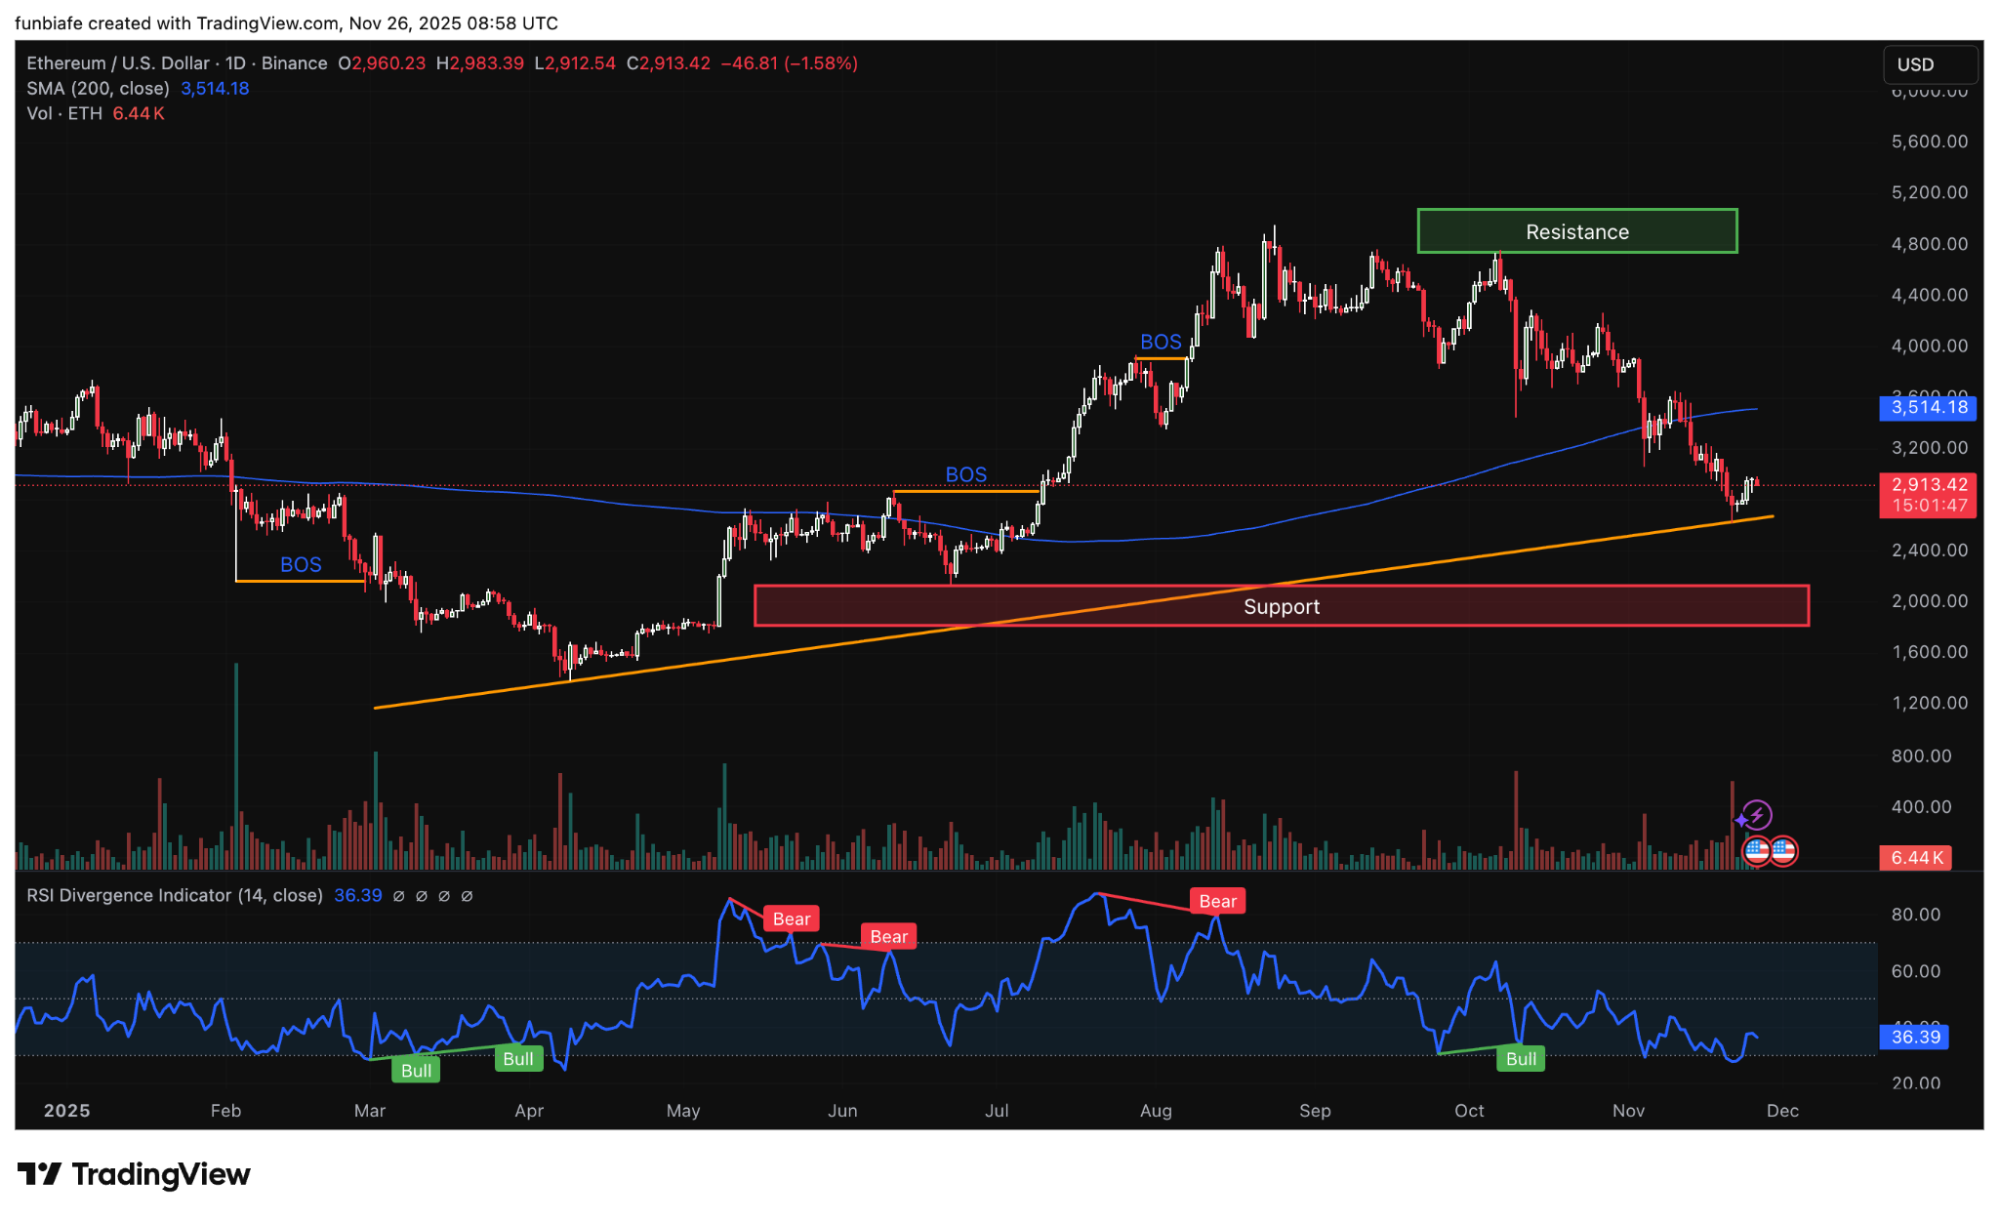
Daily ETH price chart analysis.
ETH simply needs to reclaim the lower structure first before it can think about challenging long-term confirmation levels. The RSI on the daily timeframe is recovering from oversold conditions, and the weekly RSI is flattening rather than falling. Barely any momentum looks aggressively bearish at this point, which usually hints at a stabilization phase.
What ETH needs to do from here
The next steps are simple but extremely important. ETH first needs to protect the $2,850 – $2,900 area. This zone has been the cushion several times, and losing it would reopen the path to $2,700.
If the price of ETH sinks below that, traders are going to look for the $2,475 area again. Then, everything shifts toward $3,000.
Ethereum doesn’t just need to touch it. It needs to break above it cleanly with volume. A strong daily candle above this level would instantly change the tone and turn the trend back in favor of the bulls.
If it does, then $3,120 becomes the next checkpoint. If this area flips as support, $3,400 becomes the next obvious upside target.
If the price of ETH continues to fail at $3,000 with weak volume, then the market will likely drift back toward the trendline for another retest. One more failed bounce could trigger a deeper move.
What’s next for Ethereum?
Ethereum is currently at one of the most critical moments that it has faced in weeks. The price is in recovery, on-chain metrics are trending upwards, and the higher time frames are still maintaining their trendline.
In addition to the technical and on-chain indicators, Ethereum is also quickly approaching a key fundamental milestone, as the Fusaka upgrade is scheduled to launch on December 3.
On top of all that, Bitmine Immersion (BMNR) has continued aggresively purchasing ETH despite nursing a substantial paper loss.
But none of that turns into real bullish momentum unless the ETH price can reclaim $3,000 with conviction.
If it does, then $3,400 becomes the next logical destination. If it doesn’t, the price will likely retreat to recent support levels before attempting another breakout.
Kraken: Best crypto exchange for security & reliability
- Buy, sell, and trade 400+ cryptocurrencies with industry-leading security
- Spot, Futures & Margin trading – leverage up to 5x for advanced traders
- Earn rewards with staking on top cryptocurrencies
- 24/7 customer support and high liquidity for fast trades
- Regulated in the US with strong compliance and security measures
- 13+ million users worldwide
Disclaimer: This content is for informational purposes only and does not constitute financial, investment, or other advice. Nothing on this page is a recommendation or solicitation. Always seek independent professional advice before making investment decisions. Some links may earn us a commission at no extra cost to you.
Source:: Ethereum Price Analysis: Here's What to Expect If ETH Breaks Back Above $3,000