Key highlights:
- ETH is still stuck in a wide range of $2,600 to $3,350, which indicates that we’re in a low-conviction zone.
- The short-term charts indicate selling pressure, but we also need to see how the daily structure resets.
- On-chain data remains steady, helping explain why ETH finds interest near major support despite ongoing price pressure.
Ethereum keeps doing the same thing it’s been doing for weeks now, moving sideways inside a wide range where the middle offers very little clarity.
Just a glance at the chart shows you resistance at $3,350 and support at about $2,600. Currently, Ethereum’s price is at a point in the market that’s closer to the lower end, fluctuating between the high $2,700s and just below $3,000, depending on the timeframe you’re looking at.
What a “bullish deviation” would actually look like for Ethereum
The 12-hour chart shared by Sjuul points to the idea of a bullish deviation near the range low. In plain terms, that event happens when the price just dips below a significant support level, triggers some stop-loss orders, and then shoots back over it quickly.
$ETH remains in this seemingly endless range.
There’s not much to do in the middle.
Either wait for a proper breakout above $3350 or for a dip to the range low.
Remember, money is made in the waiting! pic.twitter.com/gJy0rZlrHY
— Sjuul | AltCryptoGems (@AltCryptoGems) January 29, 2026
When that happens, it often catches traders off guard who are on the wrong side of the market. For ETH, this scenario really only matters near $2,600. Buyers would need to defend that level, absorb the selling pressure, and then push the ETH price back above broken support zones.
Without that reclaim, any bounce would likely remain corrective rather than turning into a full reversal. If ETH does manage to hold $2,600 and start printing higher lows again, the next real test is still the range high at $3,350.
On-chain data adds more context
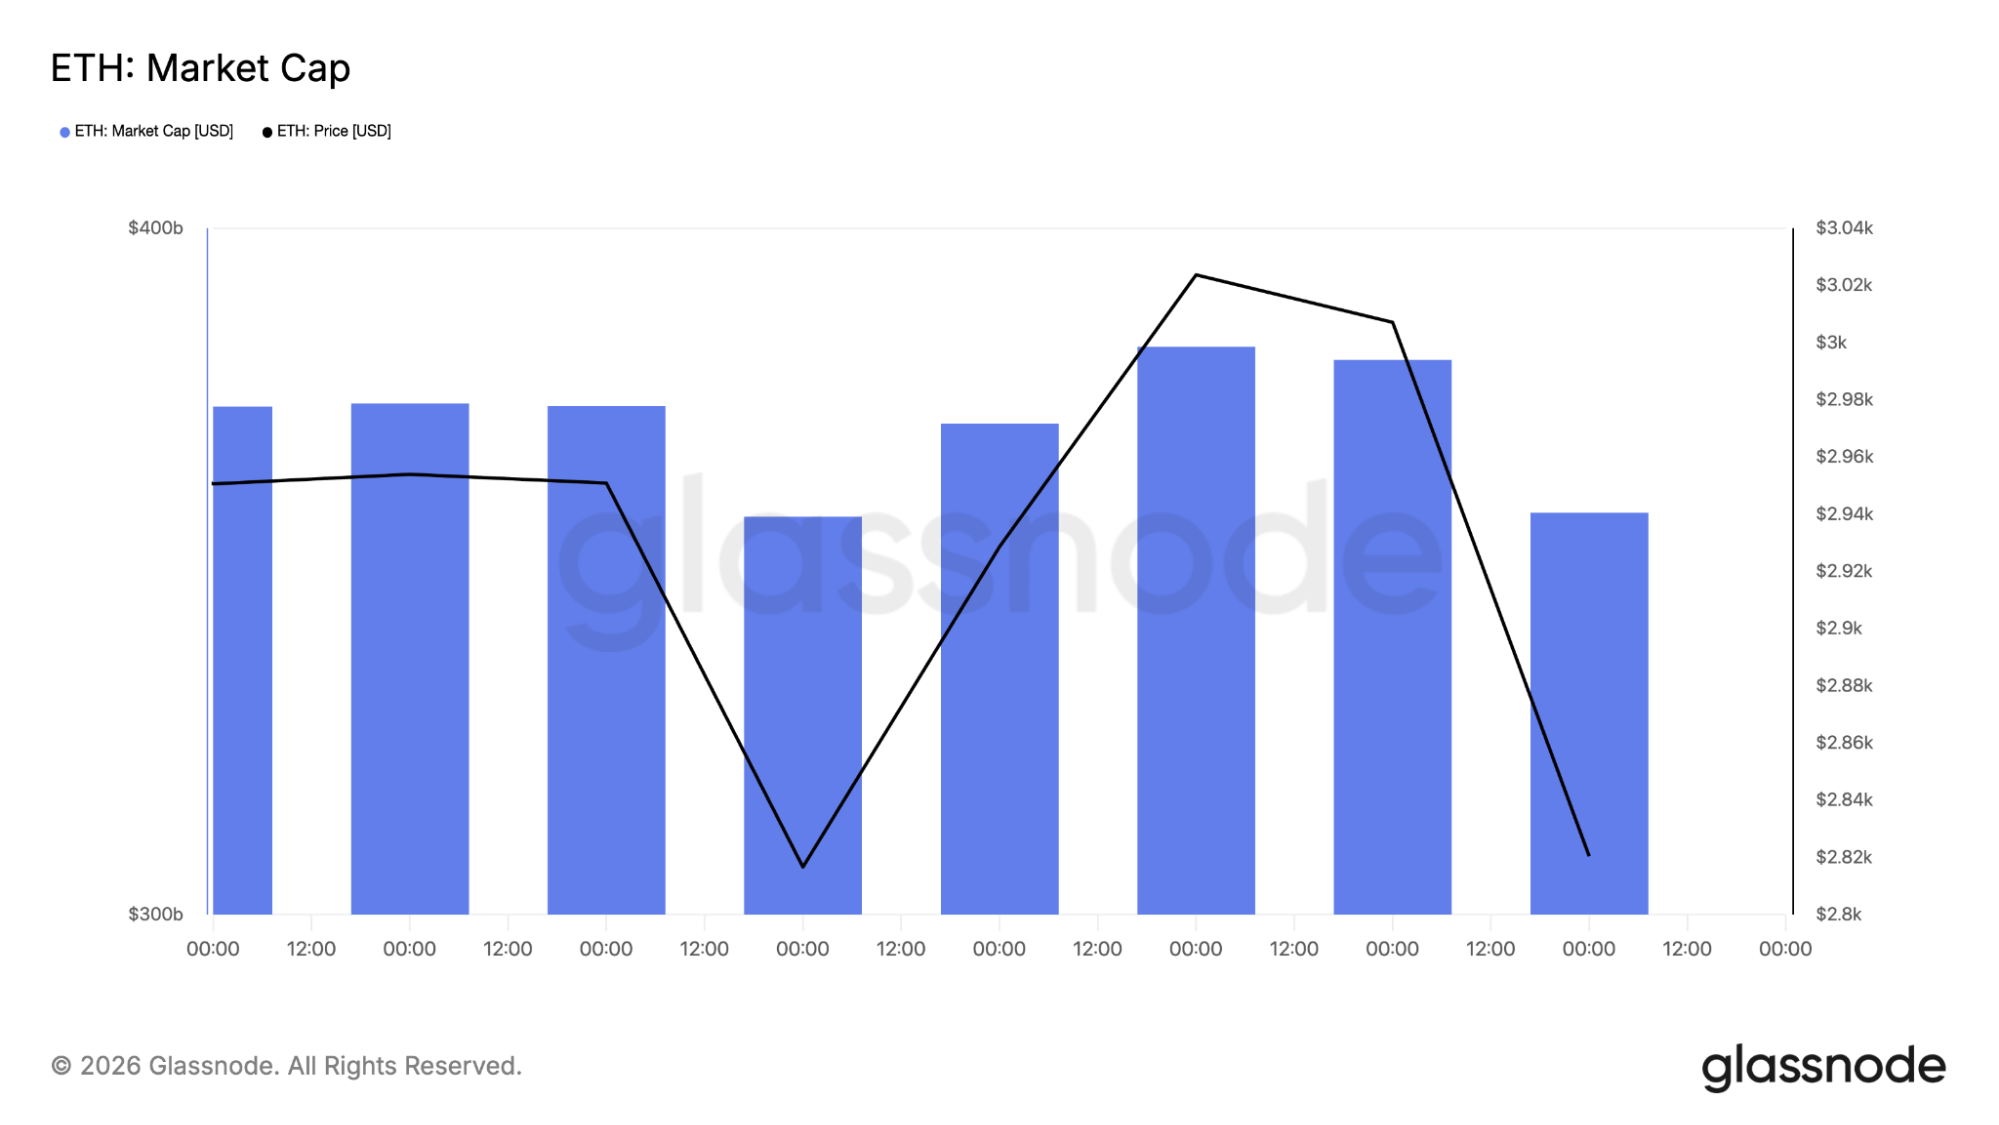
The on-chain data helps put the recent ETH price action into perspective. Even though price has been sliding, Glassnode data shows that Ethereum’s market cap hasn’t really fallen apart. It has pulled back, but for the most part it’s been moving sideways, which indicates capital isn’t rushing out of the network.
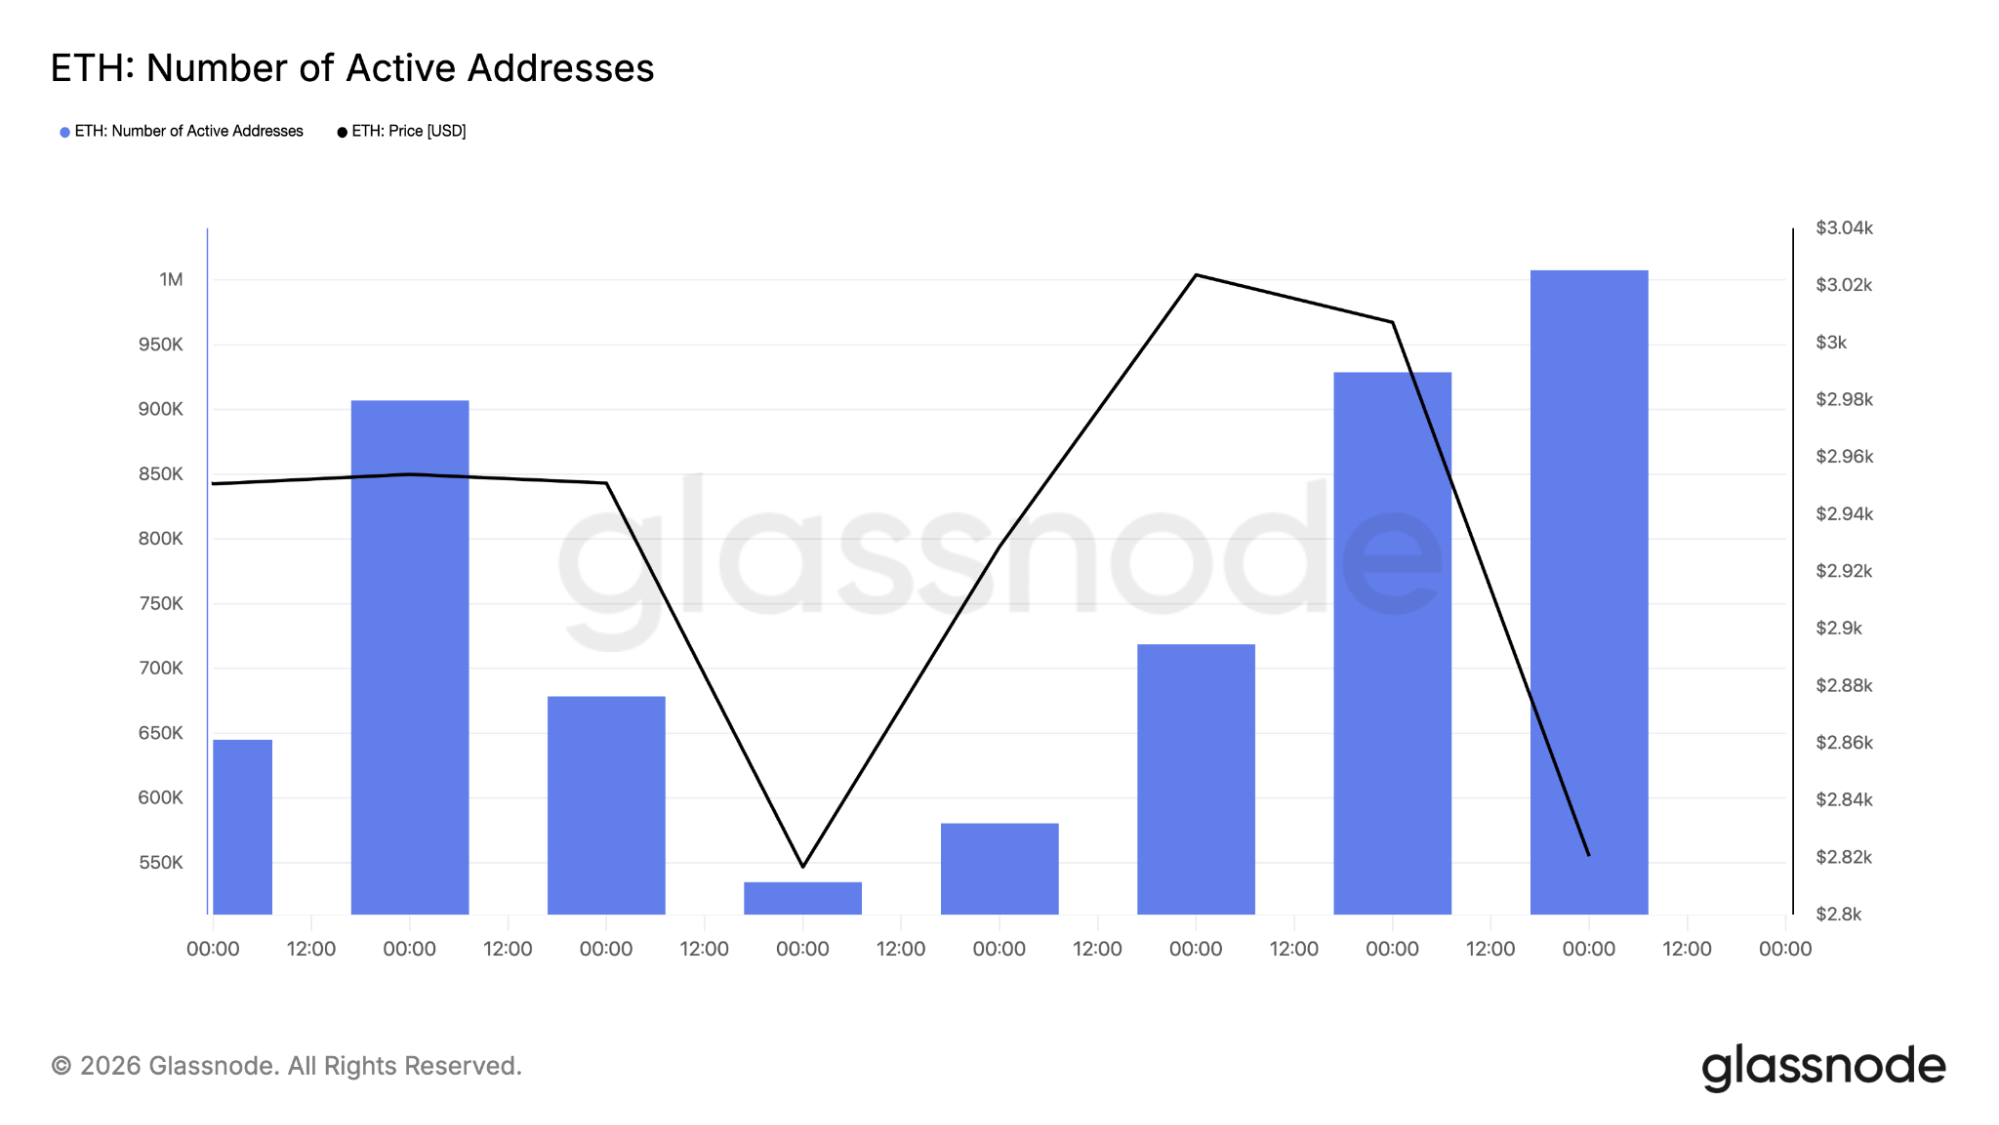
Looking at active addresses tells a similar story. The usage, however, hasn’t dried up. In fact, the number of active addresses on the network has remained more or less consistent, and there have been periods of increases in the face of the price struggle.
Transaction counts back that up. Activity on Ethereum continues, with transactions holding at consistent levels instead of collapsing. This points to real demand still being there, even if traders are hesitant in the short term.
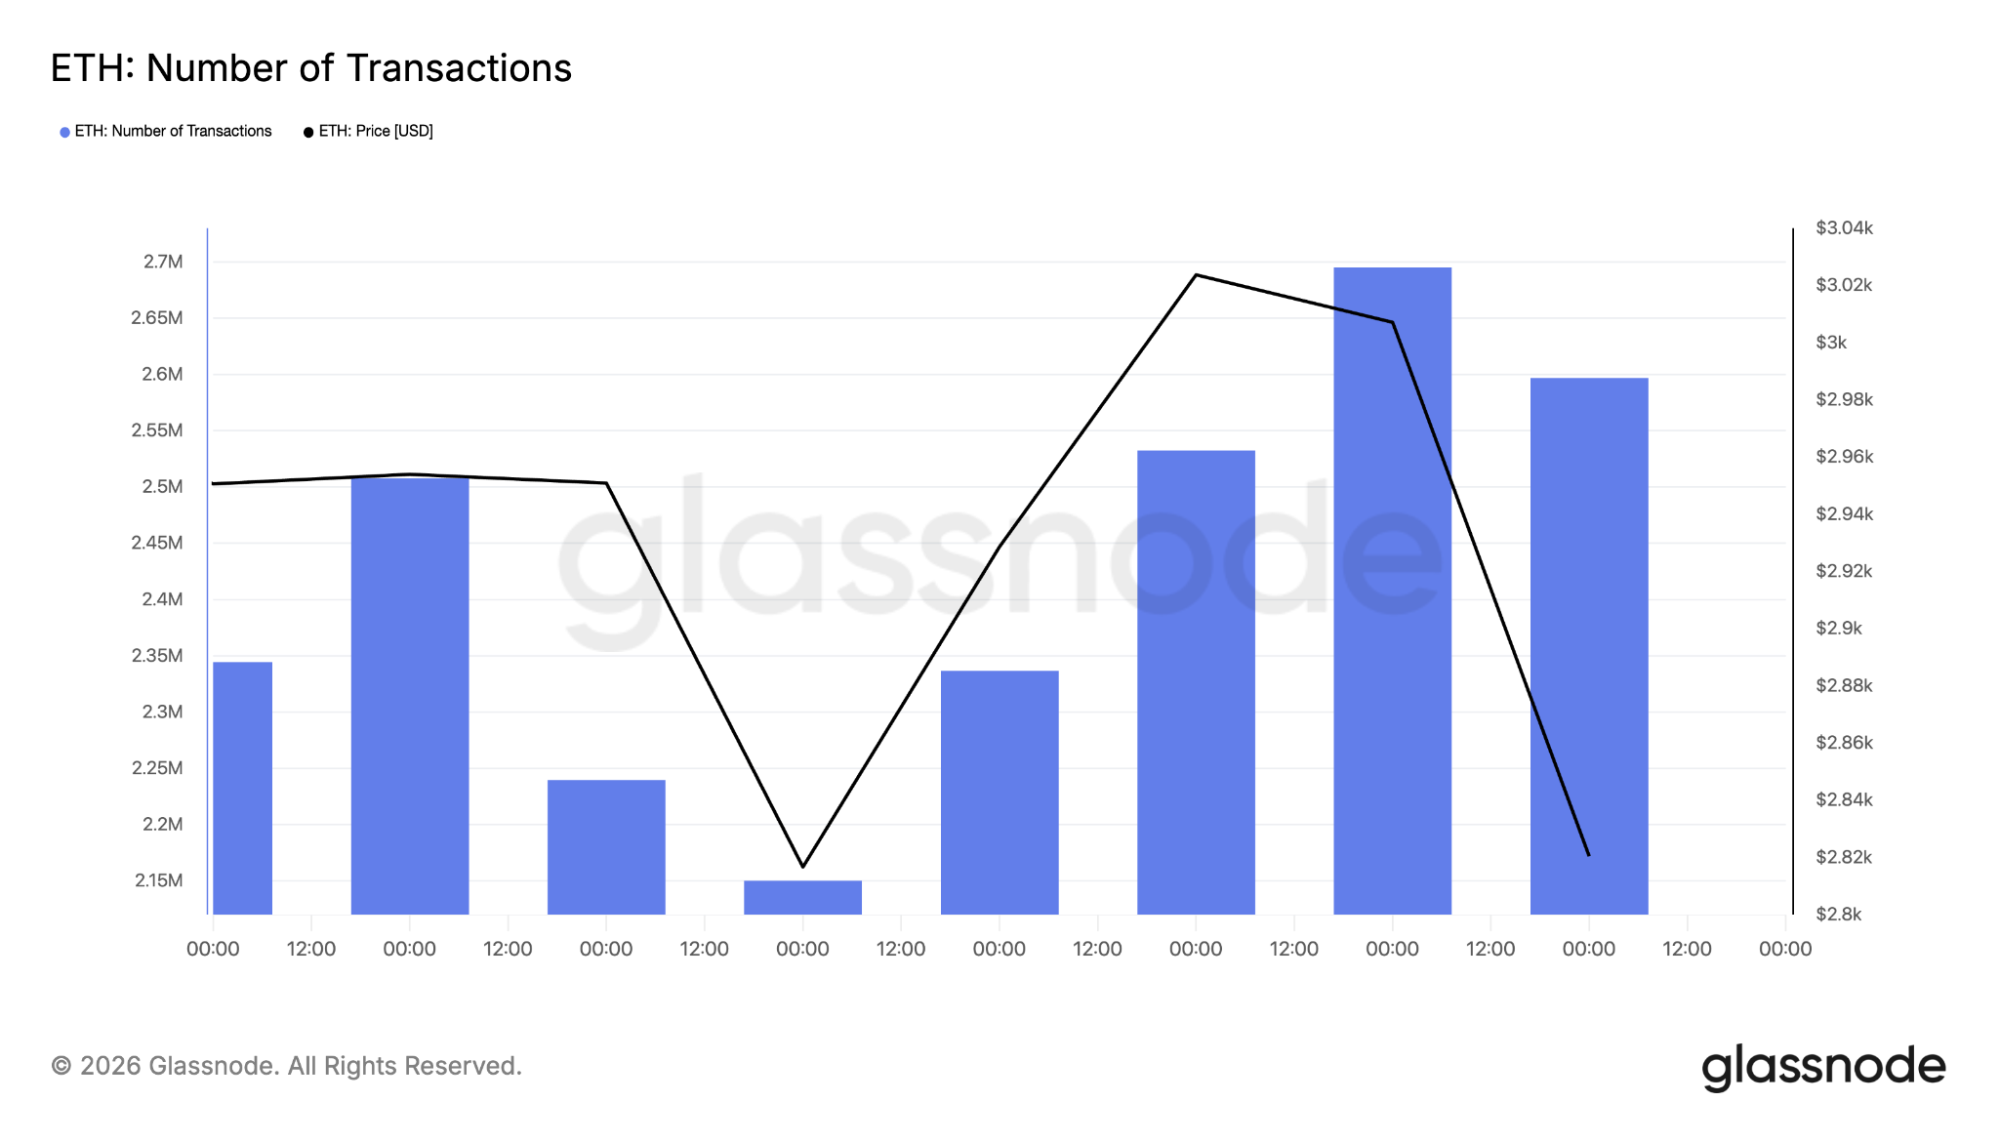
Put together, these on-chain signals indicate this move is more of a pause than a breakdown. It doesn’t mean ETH has to bounce right away, but it helps explain why price often finds buyers near major support levels.
Short-term pressure shows up on the 4-hour ETH chart
When you zoom into the 4-hour chart, the recent weakness becomes much more obvious. The ETH price dropped from the $2,800 area, printed a low near $2,689, and then settled closer to $2,740. That’s not just a slow drift lower. It shows that sellers are still active in the market.
Above price, Ethereum is also running into a major technical barrier. The 100-period SMA on the 4-hour chart sits around $3,087, lining up with an area that used to act as support and is now acting as resistance.
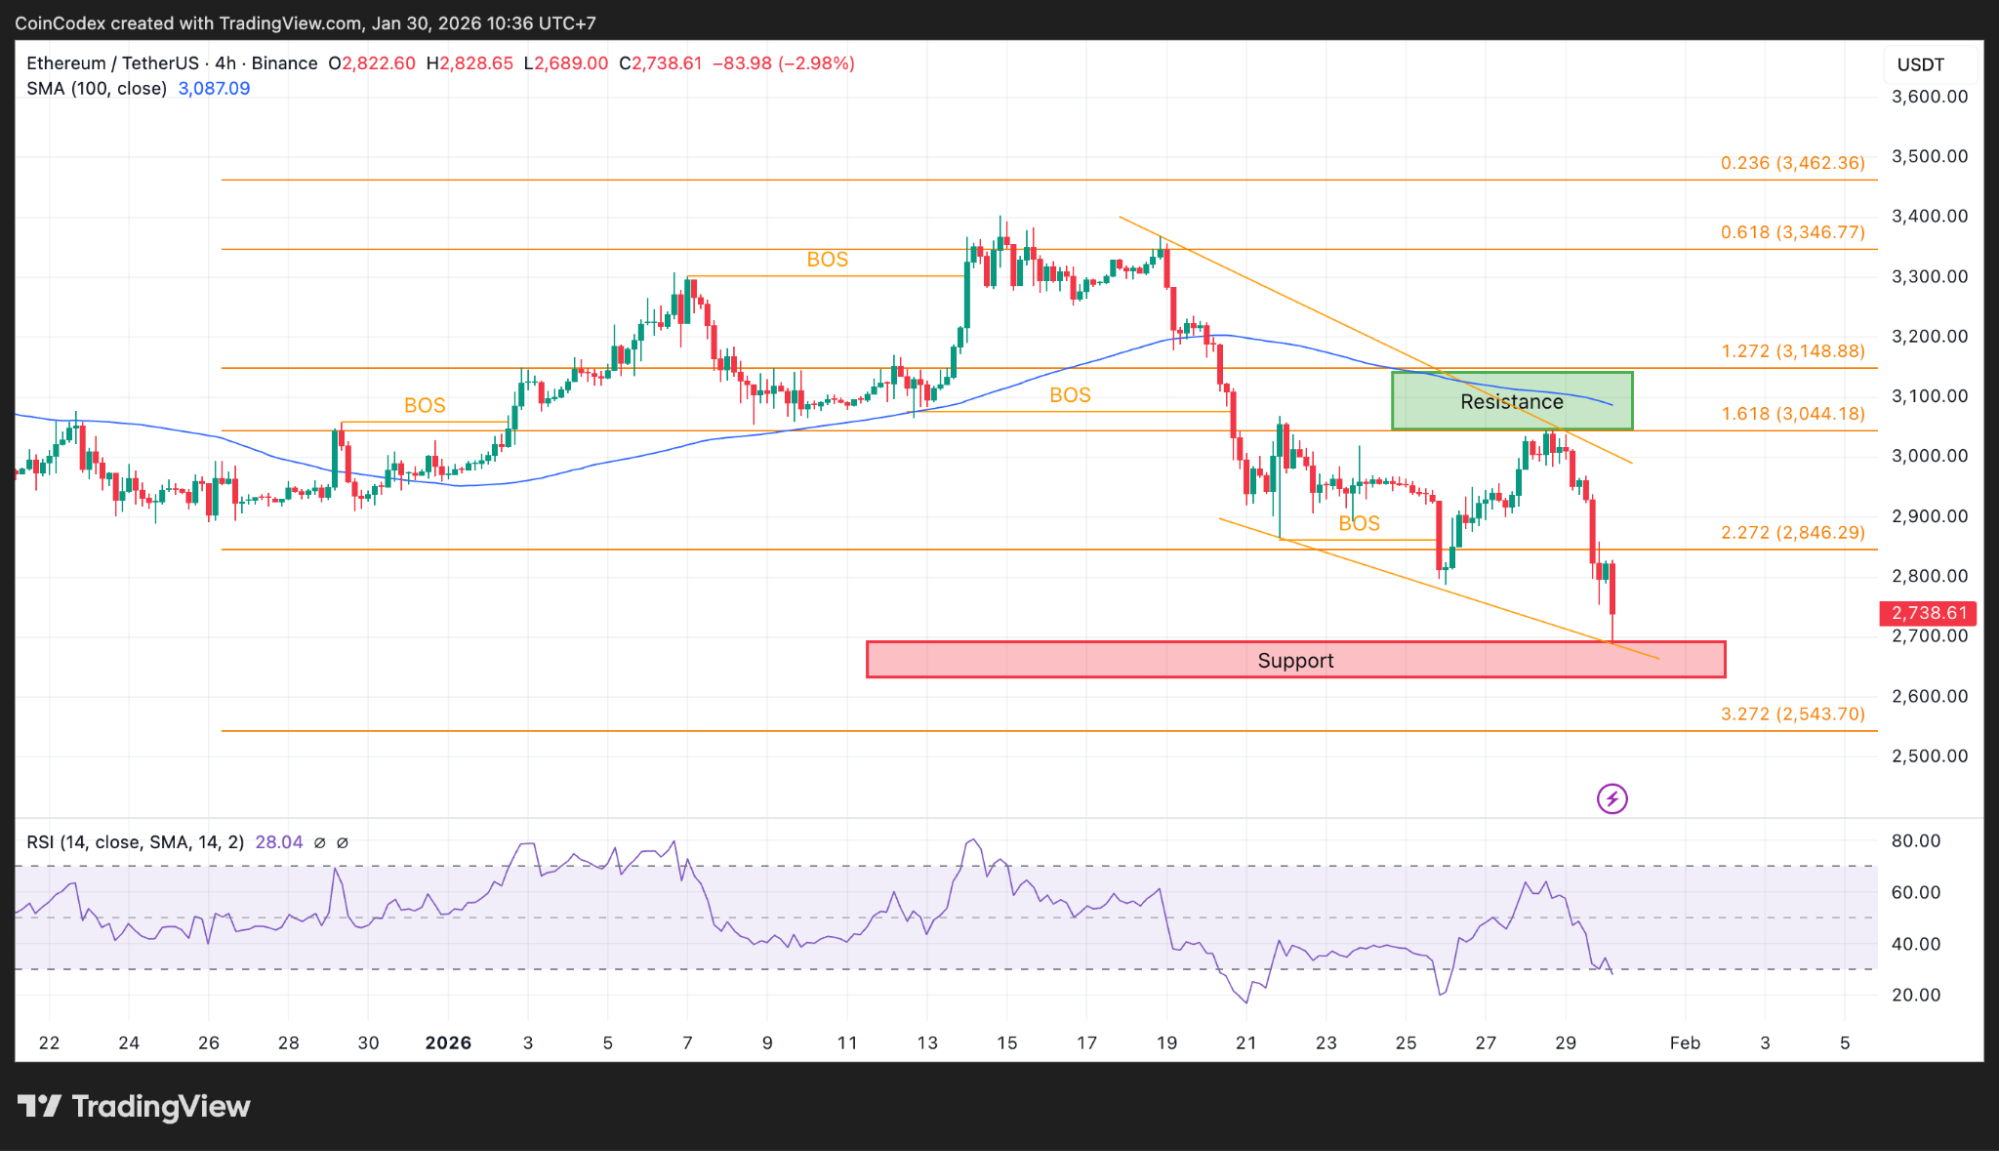
4-hour ETH price chart analysis
RSI adds another piece to the puzzle. On the 4-hour timeframe, RSI has dropped to around 28, which puts it firmly in oversold territory. That doesn’t mean price has to reverse immediately, but it does indicate selling pressure has been intense. If sellers start to back off, short-term relief bounces become more likely.
The ETH daily chart confirms the bigger trend is still weak
However, if we move to the daily chart, we can understand the scenario better. Ethereum is still trading much lower compared to its long-term trend indicator, as its 200-day simple moving average is around $3,670. This indicates how low Ethereum has fallen since its latest significant price surge.
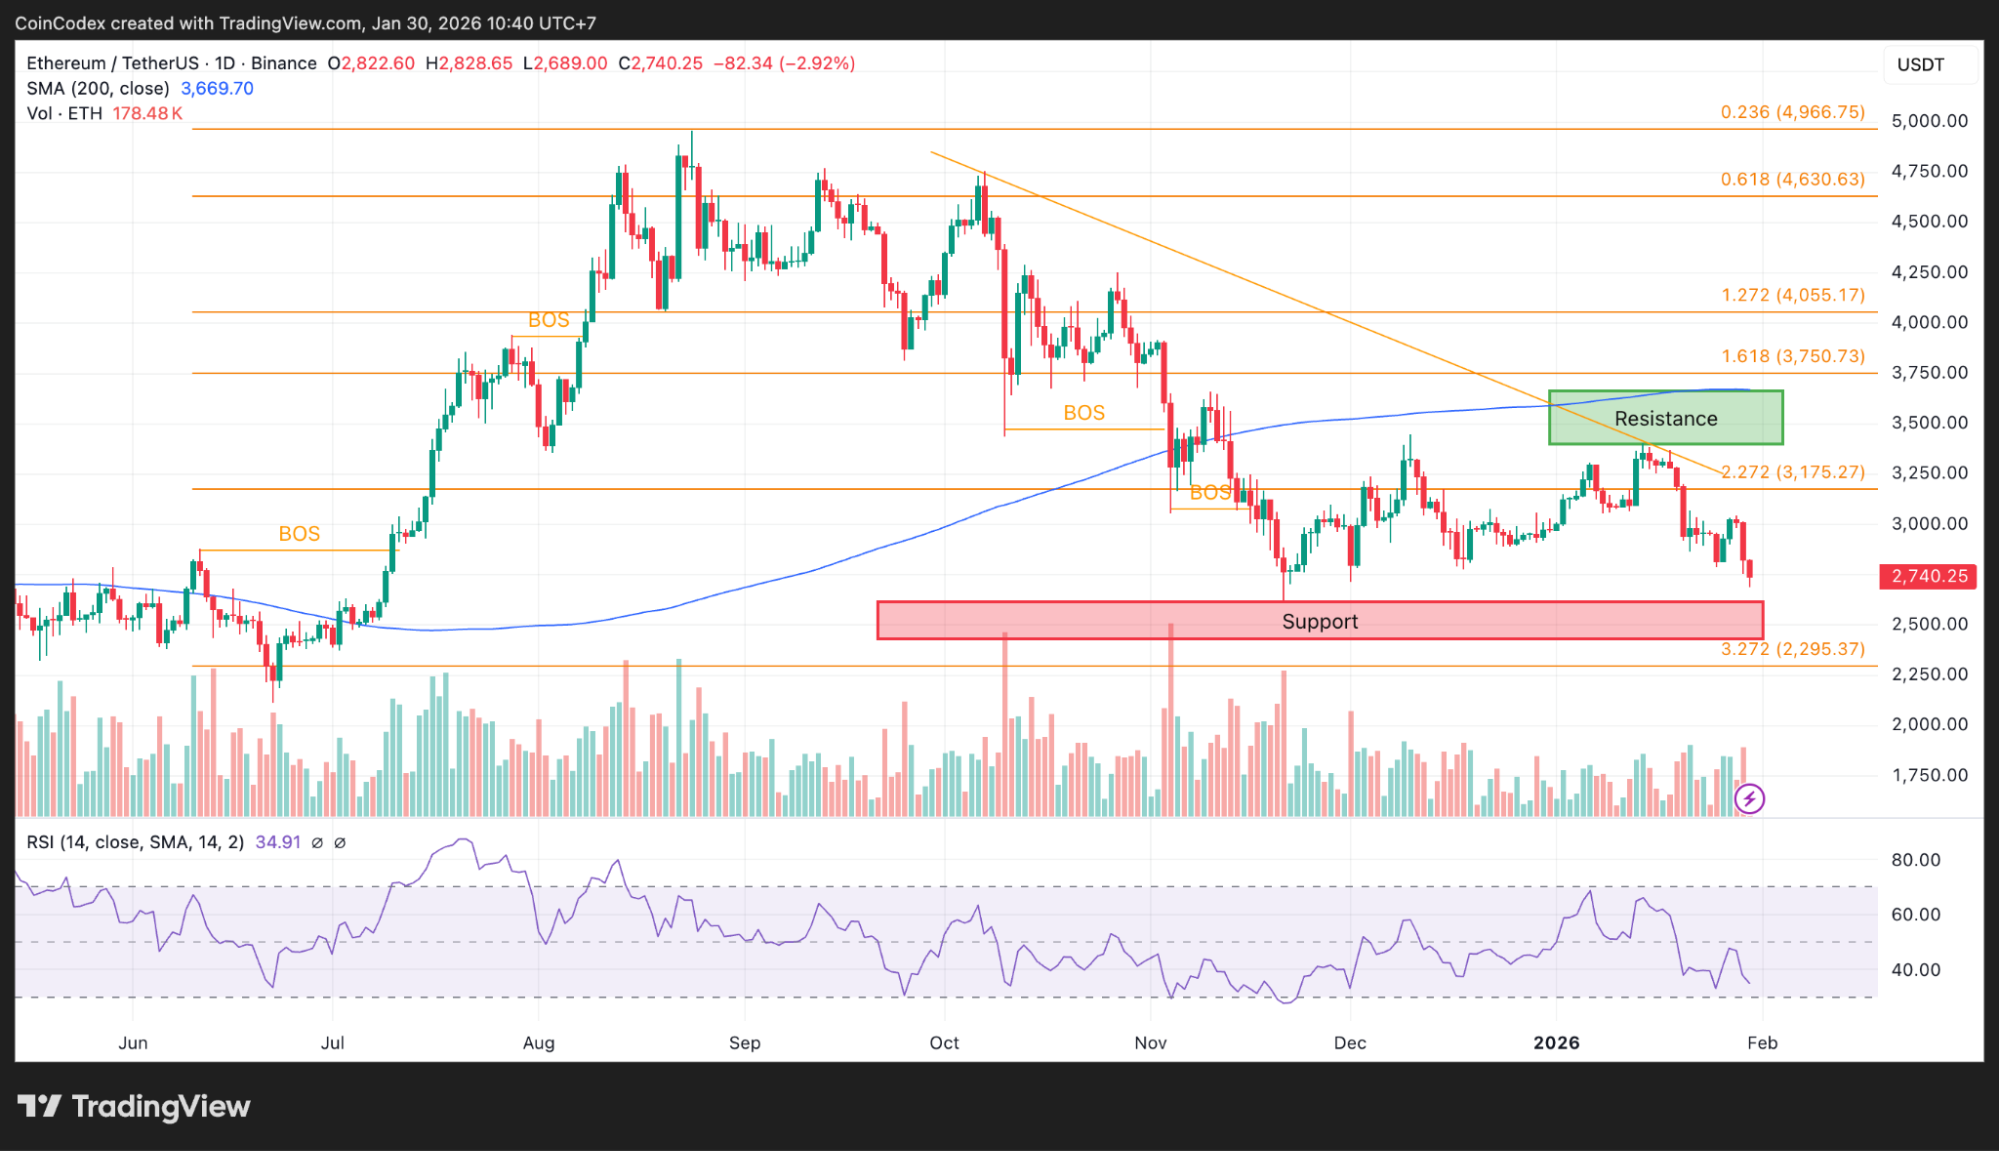
Daily ETH price chart analysis
Daily RSI is hovering around 35, which signals weakness but not outright panic. This tells us the downtrend didn’t appear overnight. Momentum has been fading for weeks, and so far, every rally has failed to flip the broader trend back to bullish.
The daily structure also mirrors what we see on lower timeframes. Support is clustered in the mid-to-high $2,600s, while resistance sits higher where previous structure broke down and sellers stepped in.
ETH price outlook: The edges still matter most
Nothing has really changed structurally. The ETH price remains stuck inside a range, and the middle of that range is still the least attractive place to make decisions.
According to CoinCodex’s 1-month ETH price prediction, Ethereum could drift toward $3,164.72 in the near term. That would push ETH back into the upper part of its range, which would be a noticeable improvement, even if it doesn’t count as a full breakout yet.
The real line in the sand remains $3,350. A move above this level would be seen as a genuine shift and open the way to higher resistance levels around $3,450 to $3,500.
On the downside, a loss of $2,600 will start to undermine the current range and indicate that Ethereum may need more time to base before any kind of advance is seen.
For now, the ETH price is exactly where it has been for weeks. The middle is messy, the edges are where clarity shows up, and the market is still waiting for either a decisive breakout above $3,350 or a controlled test of $2,600 that buyers actually defend.
Kraken: Best crypto exchange for security & reliability
- Buy, sell, and trade 400+ cryptocurrencies with industry-leading security
- Spot, Futures & Margin trading – leverage up to 5x for advanced traders
- Earn rewards with staking on top cryptocurrencies
- 24/7 customer support and high liquidity for fast trades
- Regulated in the US with strong compliance and security measures
- 13+ million users worldwide
Disclaimer: This content is for informational purposes only and does not constitute financial, investment, or other advice. Nothing on this page is a recommendation or solicitation. Always seek independent professional advice before making investment decisions. Some links may earn us a commission at no extra cost to you.
Source:: Ethereum Price Analysis: Analyst Says Patience Is Key as ETH Enters No-Man’s Land