Key highlights:
- Dogecoin is drifting down into a support zone that a lot of analysts are keeping a close eye on for a possible bounce.
- The charts still look weak overall, but the price is stretched enough that a quick rebound wouldn’t be surprising.
- On-chain activity is starting to pick up again, which could mean traders are getting active around these levels.
Dogecoin is getting pulled lower again, and the DOGE price is now drifting back into the same zone that’s been dangerous all cycle. It’s one of those areas where price either catches a bounce fast or keeps falling straight through.
The charts are basically showing two things at once. Momentum is still clearly bearish, but the market is also getting stretched enough that sudden snapback rallies can show up out of nowhere.
The DOGE price has already broken through several prior floors, and the next real monthly base sits much lower than where it trades today. At this point, it’s not about memes or hype. It’s about the structure on the chart, and the chart is starting to get loud.
The DOGE monthly chart shows the damage is already done
The monthly chart shared by Ali Martinez summed it up with one simple level: support sits around $0.054. That’s the line a lot of traders are watching for a possible bounce. And honestly, when you zoom out, it makes sense. [TWEET]: The DOGE price peaked near $0.459, rolled over hard, and never managed to reclaim the mid-range level around $0.157. That zone used to act like support, but now it’s sitting above price like a ceiling.
Dogecoin $DOGE has solid support around $0.054.
That’s the level I’m watching for a possible bounce. pic.twitter.com/mRFqbOG7bw
— Ali Charts (@alicharts) February 6, 2026
There’s also a clear marker around $0.102, which is close to where Dogecoin has been hovering lately. But this doesn’t look like a strong base. It looks more like price just pausing because it’s “in the way,” not because buyers are stepping in aggressively.
When a market keeps sliding and then stalls out like this, that stall often becomes the next breakdown point if sellers press again. And below all of that, the monthly chart points straight to $0.054.
What the on-chain charts say about this drop
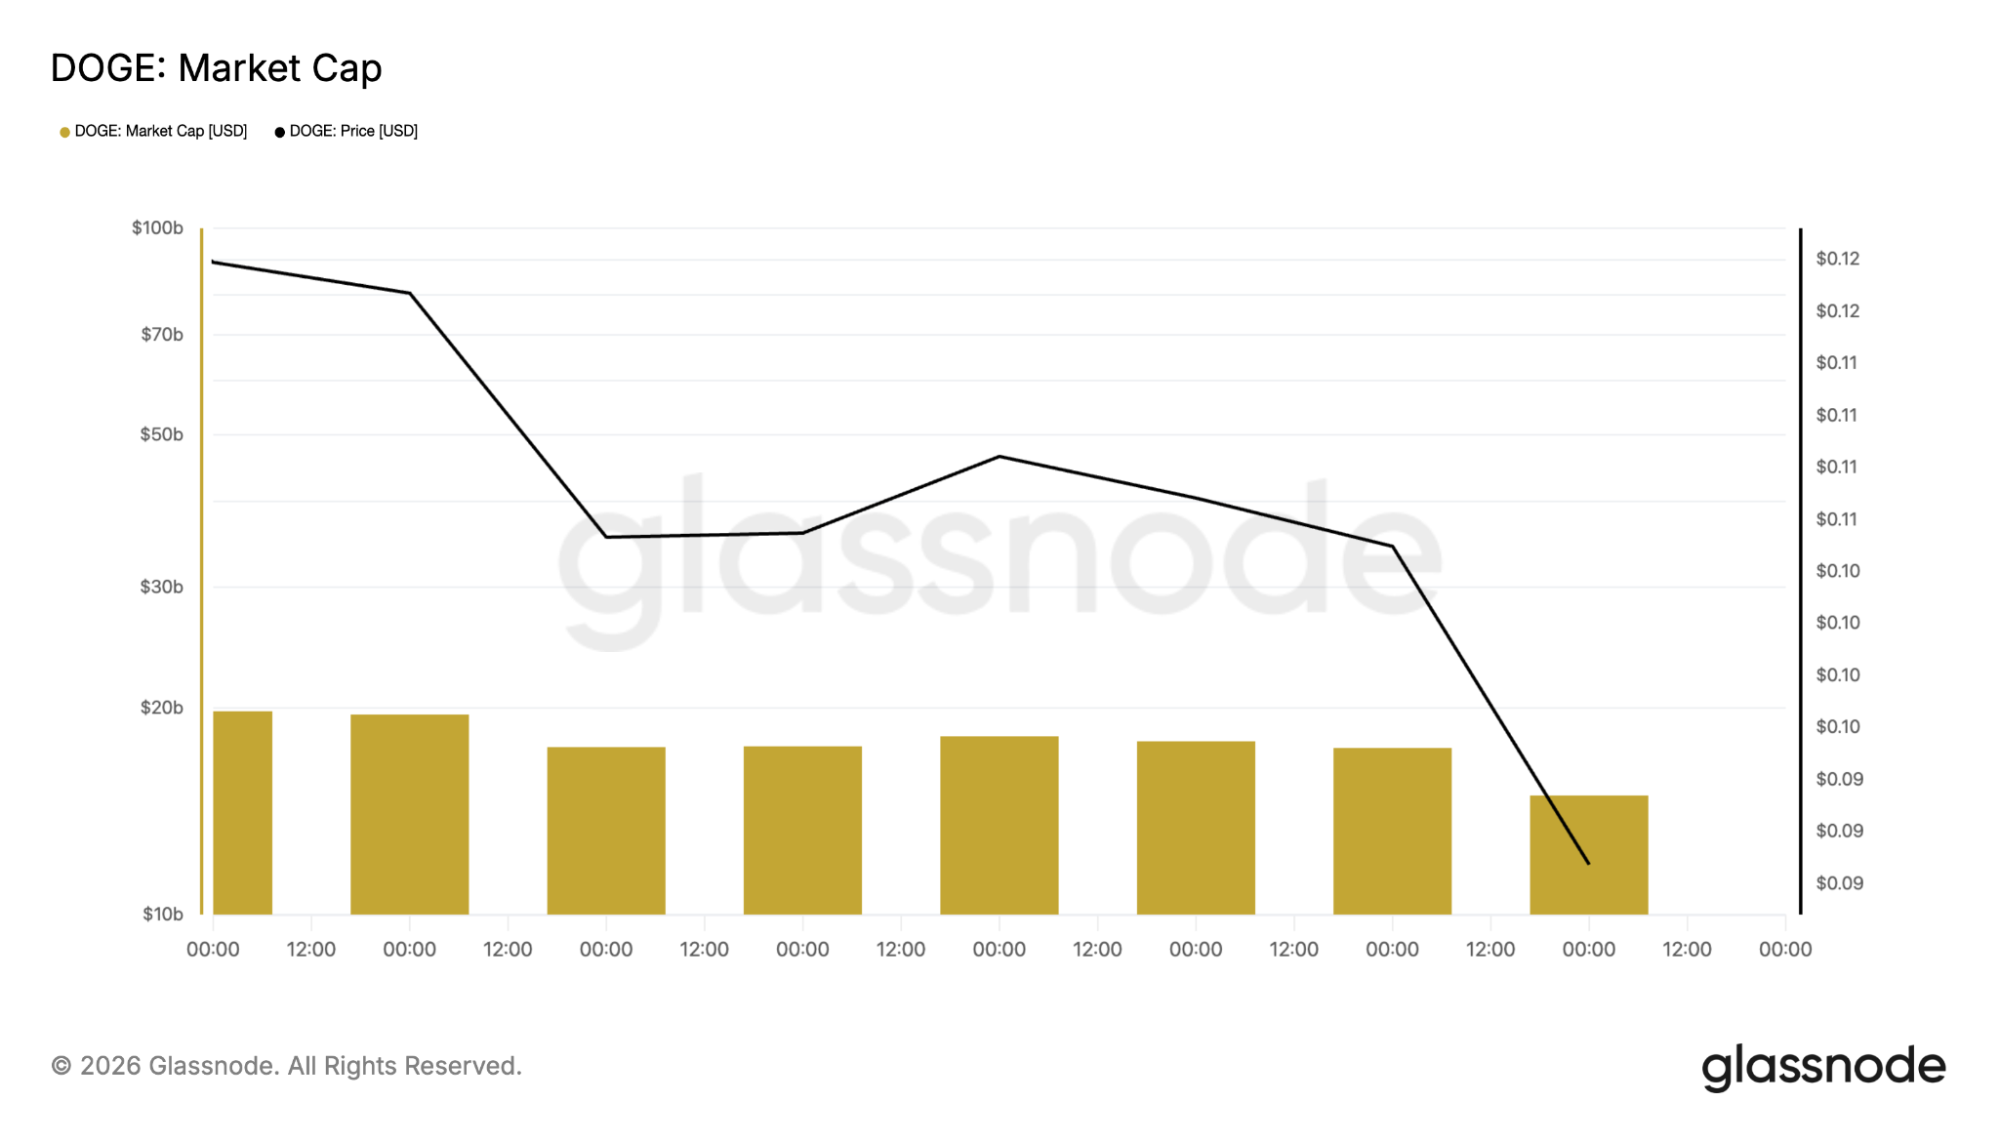
The Glassnode charts make this move a little more interesting, because price alone doesn’t tell the whole story. Yes, the DOGE price has taken a hard hit, and the market cap has dropped with it. That’s normal. When price falls, the overall value of the network comes down too.
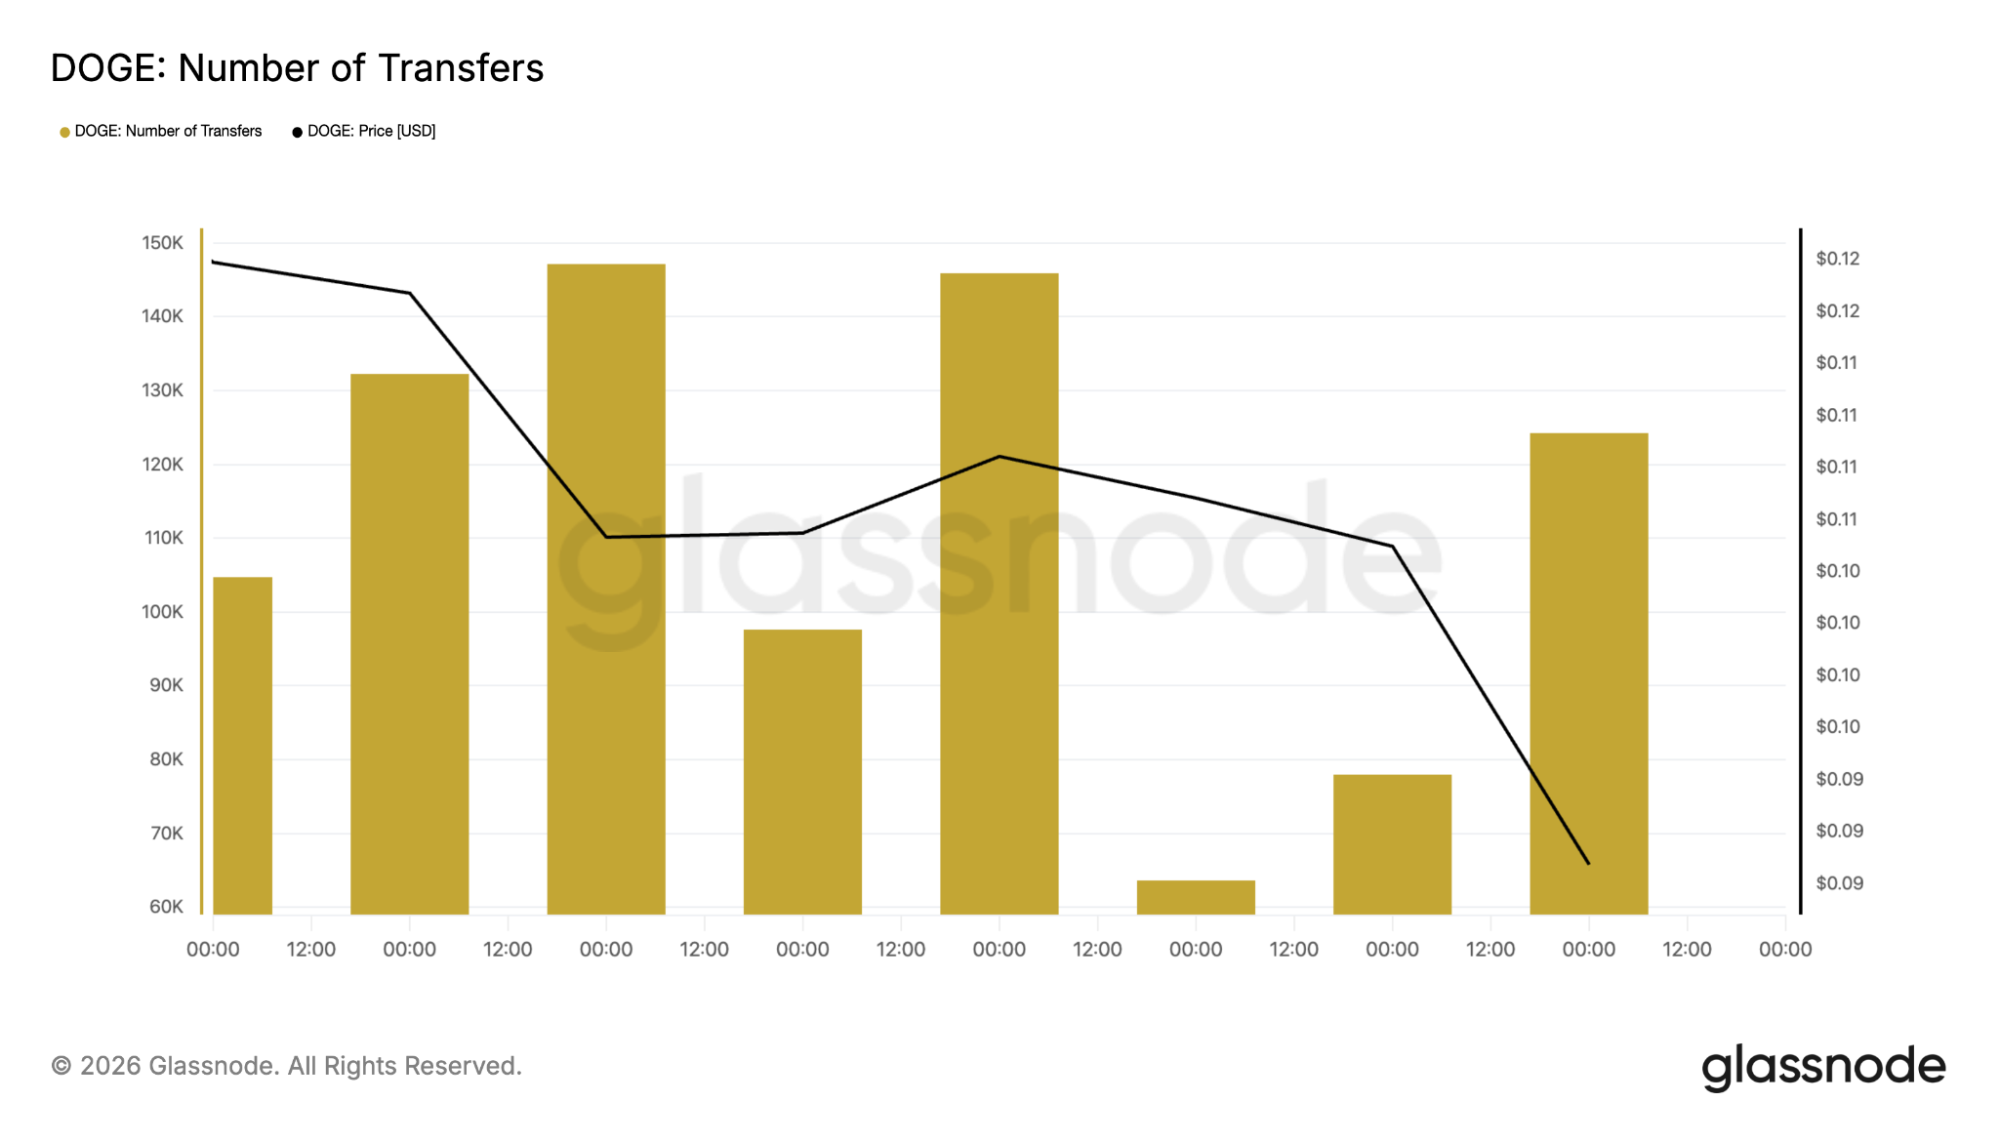
But what really stands out is what’s happening under the hood. Even as the DOGE price pushed lower, active addresses started climbing again. Transfers picked up too. That usually shows up when markets get chaotic and people start moving coins around more aggressively.
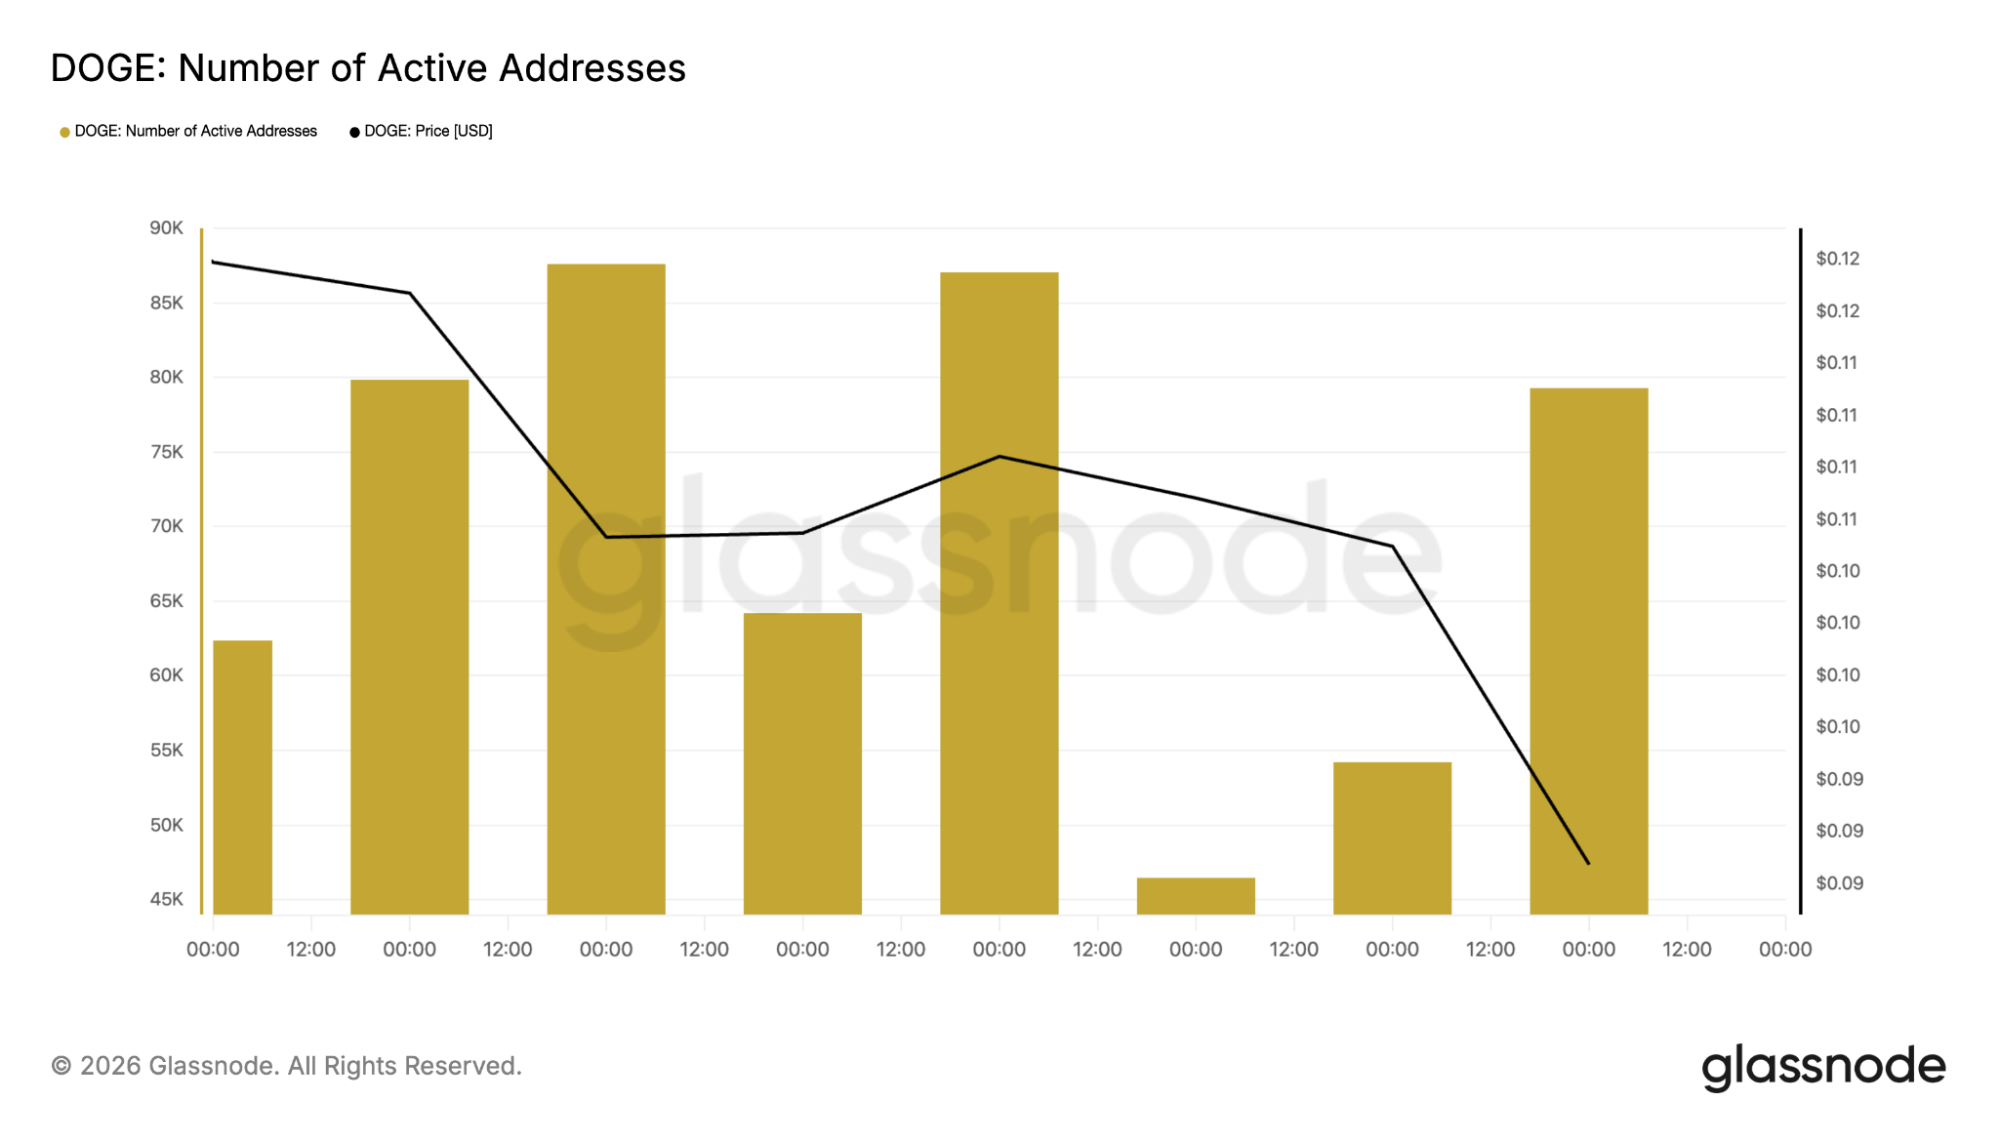
It doesn’t instantly mean bullish or bearish. It just means the network is awake. Traders are rotating, some are panicking, others are positioning near key support zones.
Dogecoin isn’t being forgotten here. The chain is still active, and this kind of reaction often shows up right when the market is getting close to a decision point.
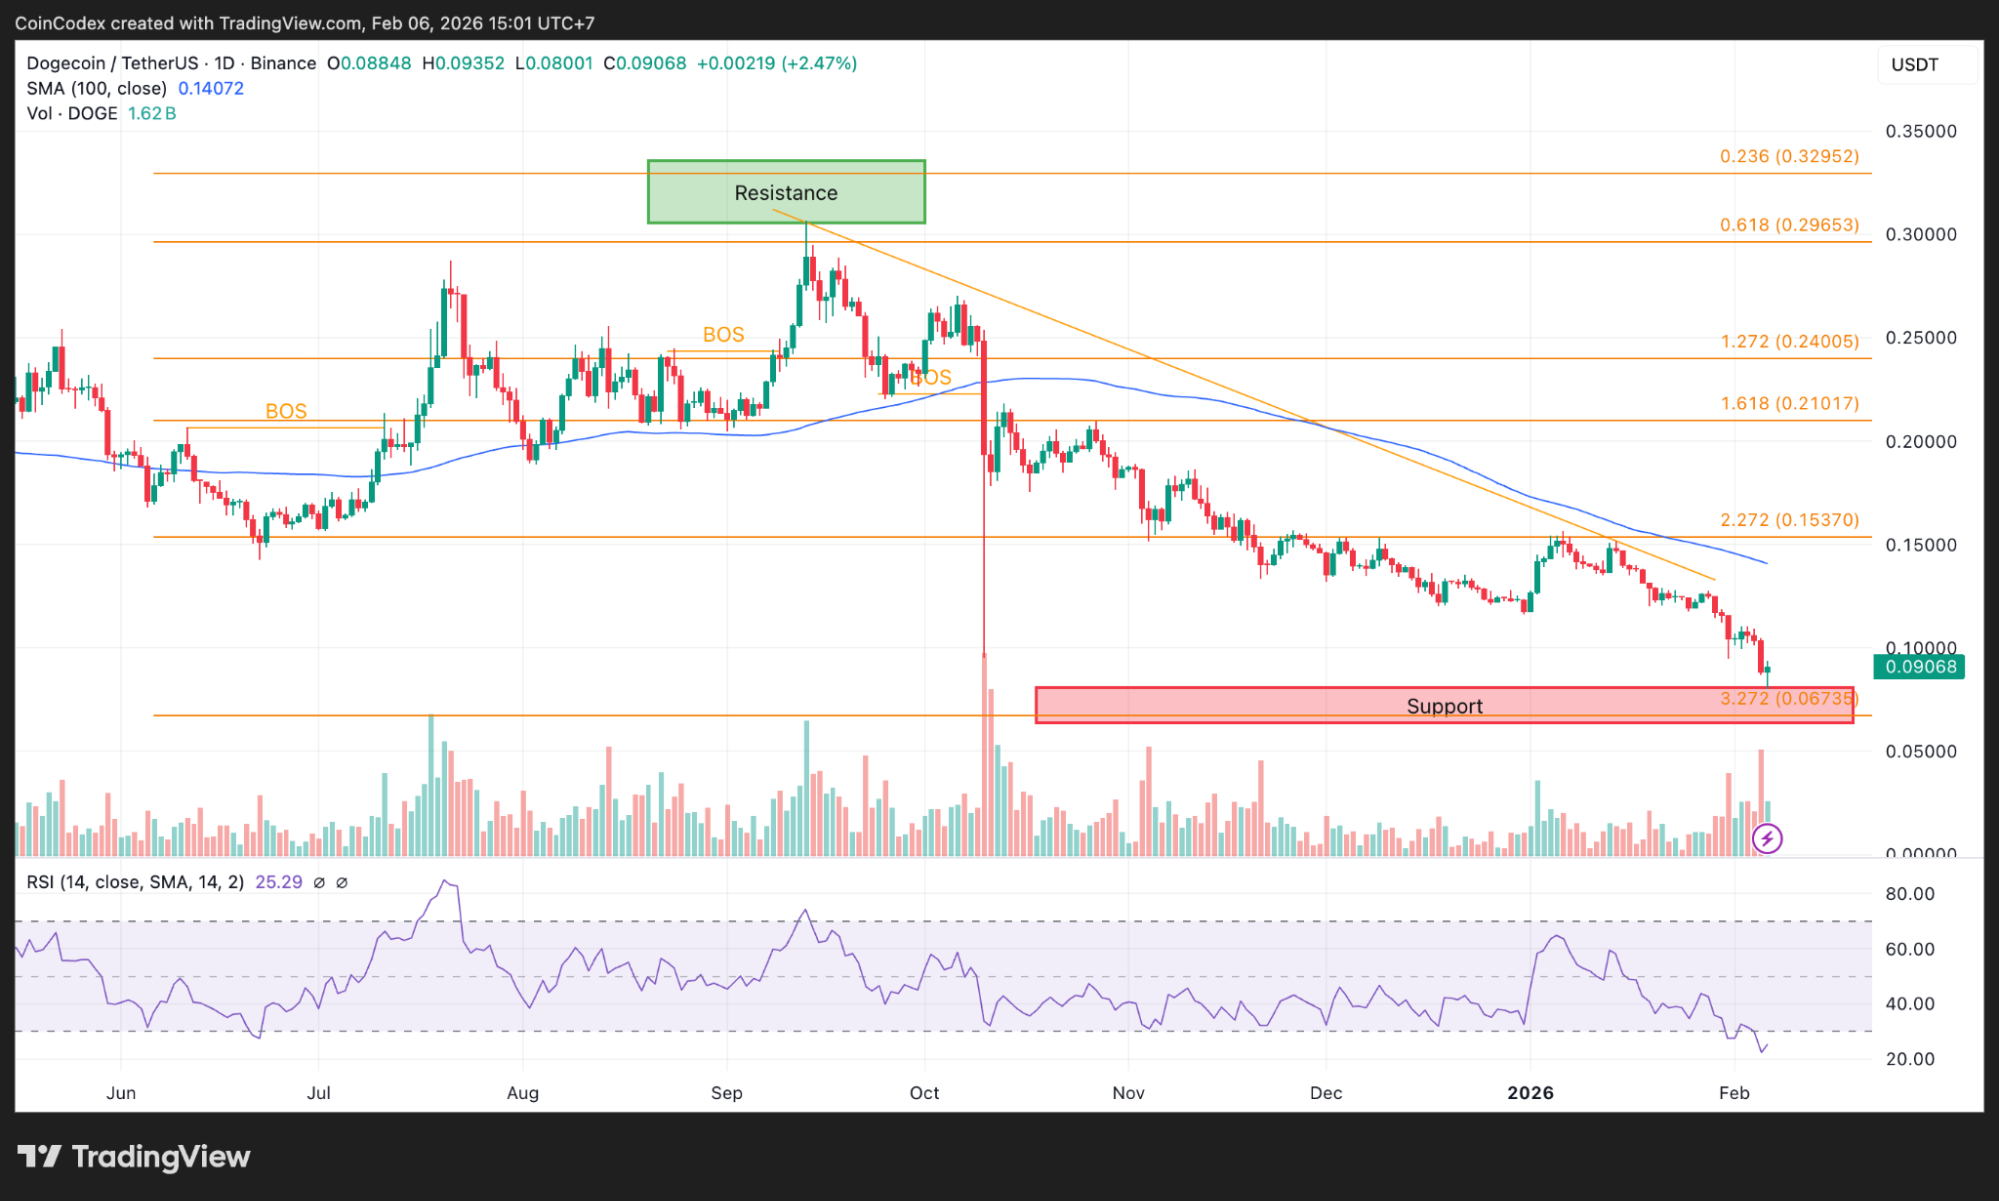
The DOGE daily chart looks like a falling staircase
On the daily chart, the DOGE price is still stuck under the 100-day moving average, sitting up near $0.14. That’s important, because when price stays below a major moving average for weeks, rallies usually don’t go far. Sellers tend to show up quickly.
Daily DOGE price chart analysis
The structure also looks like a slow bleed lower, almost like a staircase down. Right now, the DOGE price is sliding toward a major support band in the high $0.06–$0.07 area. That zone lines up with the extension level around $0.067, which adds even more weight to it as a potential “last defense” before things get uglier.
The RSI is also crushed, sitting in the mid-20s. That doesn’t automatically mean reversal, but it does mean Dogecoin has been sold hard enough that short-covering bounces become more likely.
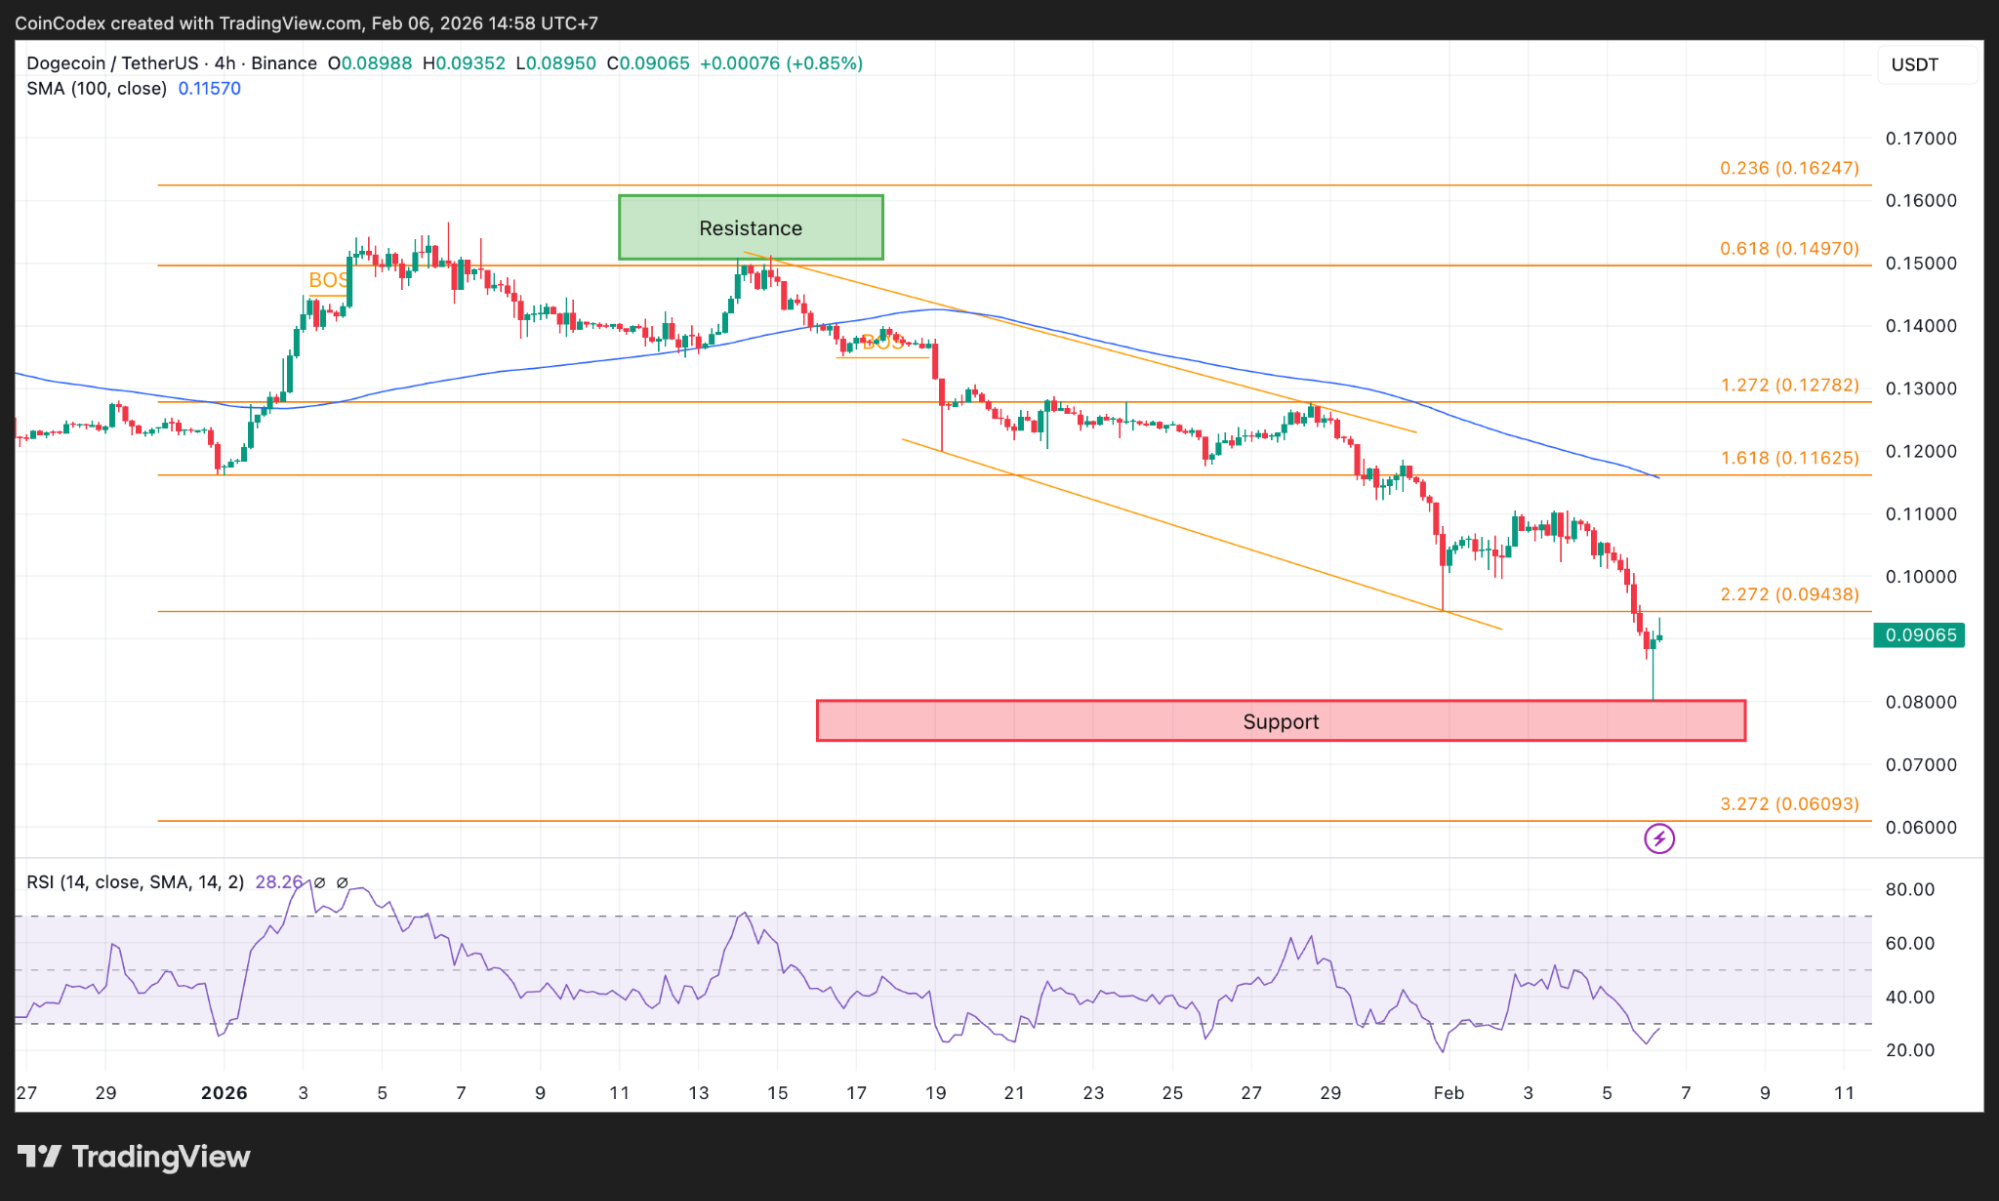
Dogecoin’s 4-hour chart is narrowing into a make-or-break zone
Zooming into the 4-hour chart, the DOGE price is trading around $0.09 and trying to stabilize after that sharp drop.
Overhead, you’ve got the moving average sitting near $0.115, and it’s acting like a ceiling. For a real trend change, Dogecoin would need to reclaim levels like that and actually hold them, not just wick into them for a few hours.
4-hour DOGE price chart analysis
There’s also a nearby line around $0.094, and that’s kind of the “prove it” level. If the DOGE price can’t even take that back cleanly, then this is still just drift mode, and the next support test stays on the table.
Below here, the red support box on the intraday chart shows where price already dipped and snapped back. That’s normal in oversold conditions, but these bounces can also fail quickly if resistance isn’t reclaimed.
What’s next for DOGE
Right now, Dogecoin is sitting in one of those zones where bounces can happen fast because the market is oversold and stretched. But the trend is still down, price is still below key resistance, and the monthly chart shows the next serious support sits much lower.
If the DOGE price holds here and pushes back above $0.094, the door opens for a grind higher toward $0.116 and $0.128. If it fails, and the next support band near $0.067–$0.07 breaks, then all eyes shift to $0.054 as the main bounce-or-break level.
According to CoinCodex’s 1-month DOGE price prediction, Dogecoin could trade around $0.1035 in the near term. That would bring the DOGE price back toward the upper part of its current range, which would be a meaningful bounce, even if it doesn’t signal a full trend reversal yet.
Kraken: Best crypto exchange for security & reliability
- Buy, sell, and trade 400+ cryptocurrencies with industry-leading security
- Spot, Futures & Margin trading – leverage up to 5x for advanced traders
- Earn rewards with staking on top cryptocurrencies
- 24/7 customer support and high liquidity for fast trades
- Regulated in the US with strong compliance and security measures
- 13+ million users worldwide
Disclaimer: This content is for informational purposes only and does not constitute financial, investment, or other advice. Nothing on this page is a recommendation or solicitation. Always seek independent professional advice before making investment decisions. Some links may earn us a commission at no extra cost to you.
Source:: Dogecoin Price Prediction: Analyst Predicts a Bounce at This Key Level