Key highlights:
- The DASH price is pushing up against a level that has stopped every major rally since 2018
- The current setup looks like a clear shift from long accumulation into a potential breakout phase
- Both the charts and on-chain data point to Dash entering one of its most important moments in years
DASH is quietly setting up one of the most interesting technical structures it has shown in years. While most of the market is busy watching Bitcoin and a handful of large caps, the DASH price is creeping toward a level that has shaped its entire story since 2018.
When analyst 28 Crypto pointed out that once Dash breaks its eight-year resistance, things could move fast, that wasn’t just a catchy line. The charts actually back that idea up in a pretty convincing way.
The long-term trendline that has controlled DASH for years
On the weekly chart shared by 28 Crypto, Dash is still trading under a descending resistance line that has been in place since the 2018 cycle top. Every meaningful rally since then has failed right below that line.
The 2021 recovery couldn’t break it, and neither could the smaller bounces that followed. That alone makes the current setup more than just another routine push higher. What makes this attempt different is the amount of pressure that has been building beneath that resistance.
Once $DASH breaks its 8-year resistance, we’re out of the woods. Things could move fast! pic.twitter.com/QejuuDDYhQ
— 28 Crypto (@NumberOfWealth) January 18, 2026
The DASH price spent years forming lower highs and broad, flat bases. Volatility slowly faded. That kind of long compression often shows up right before major trend changes, especially when it lasts through multiple market cycles.
Now, with Dash pushing toward the $88–$90 area, price is once again pressing directly into that long-term ceiling. This isn’t a random rally. It’s a structural test that has been years in the making.
DASH price action points to accumulation, not exhaustion
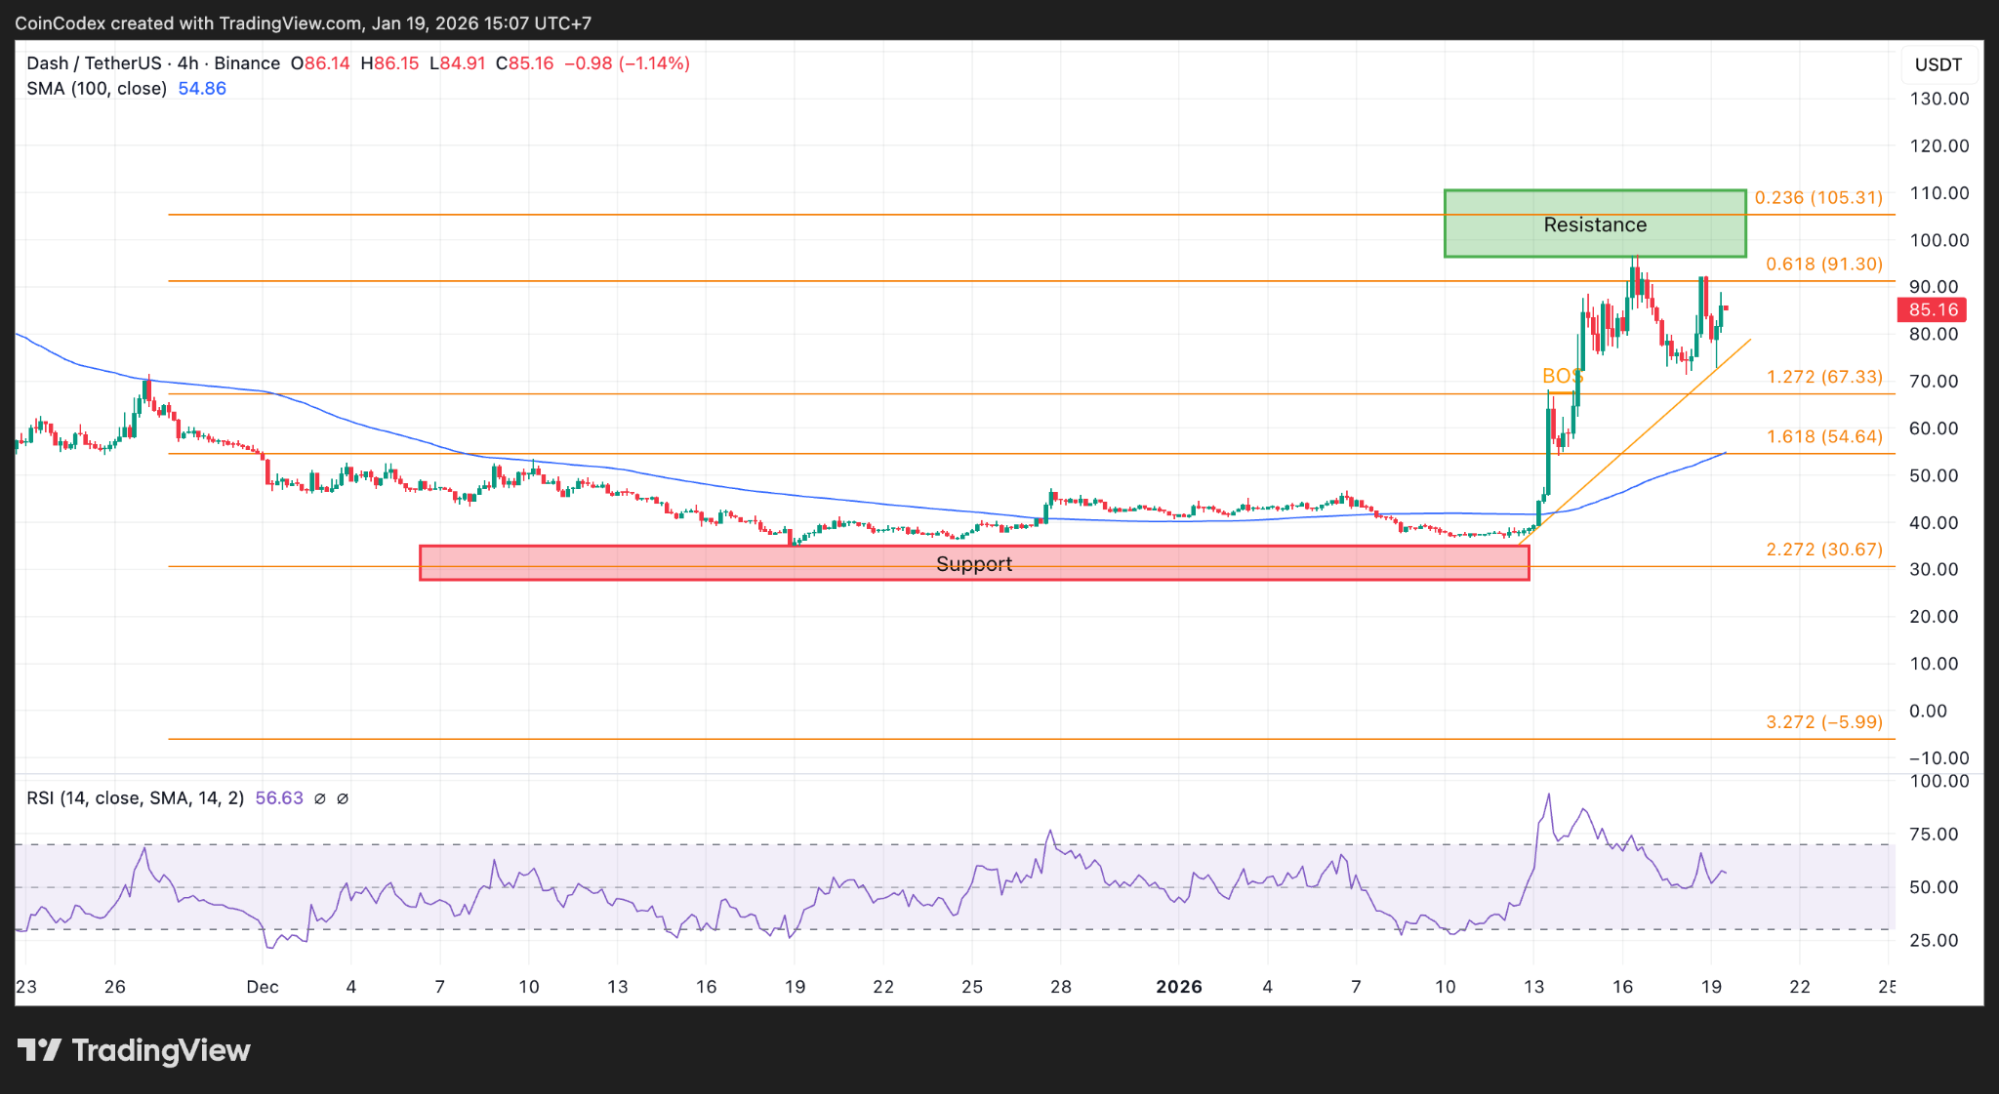
When you drop down to the 4-hour chart, you can see how Dash actually got here. After months of chopping around between roughly $30 and $40, the DASH price finally broke out with force, cleared the $55 area, and ran up into the mid-$80s.
And what’s important is how that move happened. It wasn’t some vertical, unsustainable spike. It unfolded through a clean breakout pattern, supported by a rising trendline and a strong reclaim of the 100-period moving average. Every pullback respected that trendline, which tells you buyers weren’t just chasing candles, they were stepping in with intention.
4-Hour DASH price chart analysis.
The Fibonacci levels drawn on that move show the DASH price holding above the 0.618 retracement near $91, with the next major resistance sitting between $100 and $105. That zone lines up with previous supply from late 2021 and early 2022, so it makes sense as the next hurdle if momentum continues.
The fact that Dash didn’t immediately roll over after tagging this area is another important detail. It doesn’t look like distribution. It looks more like digestion before another move.
The daily chart confirms DASH has left its multi-year base
The daily chart adds even more confidence to this picture. For nearly two years, the DASH price was stuck moving sideways between about $30 and $45. That entire zone now looks like a large accumulation base, and price has clearly broken out of it.
This kind of behavior usually doesn’t lead to instant reversals. More often, a move like this marks a regime shift, where the market transitions from range-bound to trending. After that, you tend to see consolidation and then continuation, rather than a straight collapse back into the range.
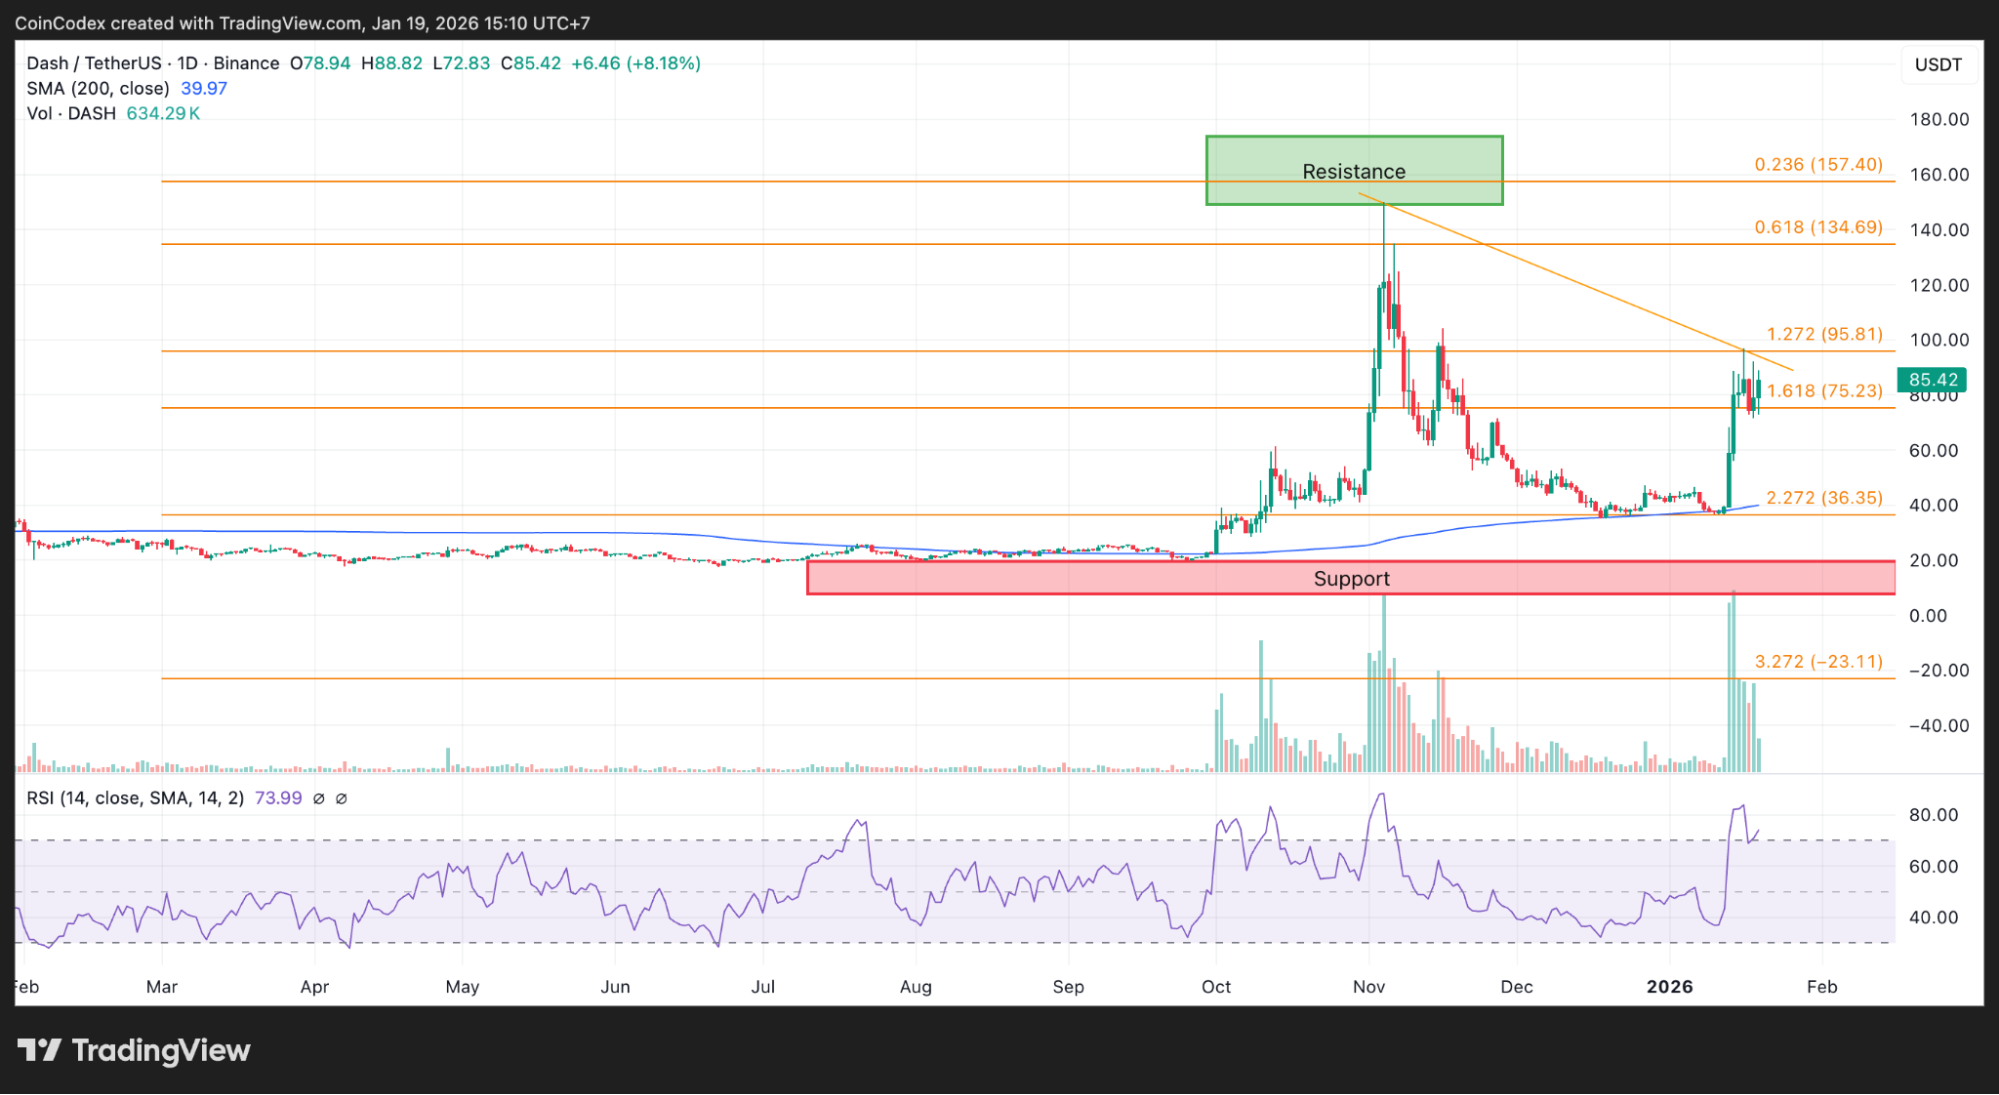
Daily DASH price chart analysis.
The daily RSI supports that idea too. After spending months below neutral, it pushed above 70 during the breakout and has since cooled off without breaking its trend. As long as the DASH price holds above the $70–$75 region, the overall breakout structure stays intact.
Market cap is rising, not just DASH price
Price on its own never tells the full story, which is where the Glassnode market cap chart becomes really useful. Dash’s market cap has expanded from under $500 million to nearly $1 billion in a relatively short time, moving in step with the rise in the DASH price.
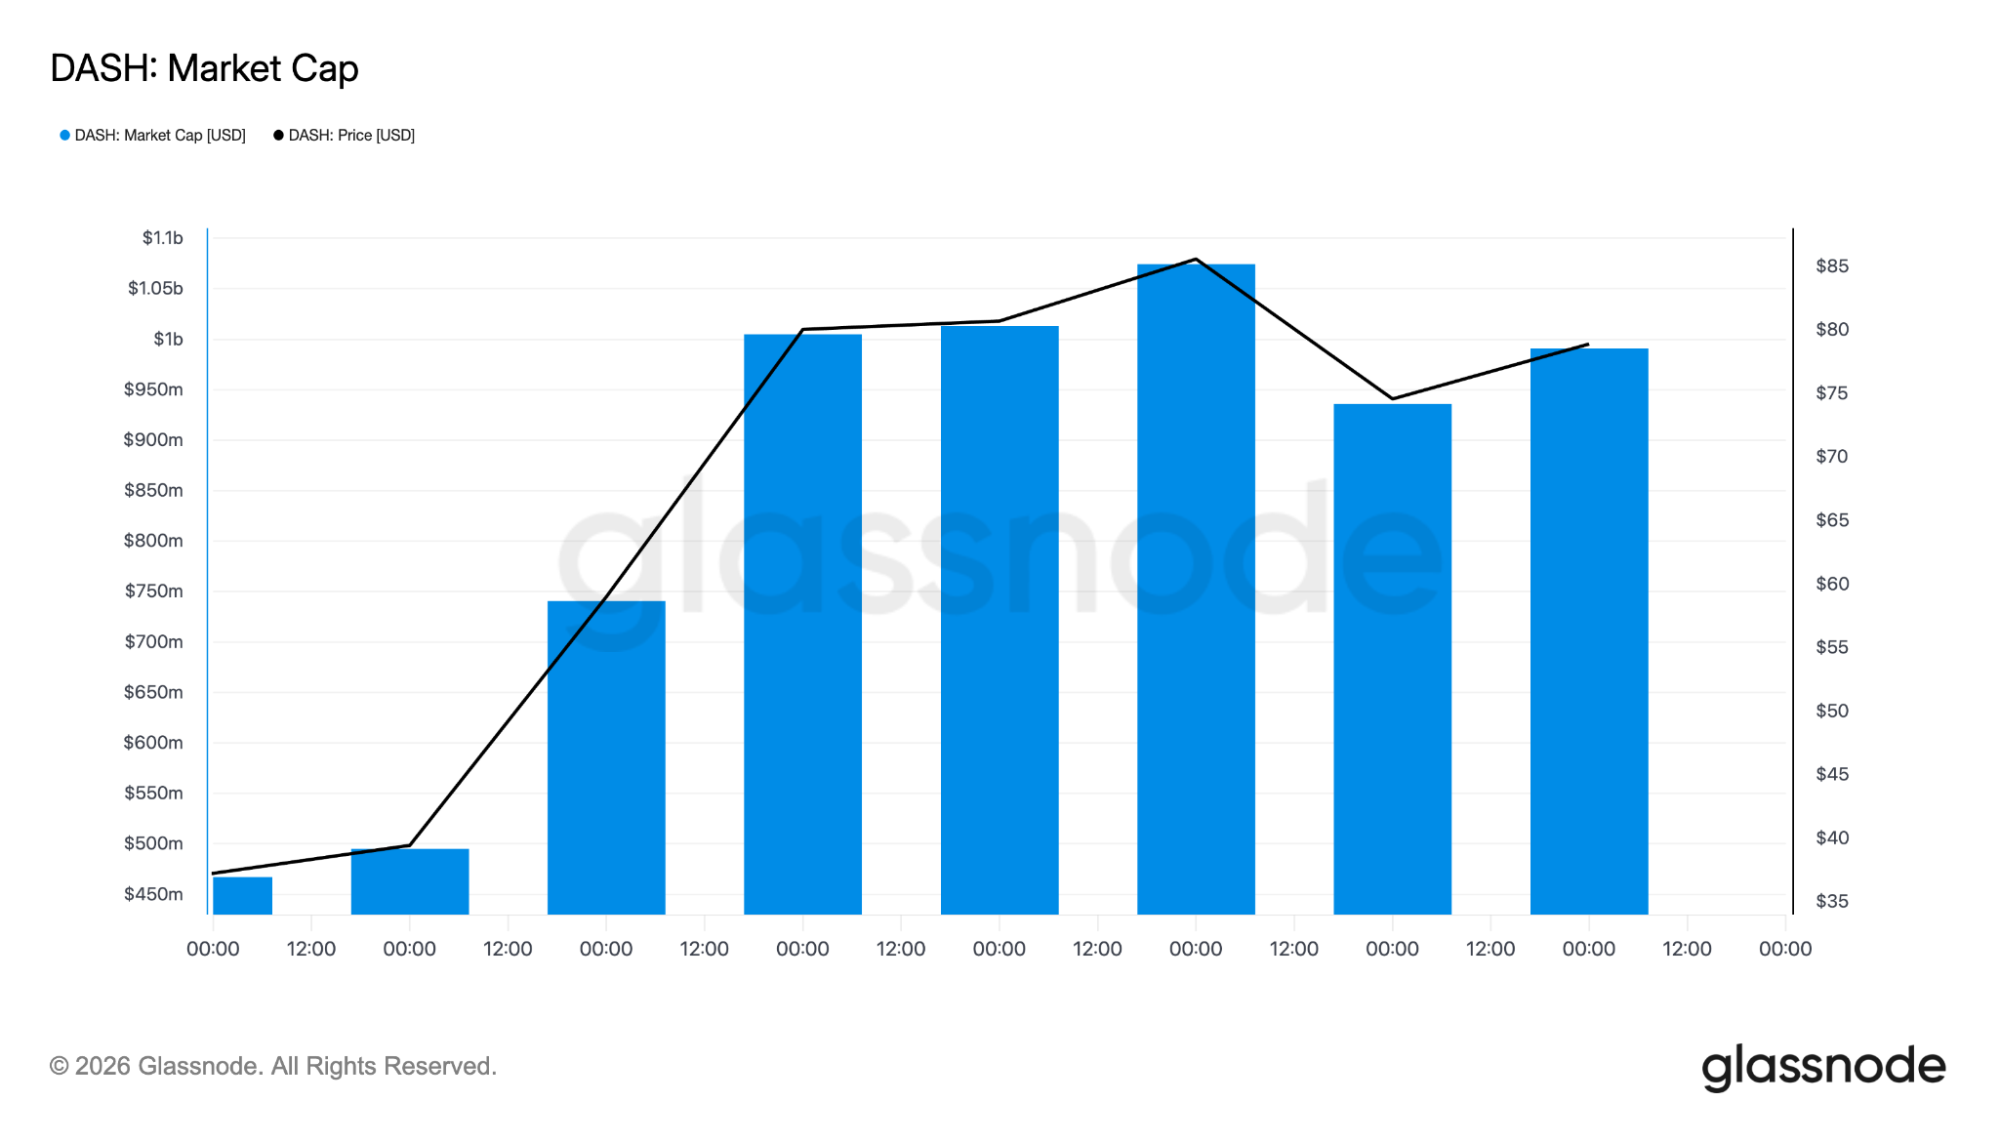
That’s important because it shows this move isn’t just happening in thin liquidity or driven by a single exchange. Real capital is flowing into the asset. Even when the price pulled back from its local highs, the market cap didn’t collapse.
One of the most striking pieces of data comes from the drawdown-from-ATH chart. Even after this rally, Dash is still trading around 95 percent below its all-time high. That puts it among the most heavily discounted major altcoins relative to previous cycles.
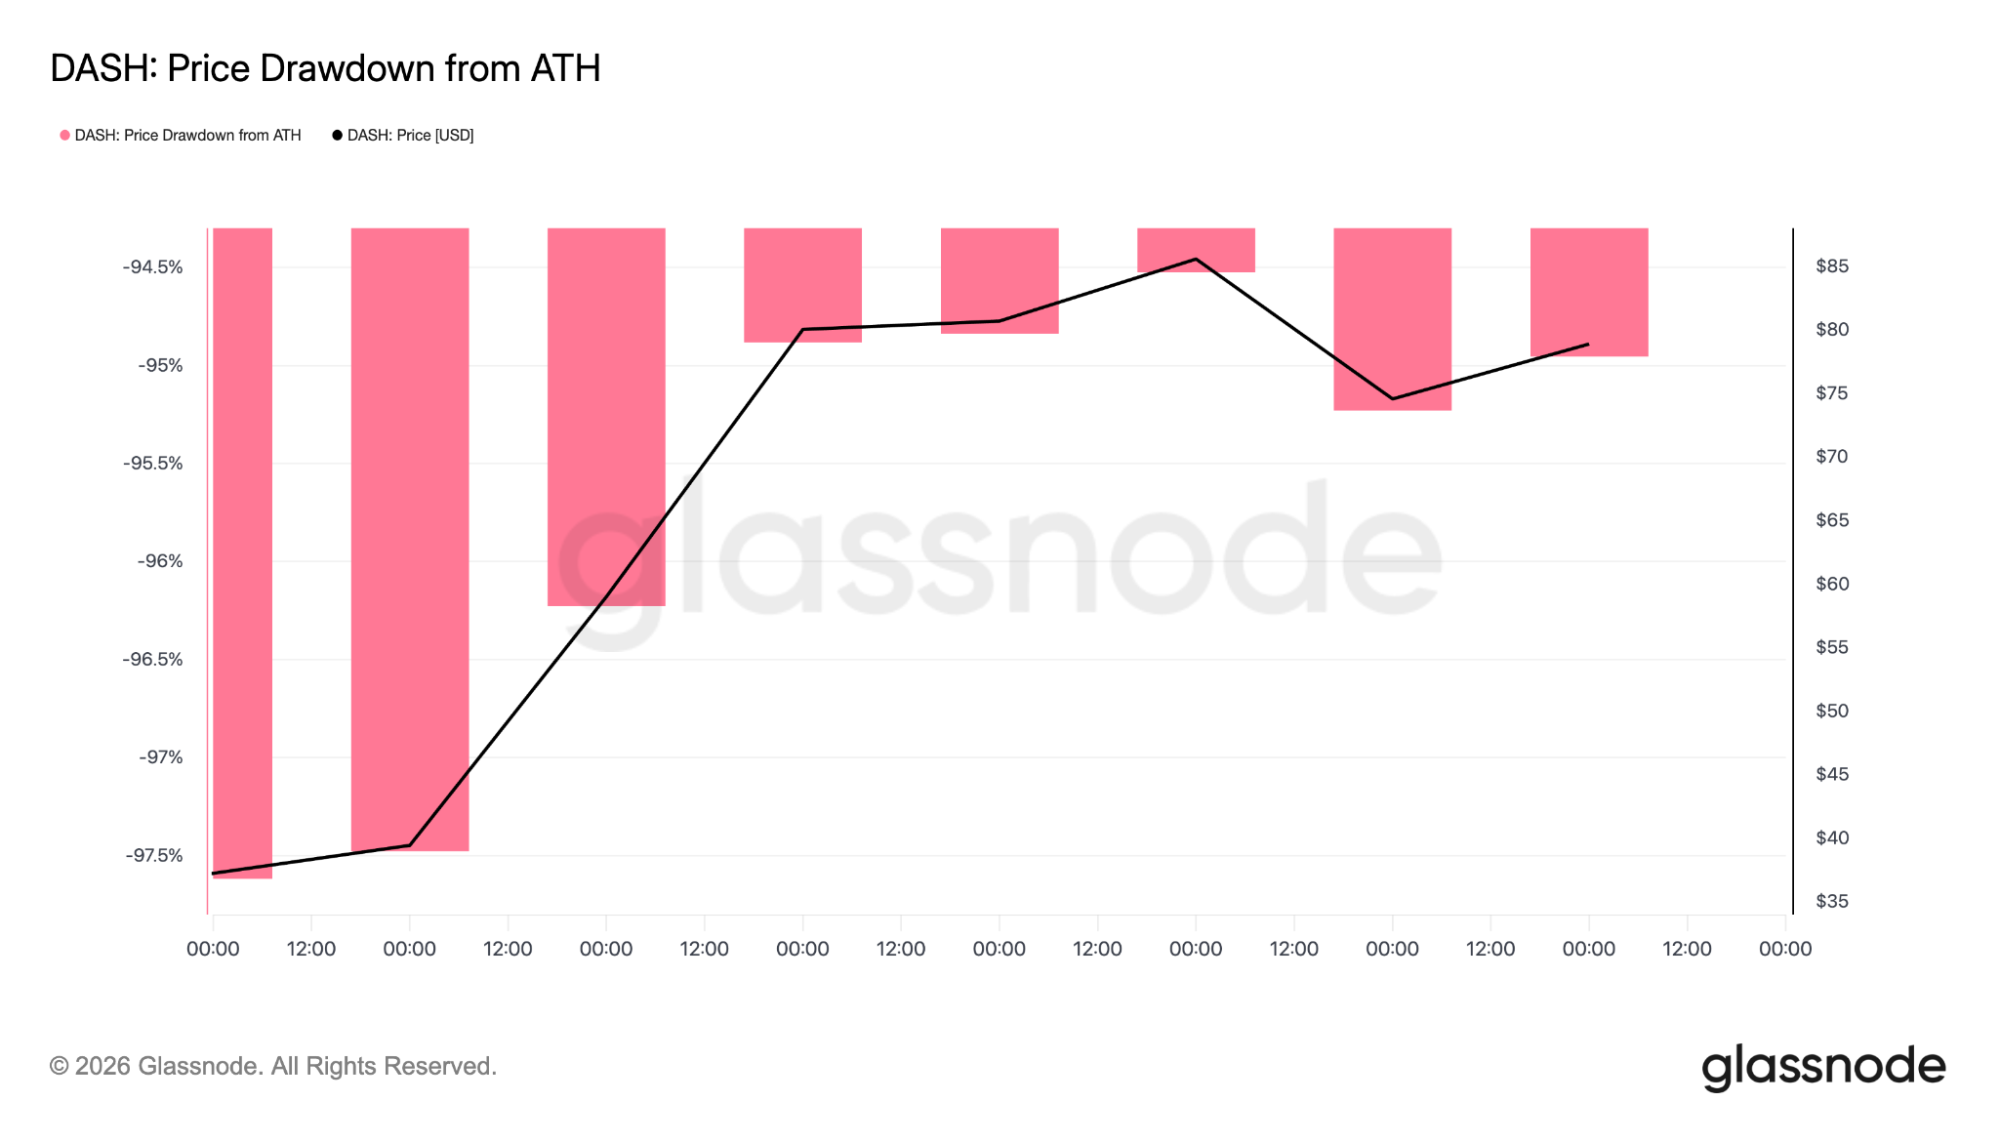
What really stands out is that the drawdown has barely improved despite the recent rise in the DASH price. That means Dash is only just beginning to recover from a very deep compression phase.
What comes next for DASH?
Of course, no setup is guaranteed. If the DASH price drops back below the $70 zone and fails to reclaim it, the breakout narrative starts to weaken. That would indicate this move was more momentum-driven than structural.
A sustained break below $55 would be even more serious, because it would imply that the entire breakout leg has failed and Dash is slipping back into its old range. Until that happens, though, the market is still operating inside a bullish framework.
According to CoinCodex’s 1-month DASH price prediction the token could trade around $82.89, but the technical structure is what ultimately carries more weight.
The DASH price doesn’t need to explode overnight for this setup to stay valid. It simply needs to remain structurally strong while slowly forcing the market to accept that Dash may no longer belong in the “forgotten” category.
If that eight-year resistance finally breaks, the story around Dash changes completely. And when stories change in crypto, price usually follows faster than most people expect.
Kraken: Best crypto exchange for security & reliability
- Buy, sell, and trade 400+ cryptocurrencies with industry-leading security
- Spot, Futures & Margin trading – leverage up to 5x for advanced traders
- Earn rewards with staking on top cryptocurrencies
- 24/7 customer support and high liquidity for fast trades
- Regulated in the US with strong compliance and security measures
- 13+ million users worldwide
Disclaimer: This content is for informational purposes only and does not constitute financial, investment, or other advice. Nothing on this page is a recommendation or solicitation. Always seek independent professional advice before making investment decisions. Some links may earn us a commission at no extra cost to you.
Source:: DASH Price Analysis: How High Could DASH Go If It Breaks Its 8-Year Resistance?