Key highlights:
- Cardano’s SuperTrend just flashed its first buy signal in weeks, hinting that momentum might finally be shifting.
- The ADA price is sitting right on its key support and resistance zones as traders wait to see if it can break out or pull back.
- The SuperTrend buy signal is the strongest early reversal indicator ADA has printed in months.
Cardano finally showed signs of life today. After weeks of grinding lower and losing key support levels, ADA just printed something it hasn’t shown in a long time: a fresh SuperTrend buy signal on the 12-hour chart.
For many traders, this is the first legitimate hint that momentum might be shifting, even if the broader trend still looks heavy. With the ADA price trading around $0.448, that signal is gaining interest at a moment when the market has been desperate for clarity.
What makes this setup interesting is that ADA just bounced from a price area that has acted as a major demand zone before. At the same time, the charts show growing signs of exhaustion from sellers.
ADA gets its first supertrend buy signal in weeks
The clearest shift comes from a 12-hour chart shared by prominent analyst Ali Martinez.. The SuperTrend indicator, which has been flashing “sell” for weeks straight, finally flipped into a “buy” signal after price reclaimed the top of its cloud.
SuperTrend just flashed a buy signal for Cardano $ADA. pic.twitter.com/DqV11b01oa
— Ali (@ali_charts) December 4, 2025
The ADA price has been stuck below this indicator since the end of October, and every attempt to break above it failed almost immediately. This time, the reaction looks different. The candle actually closed above the cloud, and volume is starting to increase just as the signal printed.
This doesn’t guarantee a breakout, but historically this indicator does a good job identifying momentum shifts. The last time ADA flipped this signal into a sustained trend, it ran almost 40% before slowing down.
Whether that can happen again depends heavily on how price reacts to the next levels of resistance, particularly the $0.47 zone that rejected the ADA price multiple times in November.
If ADA holds above $0.43–$0.44 and keeps closing inside the buy zone, the SuperTrend could mark the beginning of a broader recovery leg rather than just another short-lived bounce.
On-chain data shows accumulation quietly returning
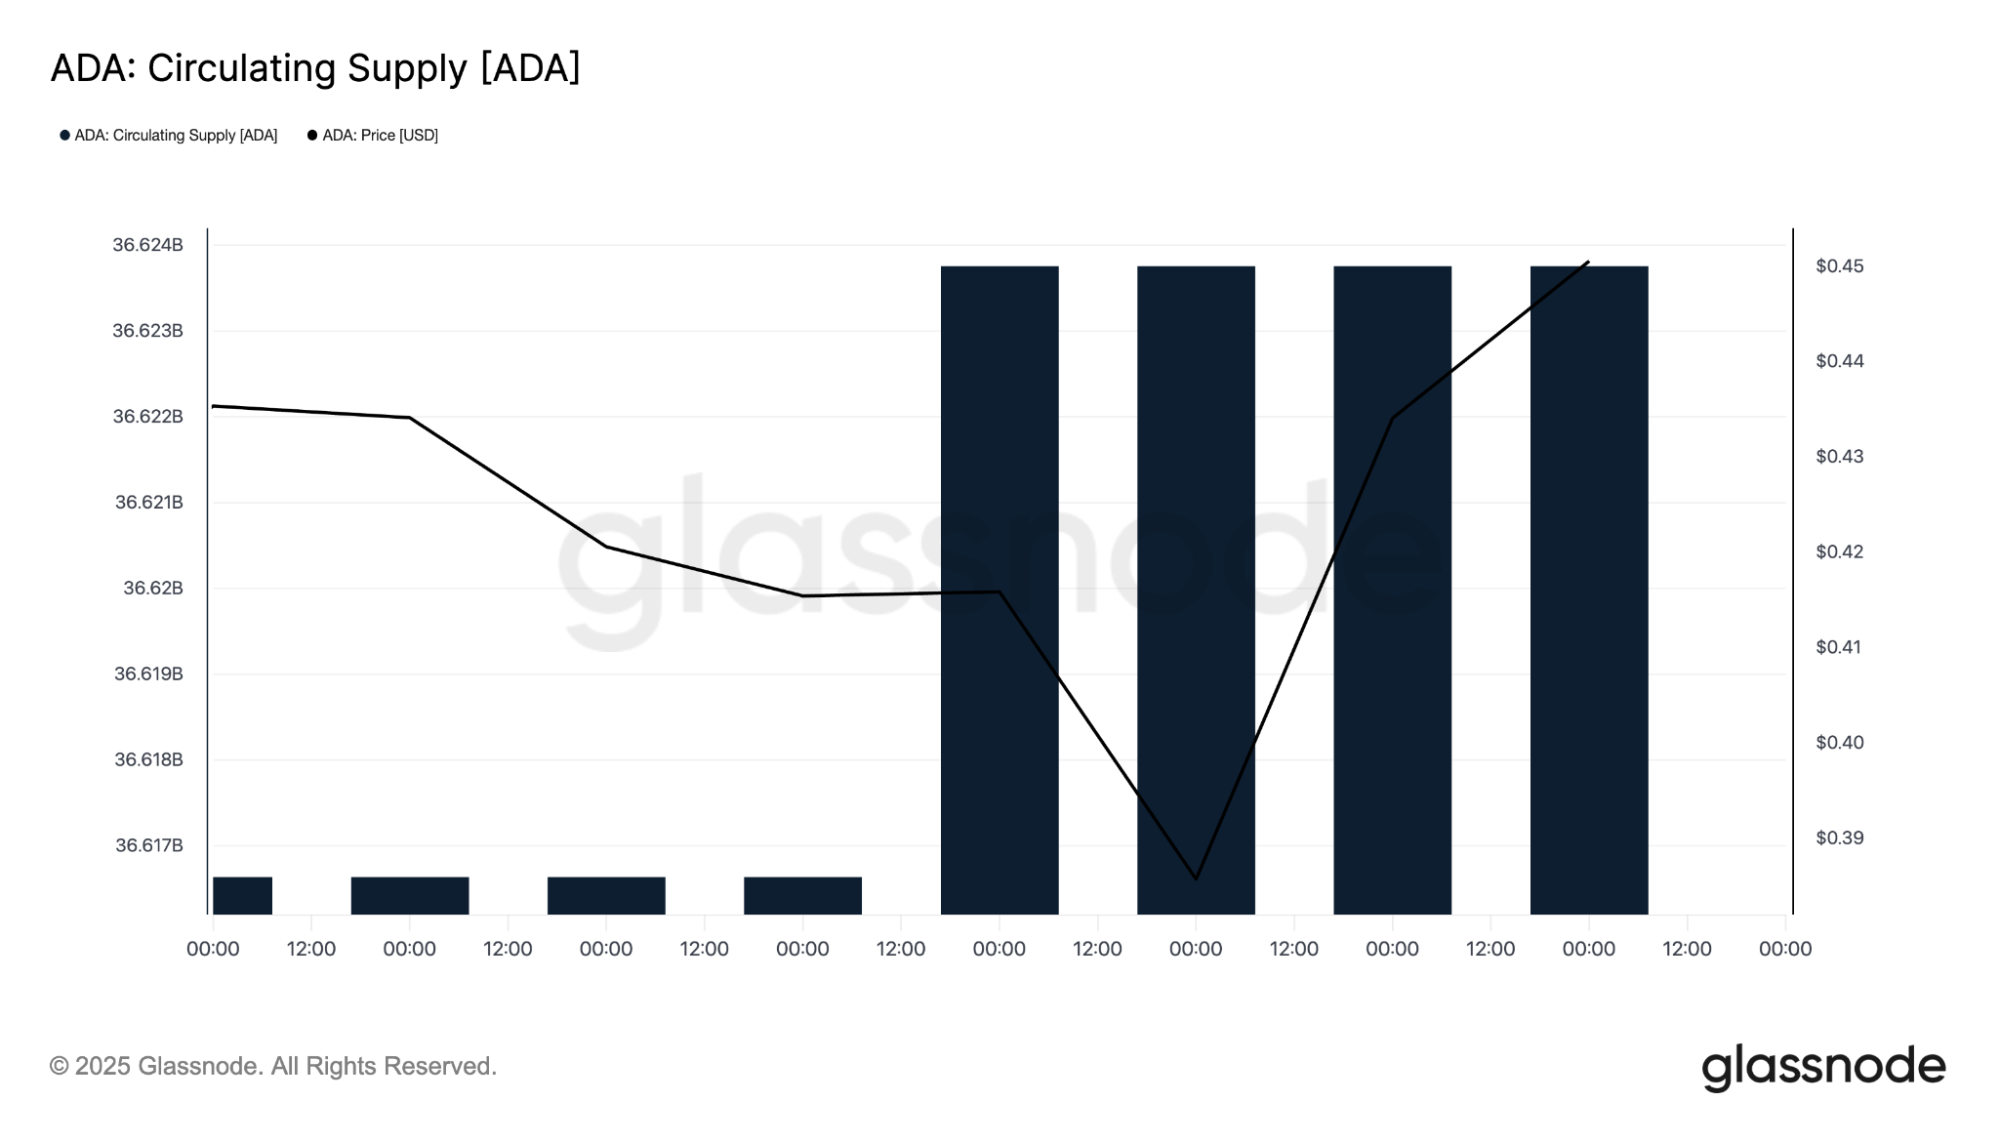
Glassnode’s on-chain data adds even more context to the recent move. ADA’s circulating supply has been flat for most of the week, but something interesting happened the same moment the price bounced: supply held steady while demand started to appear.
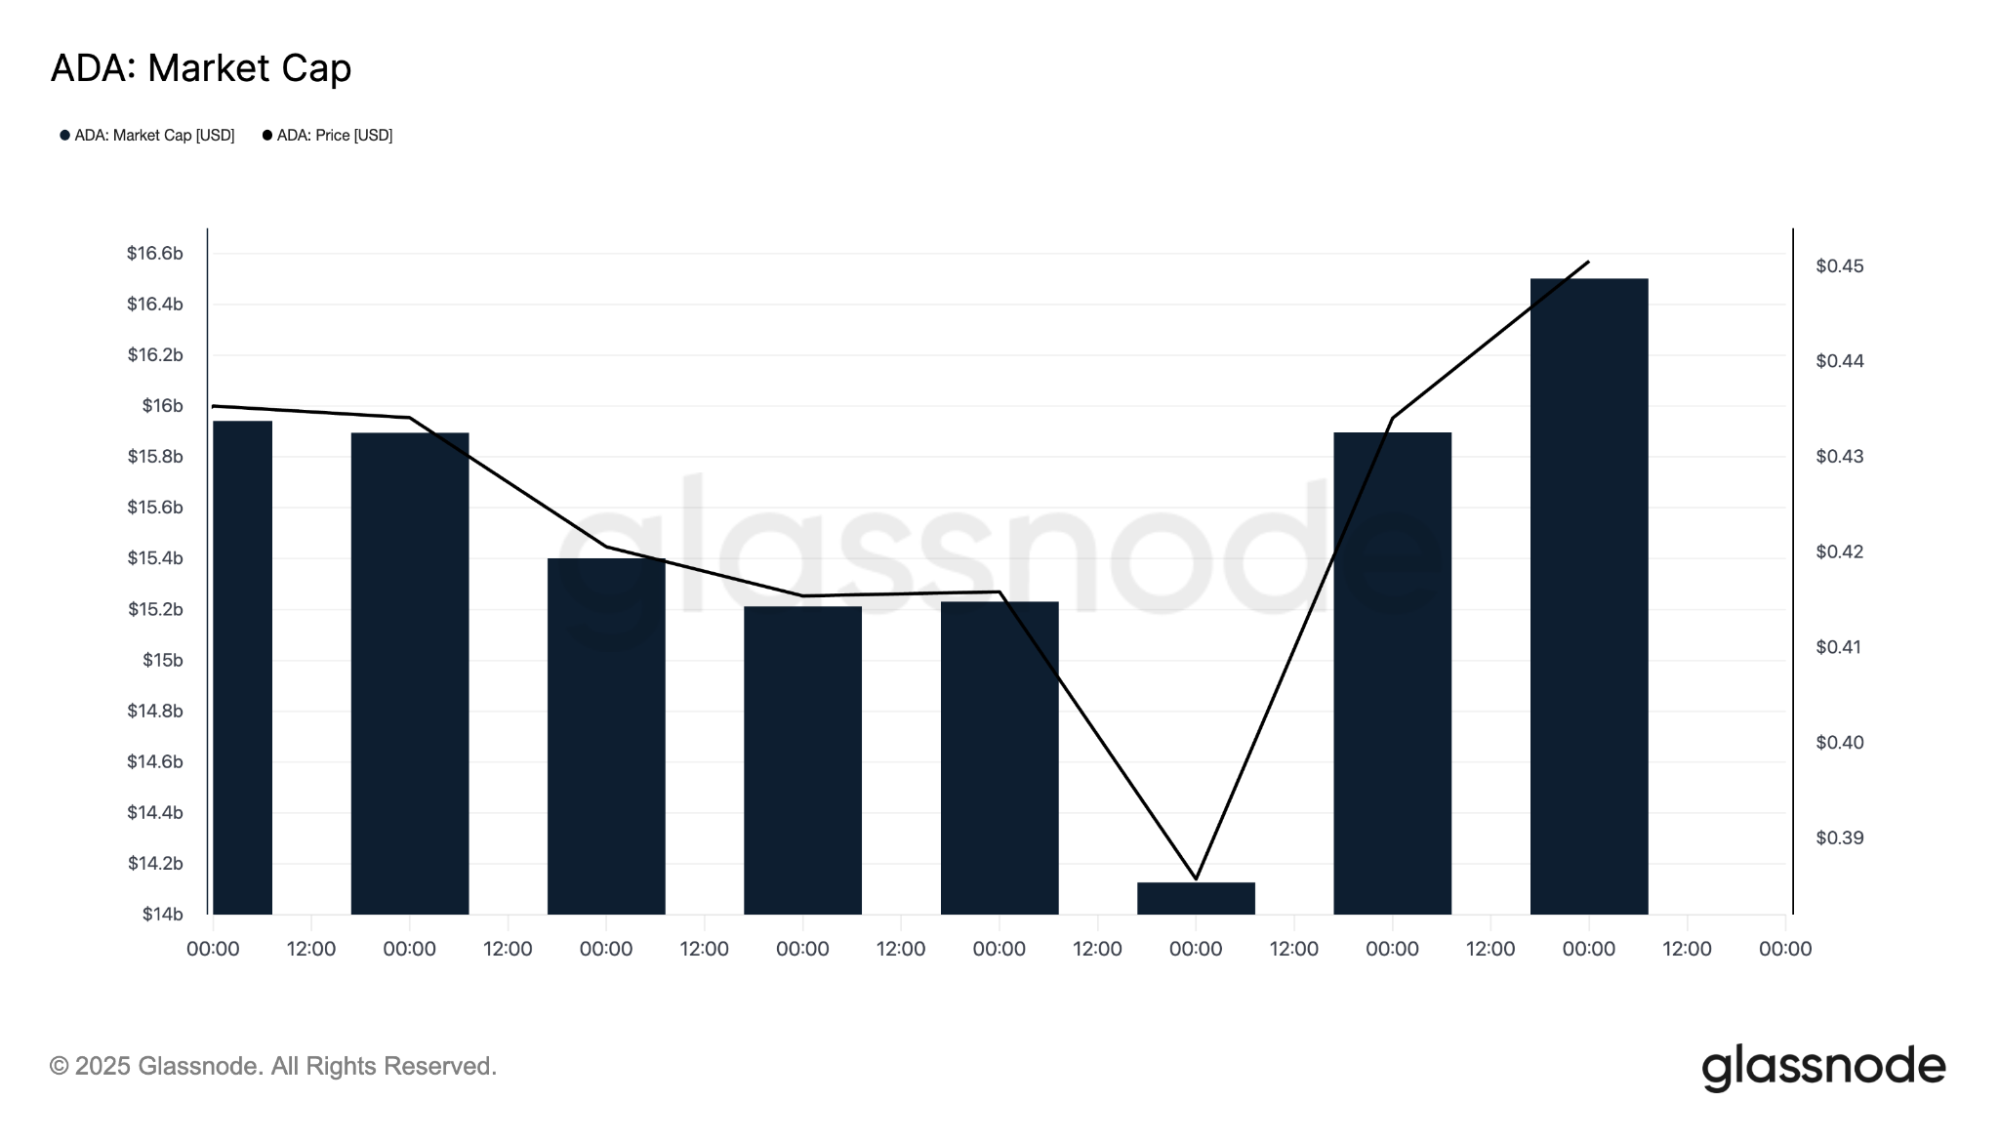
That shift is visible in the Cardano market cap chart: ADA’s valuation moved higher even though supply barely changed, which means the gains came from actual buying pressure rather than dilution.
The price drawdown from all-time highs also tells a bigger story. ADA is still down nearly 86% from its peak, one of the deepest drawdowns among major Layer-1 networks.
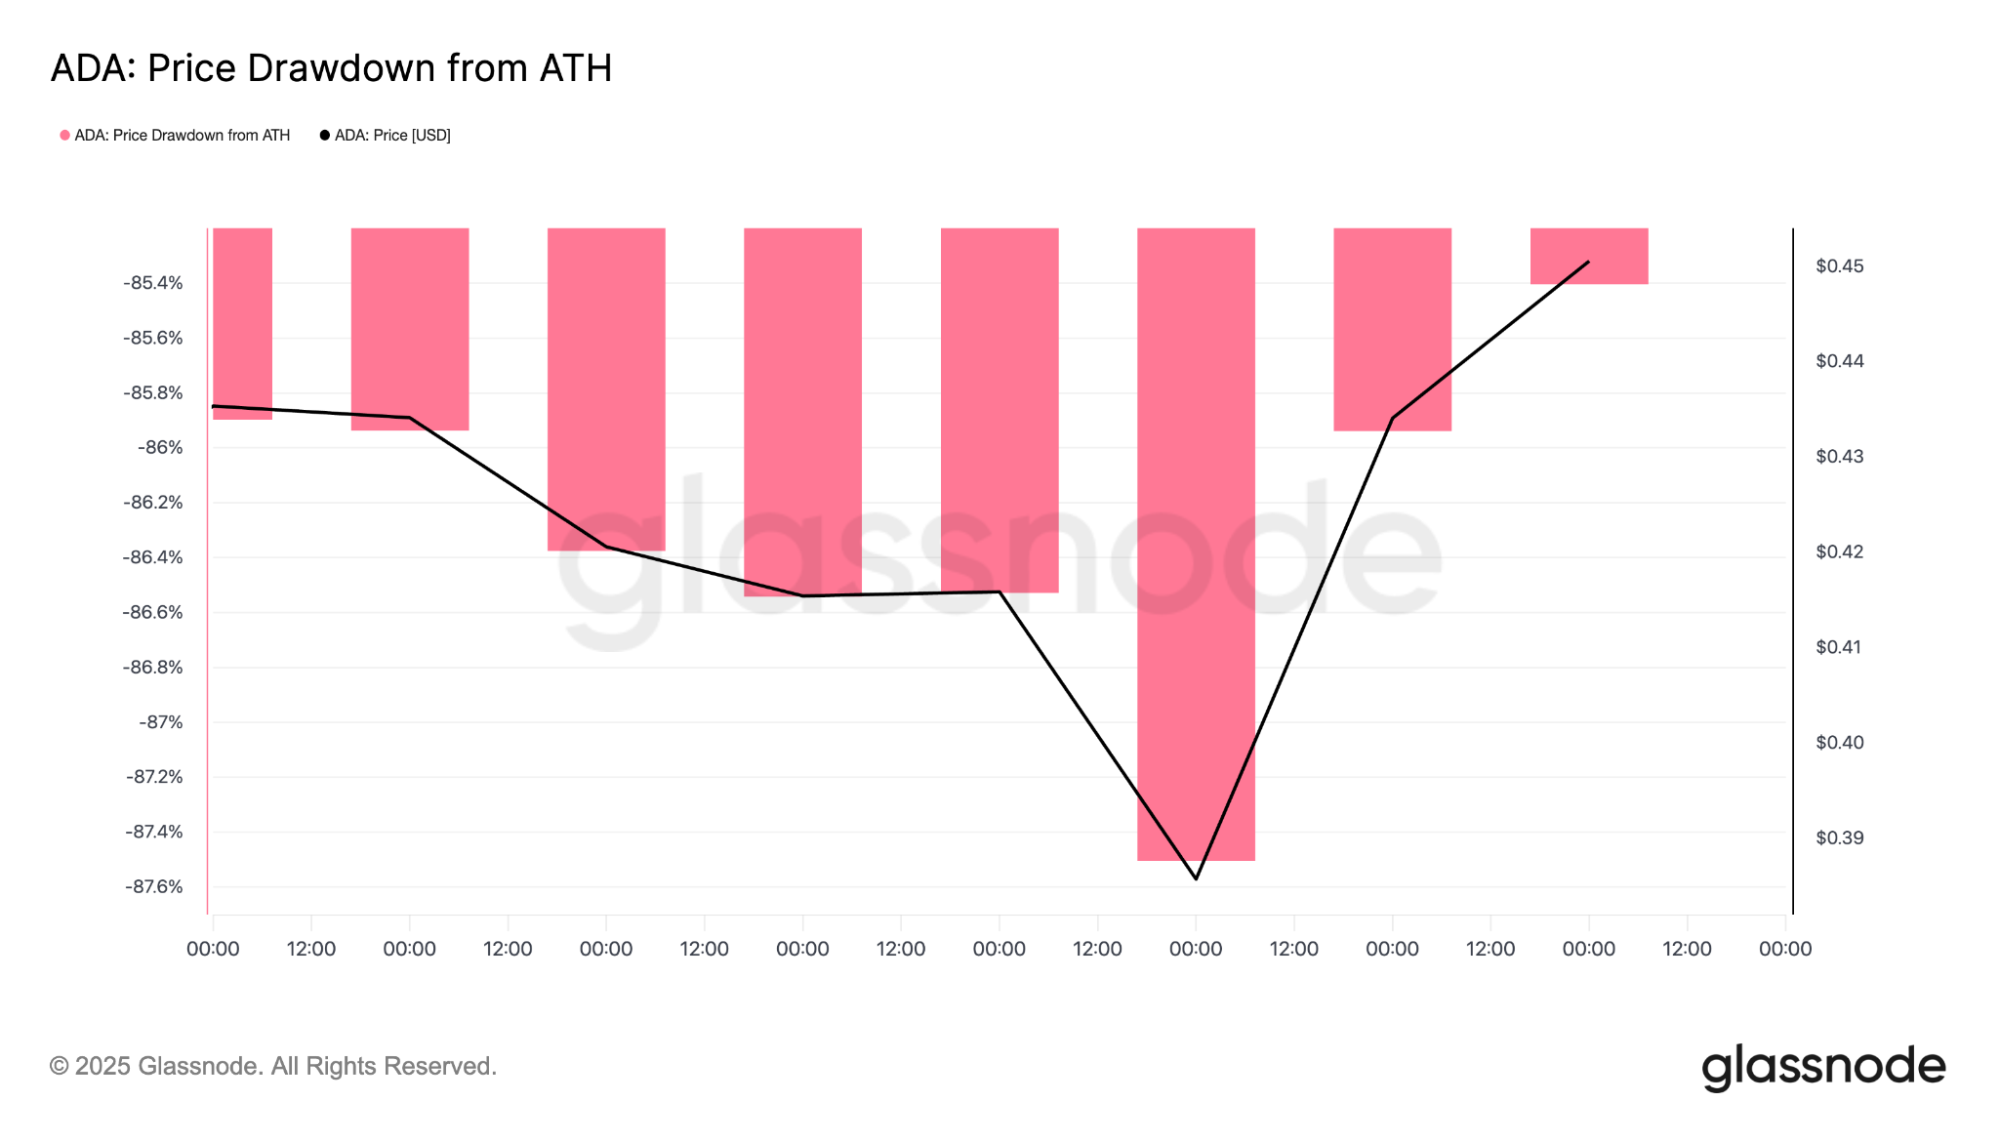
Historically, ADA only reaches levels this extreme nearing the end of macro bear phases. The last time it hovered around this zone, it made a strong recovery within the following months.
On-chain signals don’t guarantee a breakout, but they show that sellers are finally slowing down and early buyers are stepping in. After more than a year of steady decline, that alone is a meaningful change.
Daily chart shows ADA defending long-term support
Looking at the daily chart, the structure becomes much clearer. The ADA price has been inside a major downtrend since July, consistently printing lower highs and lower lows.
The large descending resistance line remains intact, and ADA has now tested the long-term support range around $0.36–$0.38 several times. The newest bounce came from the upper edge of this same zone, reinforcing its importance.
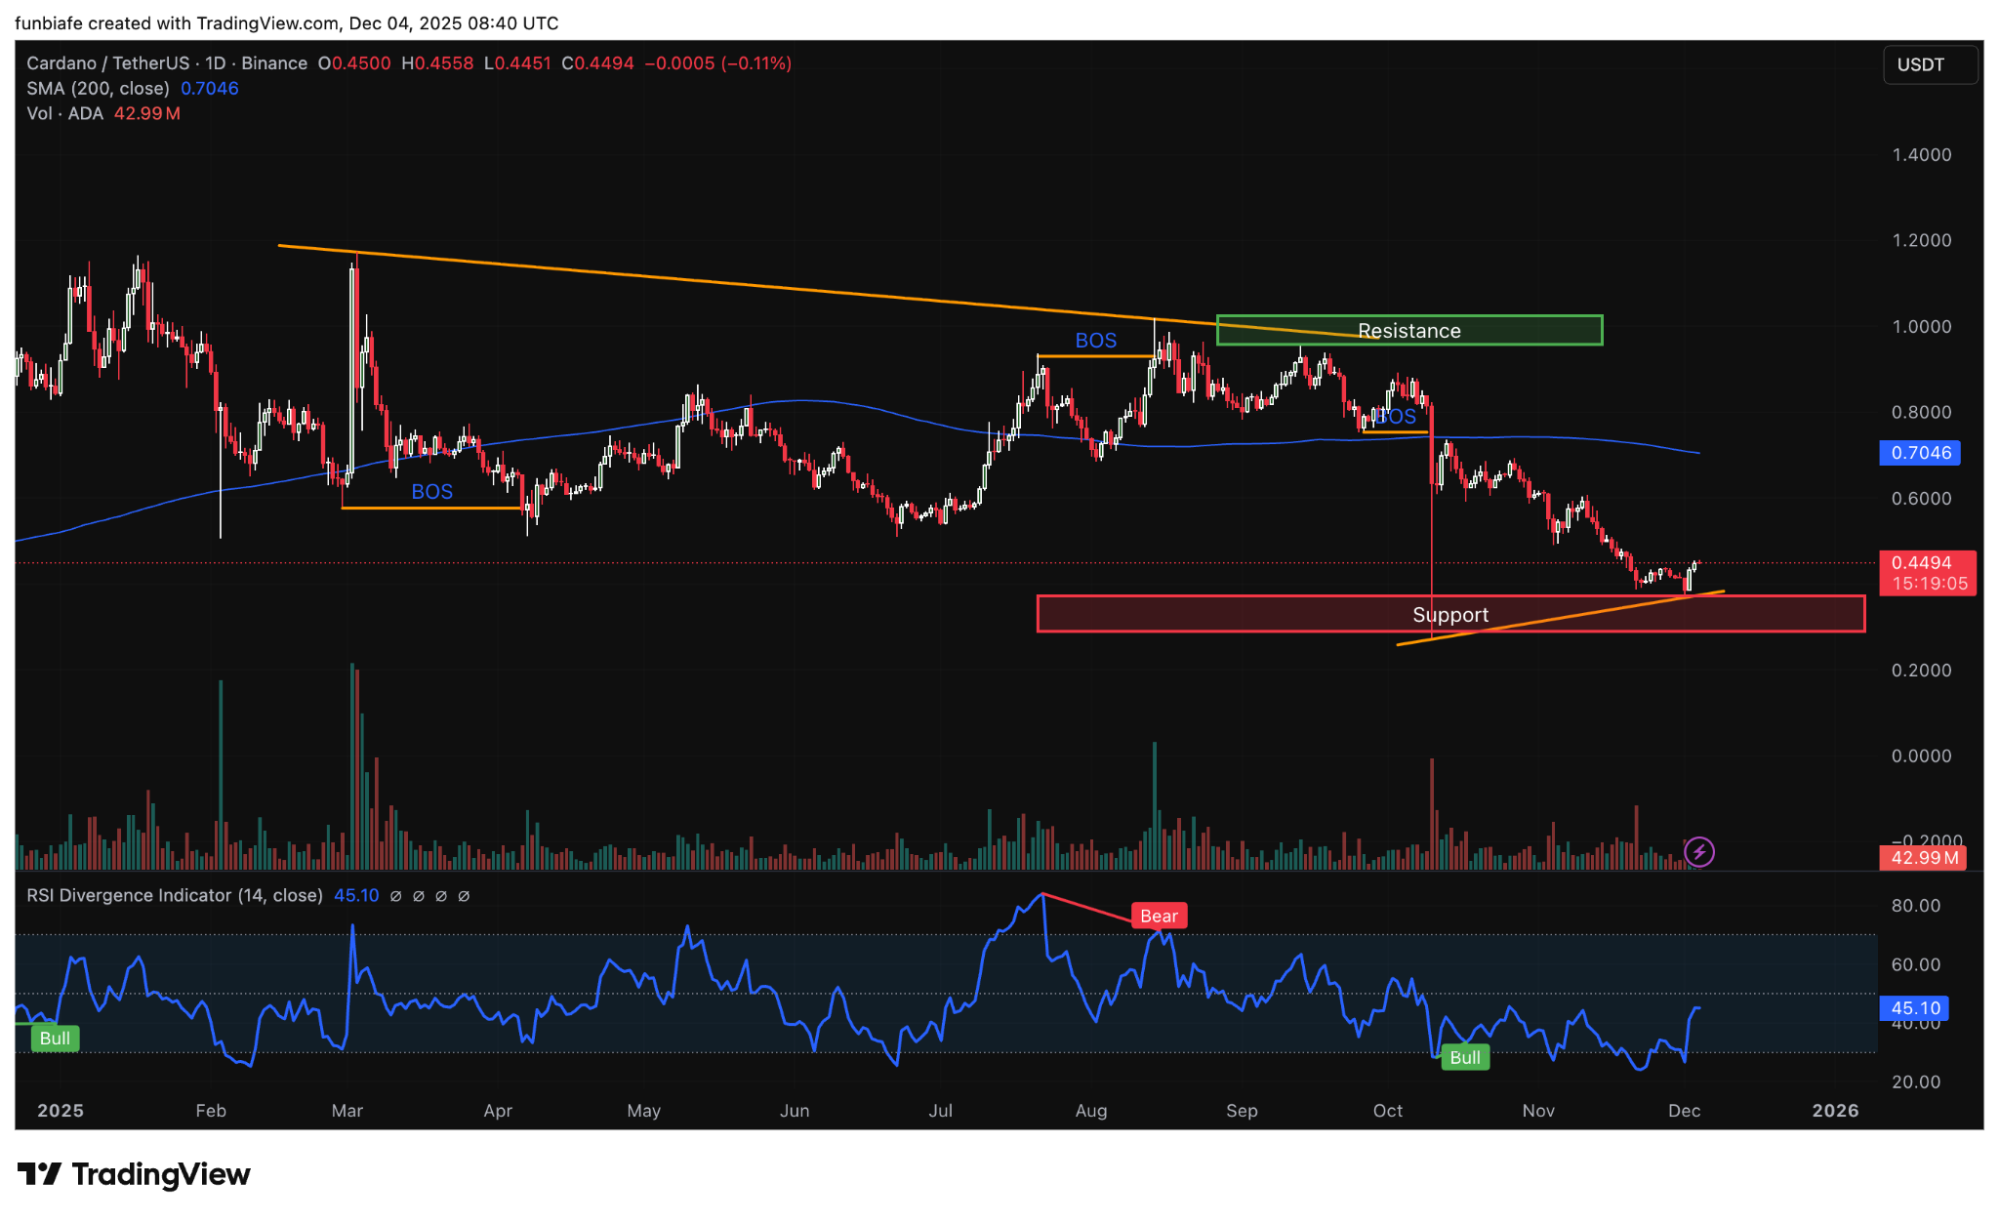
Daily ADA price chart analysis.
The 200-day moving average sits all the way up at $0.70, far above the current price which confirms how deep ADA is into its macro correction. But it also means that any strength here would mark an early reversal, similar to what happened in previous cycles after ADA reached exhaustion.
The RSI on the daily chart shows a clear bullish divergence. While the ADA price kept falling, the RSI formed higher lows. Historically, this pattern appears near the end of strong downtrends, especially when the divergence stretches across multiple attempts to break support.
The last time ADA printed a divergence this clean was in early 2023, right before it staged a multi-month recovery rally.
If ADA continues to respect the ascending support line underneath and holds above the red demand zone, the chart indicates the worst part of the selloff might already be behind us.
4-Hour chart signals ADA’s first real shift in momentum
On lower timeframes, ADA is starting to show the first break in a downtrend that dominated November.
The 4-hour chart highlights how the ADA price reclaimed the $0.43 level and is now pressing against a cluster of recent wicks around $0.45.
This level previously acted as support before turning into resistance after the breakdown. Reclaiming it is a crucial first step before ADA can push to the next Fib levels.
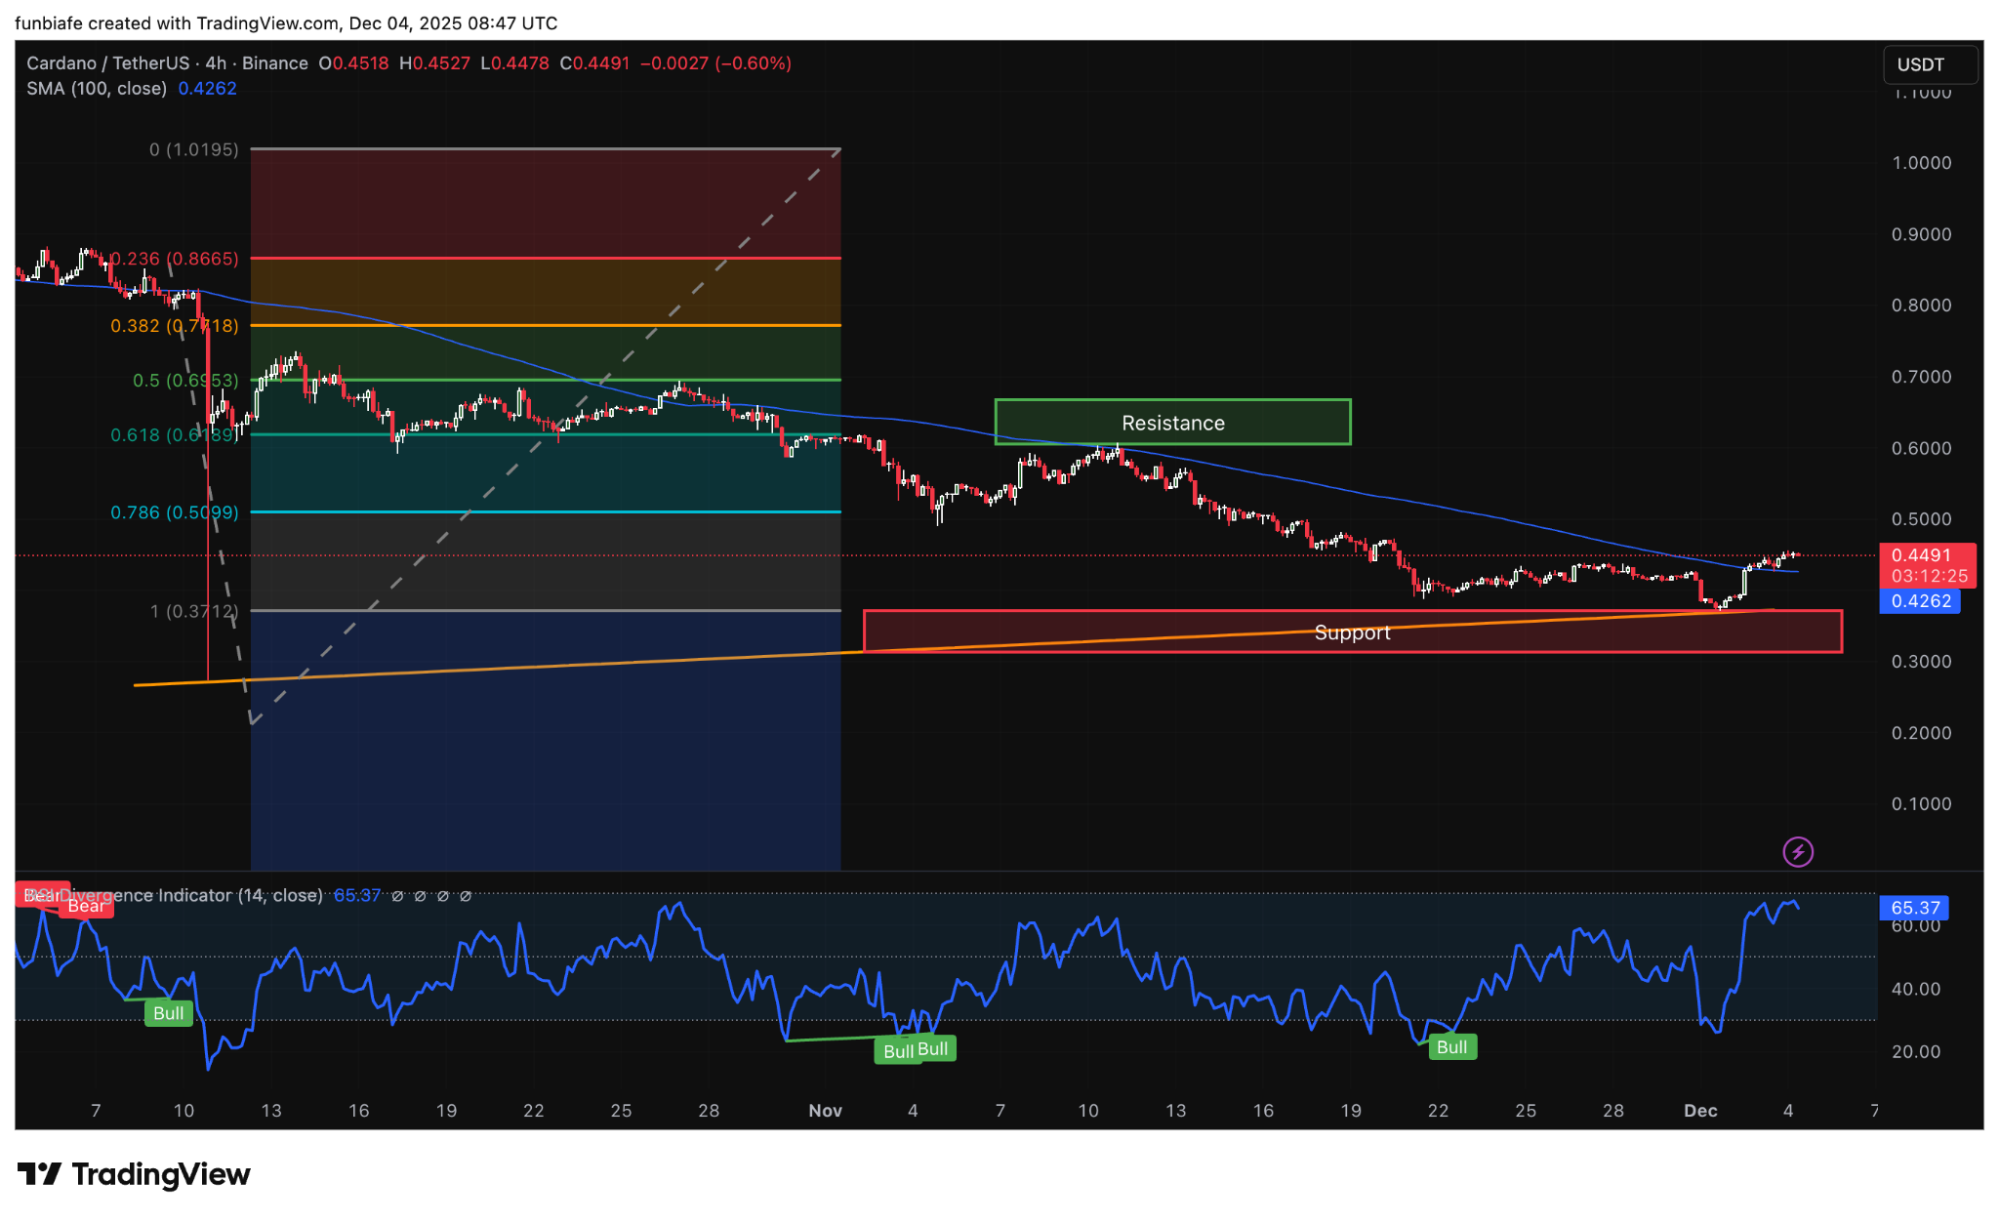
4-Hour ADA price chart analysis.
The Fibonacci retracement placed over the recent macro swing shows that the 0.382 level sits near $0.47, which is the same zone where the SuperTrend buy signal is pointing. If ADA can flip that level into support, momentum could expand quickly, with the next Fib targets sitting at $0.55 and $0.62.
The RSI on the 4-hour chart is also showing strong bullish divergence. It printed a low of 25 when the ADA price hit $0.36 and has climbed rapidly since then, now sitting above 65.
This indicates strengthening short-term momentum, even though ADA hasn’t yet broken out on the larger timeframe. The overall takeaway is simple: the downtrend is weakening. ADA isn’t bullish yet, but the structure is no longer purely bearish.
What’s next for Cardano?
Cardano now sits at a very important moment. The SuperTrend buy signal is the strongest early reversal indicator ADA has printed in months.
The daily RSI divergence indicates momentum has quietly shifted beneath the surface. The 4-hour chart is showing its first signs of structure breaking. And on-chain data confirms that large holders have stopped selling into the drop.
ADA still has to reclaim resistance levels before any major trend reversal can be confirmed. The first test sits around $0.47, followed by the heavier resistance band between $0.55 and $0.60.
If price clears those areas with strong volume, ADA could begin forming its first higher-high structure since summer. But if ADA loses support around $0.42–$0.43, the market would likely retest the $0.36 zone again, and a deeper drop toward $0.31 would come back into play.
CoinCodex’s Cardano price prediction projects the ADA price climbing to $0.6038 over the next month, but that outlook really depends on whether buyers can keep holding the $0.42–$0.43 support and stay clear of another drop into the lower zones.
For now, the charts are giving ADA something it hasn’t had in a long time: the chance to build a real bounce.
Source:: Cardano Price Analysis: This ADA Indicator Just Flashed “Buy”