Key highlights:
- ADA is sitting right on a major support zone, and traders are starting to watch closely for any early signs that a reversal could be taking shape.
- The chart makes it clear what needs to happen before a 2x move even becomes realistic, not just hopeful.
- On-chain data and market structure aren’t fully aligned yet, which makes this a setup worth monitoring rather than chasing.
Cardano is back on the radar after TheValueTrader dropped a line that always grabs attention: “$ADA will 2X real quick.” It’s the kind of statement that spreads fast, especially when the market feels quiet and traders are scanning for the next clean reversal.
But once you actually look at the charts, the picture becomes a bit more layered. The ADA price is sitting in an area where a bounce makes sense, but the structure still asks for patience.
The ADA price is still stuck in a bigger downtrend
On the daily chart shared by TheValueTrader, the first thing that jumps out is the wide descending channel that has been guiding Cardano’s price action for months.
The ADA price has been sliding from the upper part of that channel toward the lower boundary, and the latest move looks like another test of that zone rather than a confirmed trend change.
For now, the channel is still calling the shots. Sure, reversals often start at the bottom of a range or channel, but they usually need strong follow-through to show buyers are doing more than just reacting to a low price.
$ADA will 2X real quick. pic.twitter.com/tuEDcnSQAP
— The Value Trader (@TheValueTrade) January 19, 2026
The same chart also projects a possible upside path toward the 2.618 level around $0.6242. That area lines up with prior reactions and sits well above current levels, which explains why it looks attractive. But the ADA price would have to reclaim several zones on the way there before that target becomes anything more than a long-term scenario.
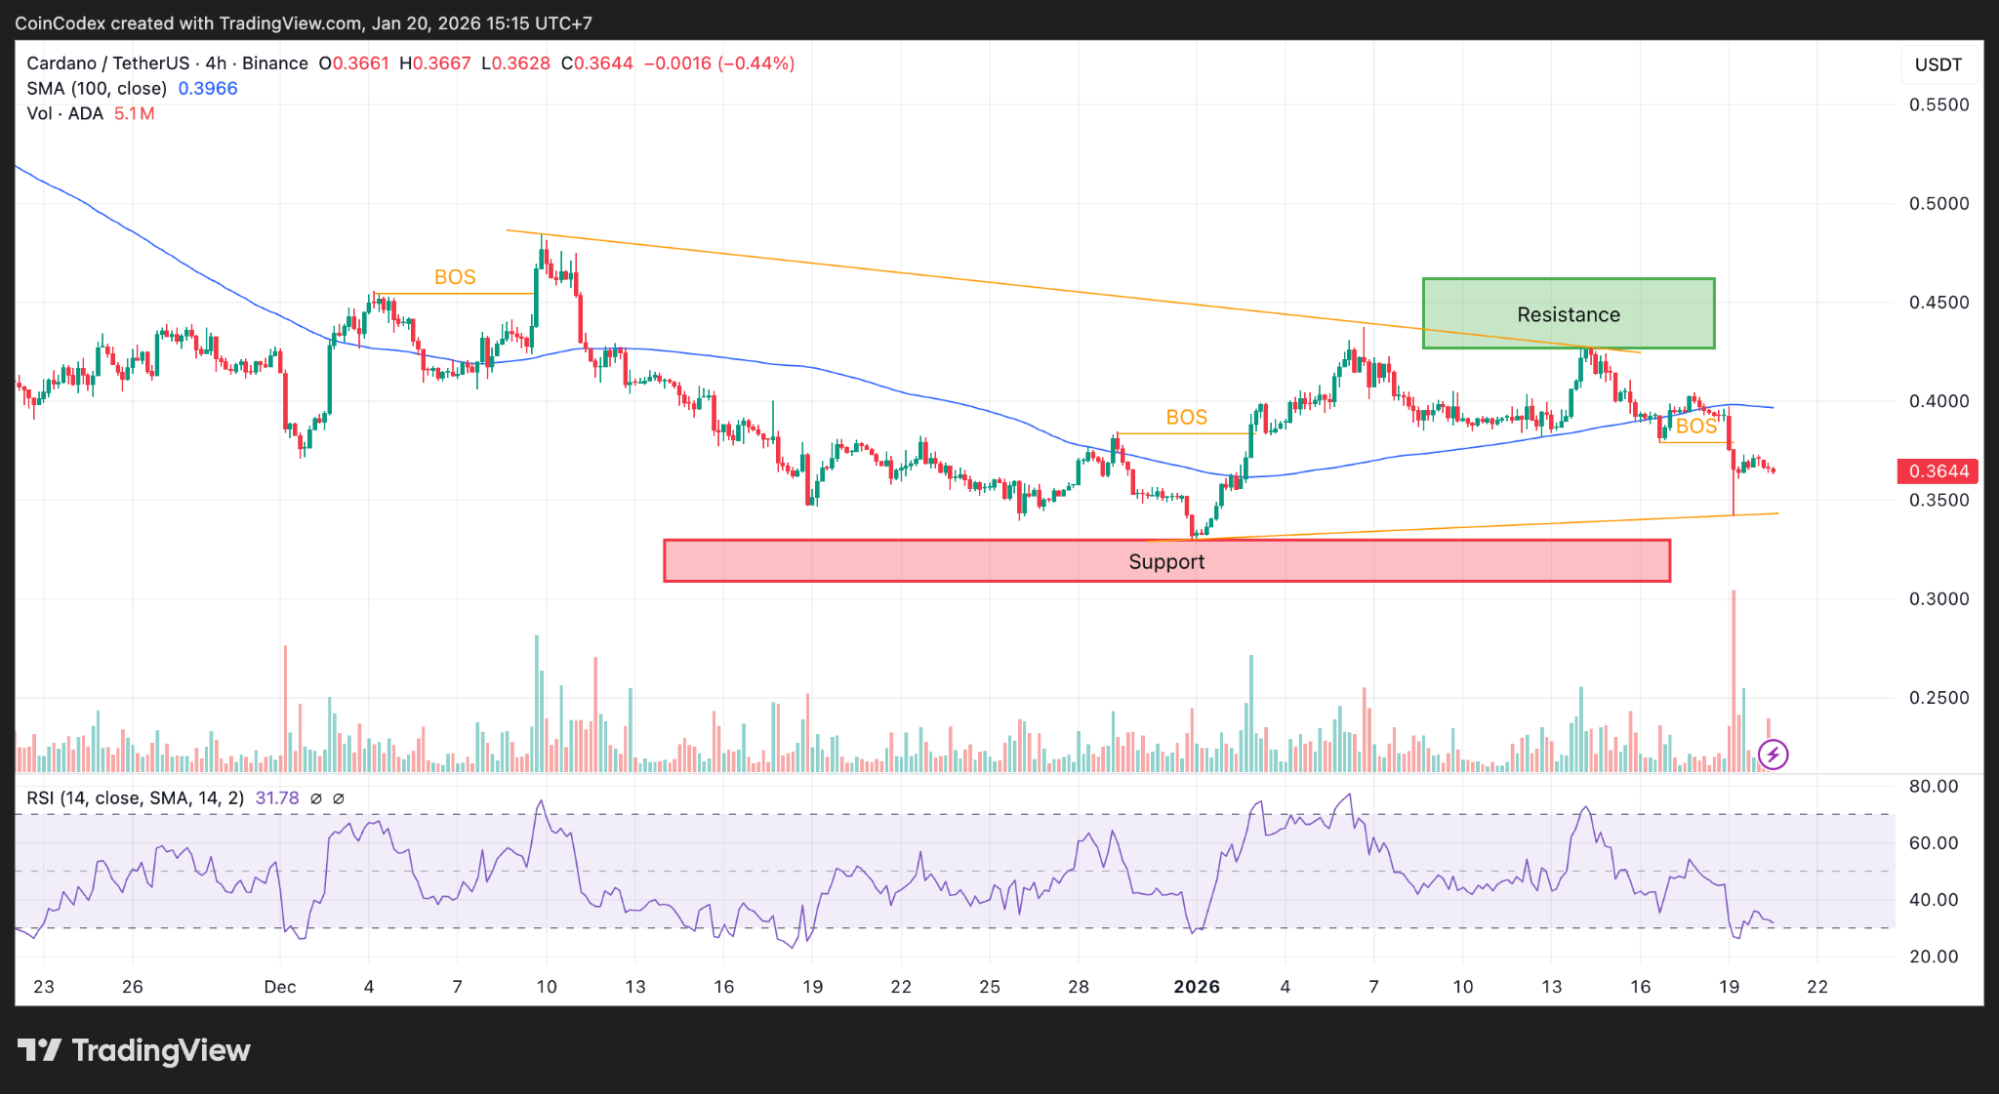
ADA’s 4-hour chart feels more like damage control than a breakout
Now looking at the 4-hour chart, the tone is more cautious. ADA is currently ranging around the $0.3644 level, while its 100-period SMA is placed above at $0.3966. This range makes it crystal clear where the trend is headed in the shorter term, despite some attempts to move above.
4-hour ADA price chart analysis.
There’s also a clear support zone just below current price, roughly in the low-to-mid $0.30s. This area has acted like a floor during recent consolidation. The issue is that the latest drop into this zone came fast and with conviction, and RSI is now hovering near 31, which reflects heavy weakness and a market flirting with oversold conditions.
Oversold doesn’t automatically mean reversal. Sometimes it just means sellers are still in control and the market needs time to breathe. In other words, the ADA price is near a level where a bounce could happen, but the short-term structure still looks like it’s trying to stabilize after damage.
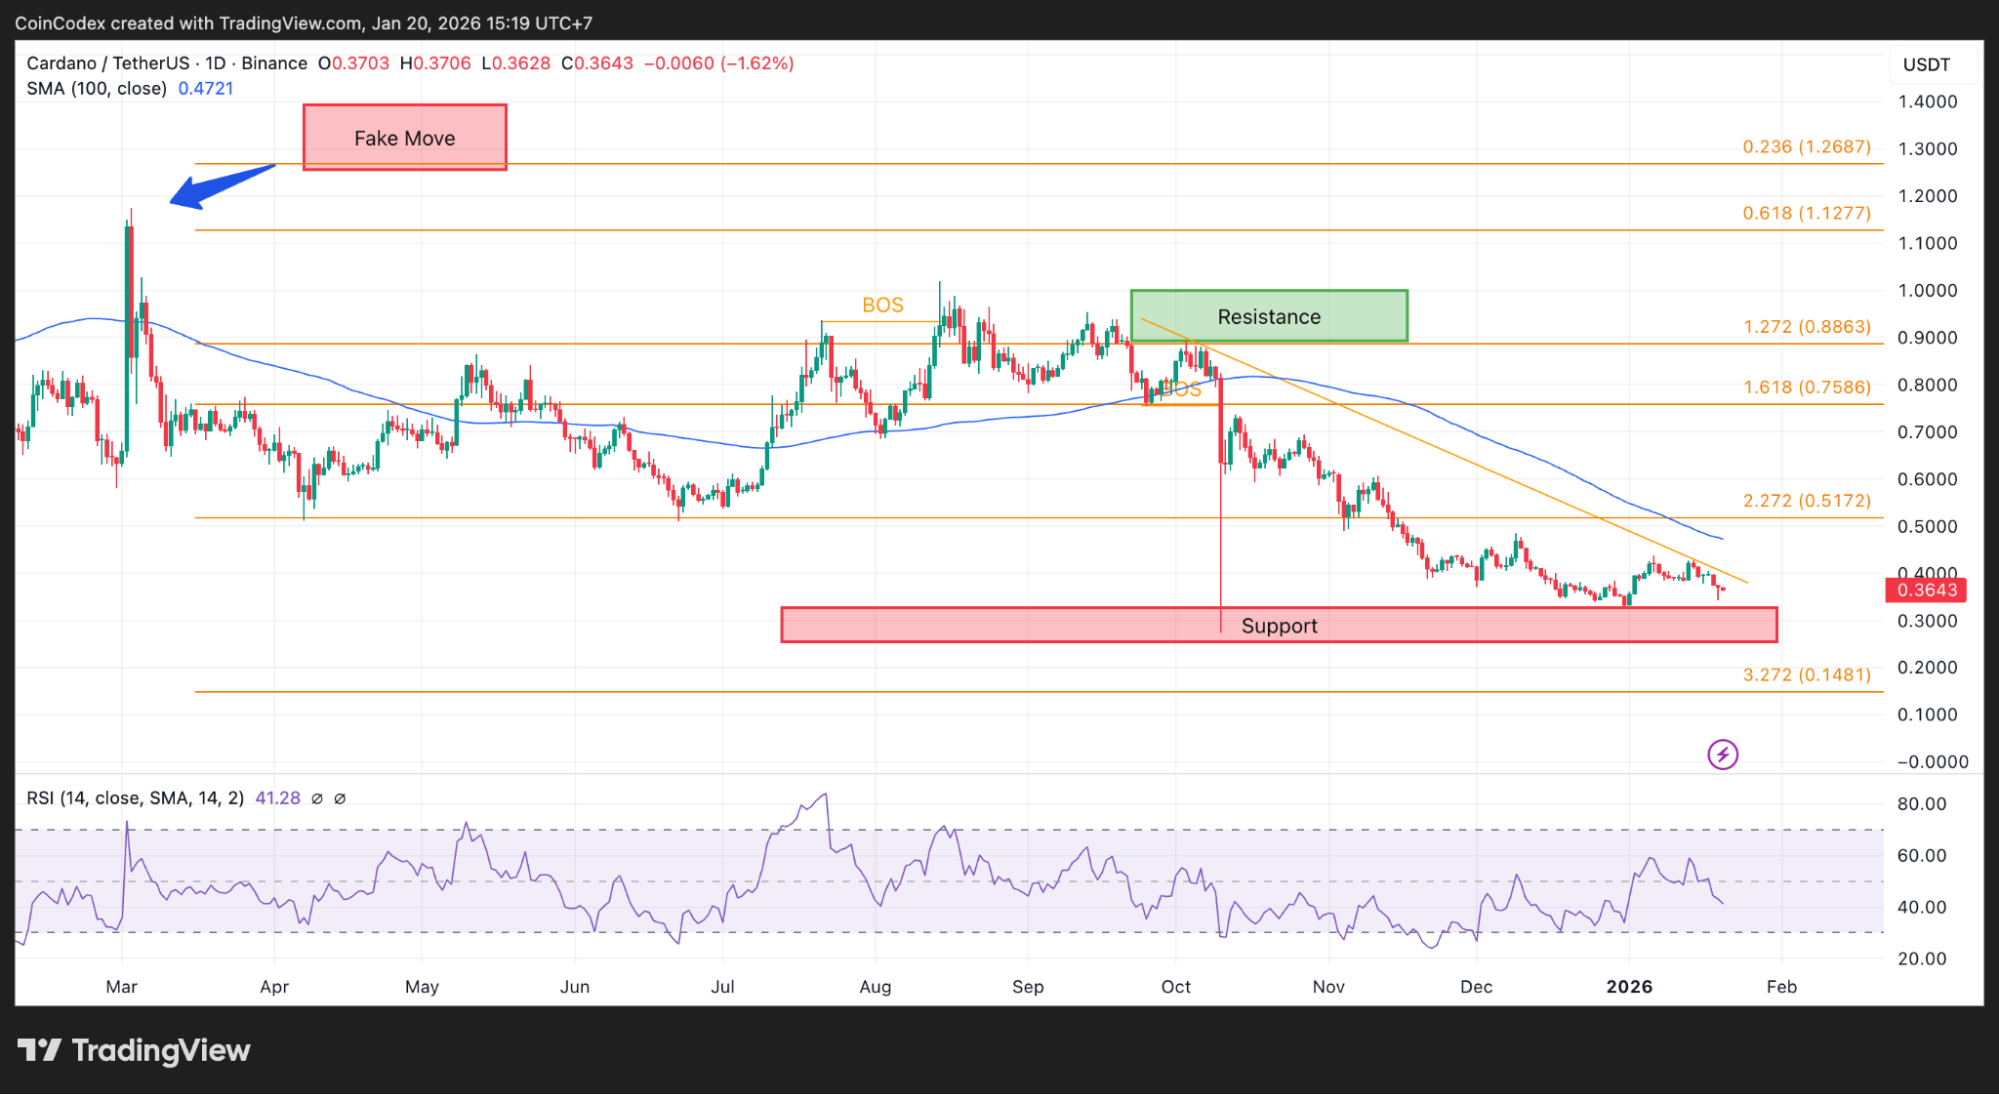
The ADA daily chart highlights the “fake move” problem
Looking at the second daily chart, you can clearly see why confidence is still fragile. There’s a marked “Fake Move” higher, which fits what played out: price pushed into resistance, failed, and then rolled back over into a slow grind lower.
Once again, the ADA price is sitting just above a broad support zone in the low $0.30s. Next, resistance is holding firm in the $0.88-$0.90 area, with the downtrend line continuing to press down, ready to cap any rallies that might form.
Daily ADA price chart analysis.
It is for these reasons that it is too early to call for a quick 2X. A true 2X at this point would require far more than a simple bounce. There would need to be a strong move through the downtrend line, the recovery of the major moving averages, and the ability to stay above the level of the breakdowns.
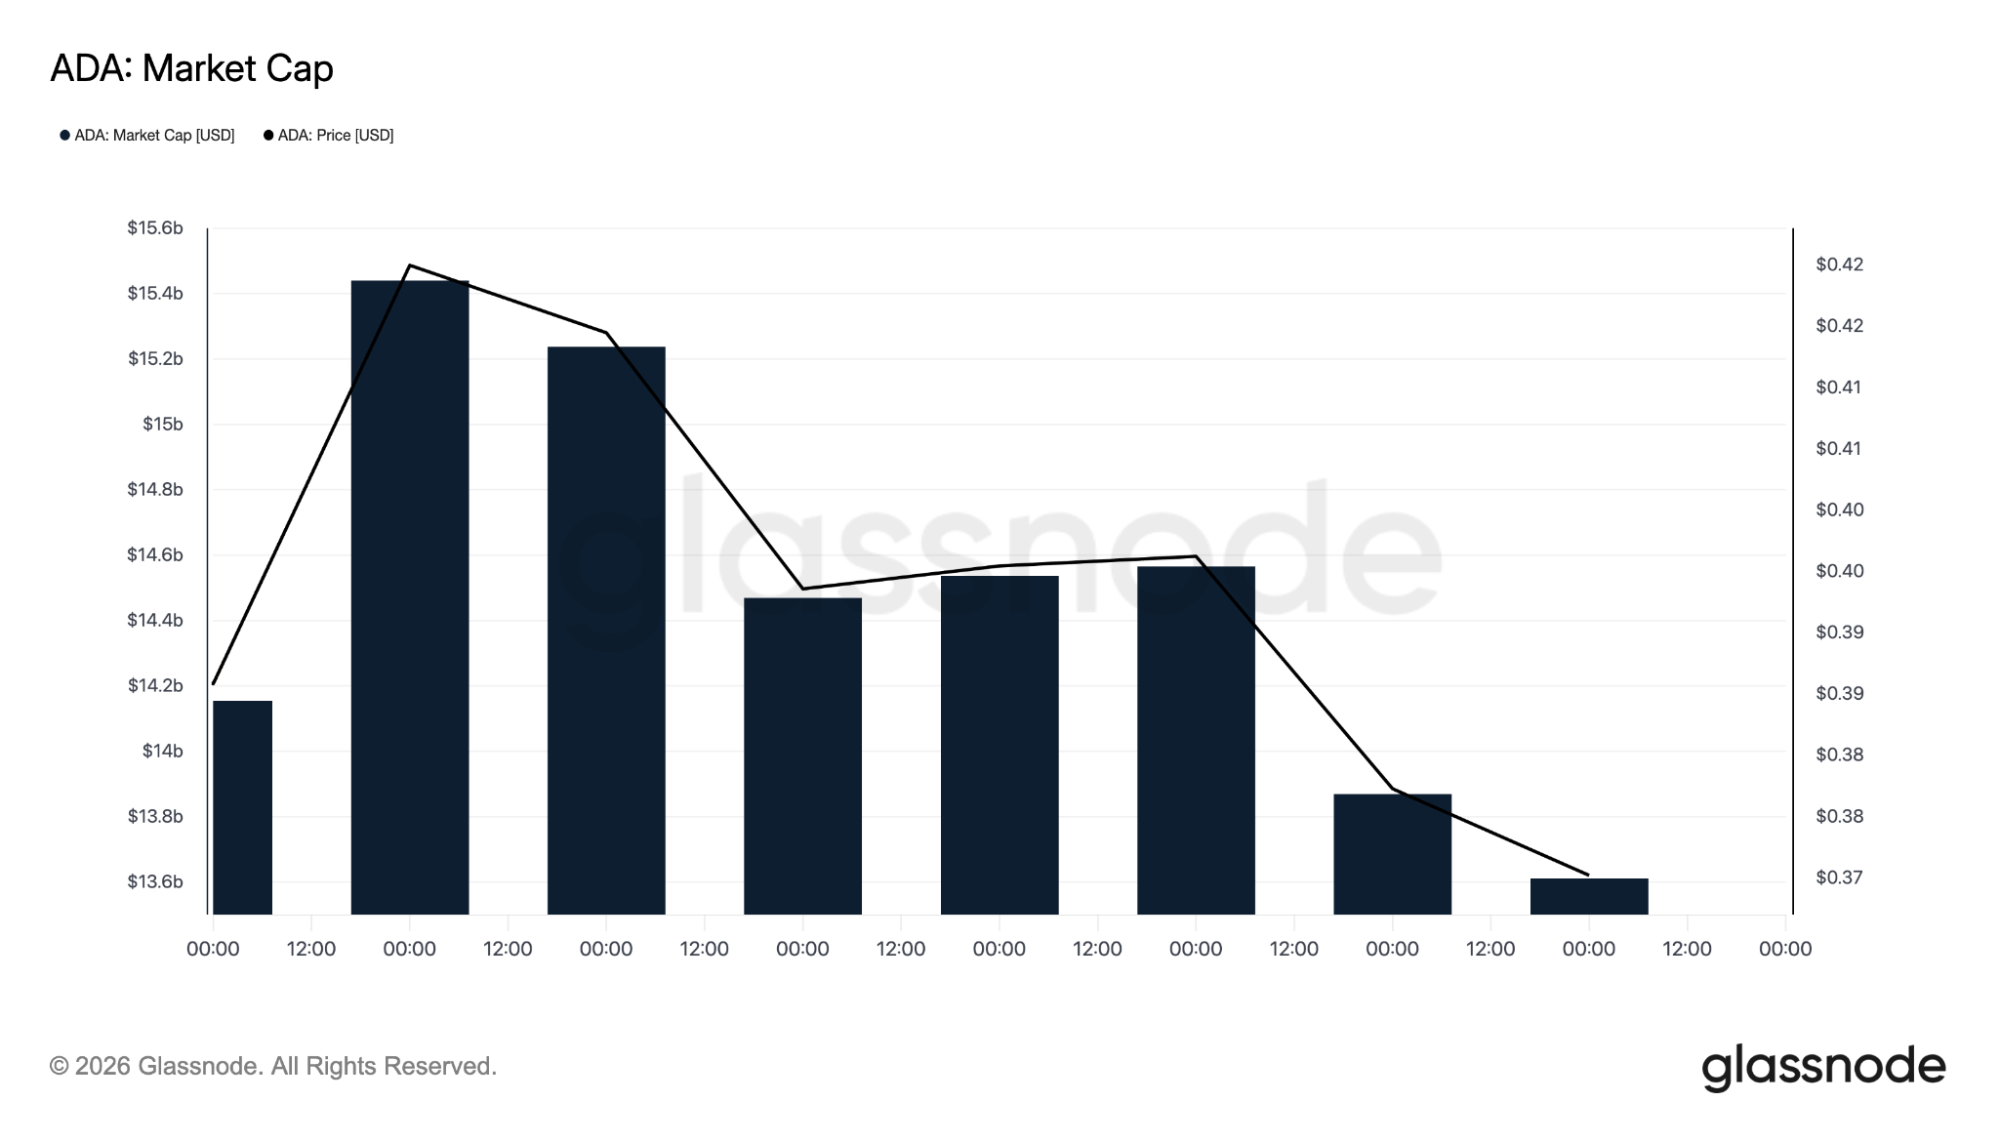
Cardano market cap and drawdown add important context
The Glassnode data helps zoom out. The ADA market cap recently peaked near $15.4 billion before sliding toward $13.6 billion, while the ADA price drifted from the low $0.40s down toward $0.37. That tells you capital hasn’t been steadily flowing in. Instead, it looks more like money has been rotating out while price compresses lower.
The drawdown chart paints an even clearer long-term picture. The ADA price is still sitting roughly 86% to 88% below its all-time high, with that drawdown deepening as price slips. That kind of positioning can create powerful rebounds when sentiment flips, but it also means there’s a lot of overhead supply from past cycles waiting above.
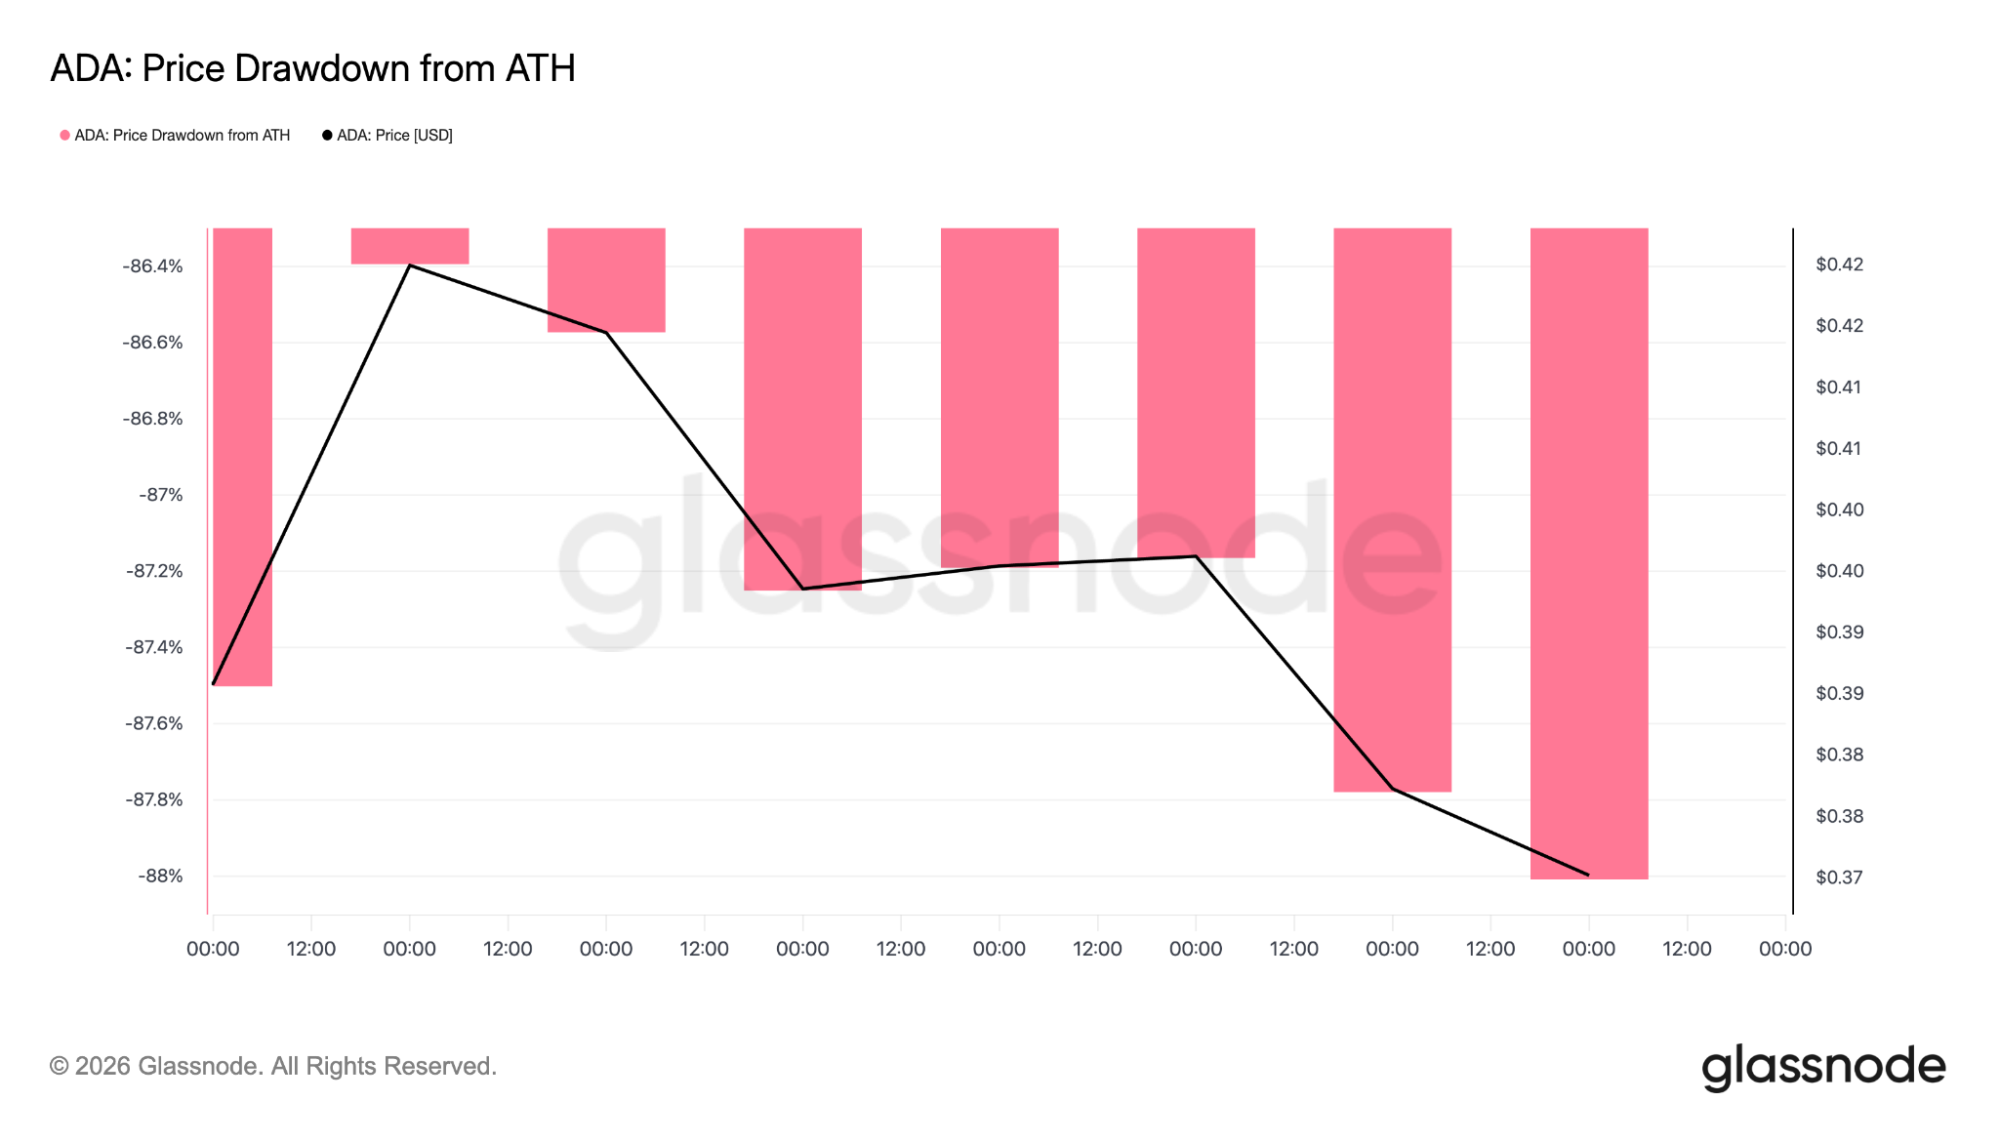
This is where both sides of the argument can coexist. Cardano is deeply discounted compared to its peak, which is exactly what reversal traders like to see. But at the same time, the market is still operating under the weight of a long downtrend, which is why confirmation matters more than hype.
What would make a “2X” case start to feel real?
For the bullish case to move beyond a hot take, the ADA price needs to prove that the support zone is holding with intent.
That usually means stabilizing above the low $0.30s, reclaiming the $0.3966 area where the 4H SMA sits, and then starting to print higher lows instead of quick pops followed by breakdowns.
If that happens, the conversation naturally shifts toward reclaiming bigger resistance zones. The $0.6242 area on the daily projection becomes much more relevant once the ADA price escapes the channel pressure and flips key levels into support.
CoinCodex’s 1-month ADA price prediction places the token around $0.5069. For that level to feel realistic, ADA first needs to prove it can hold its ground. That starts with staying above the low $0.30s and reclaiming the $0.3966 zone.
Source:: Cardano Price Analysis: Can ADA Deliver a 2x Move From Here?