Key highlights:
- BONK price rebounds from local support with strong market cap inflows and rising user activity.
- Chart patterns confirm a bullish structure, with traders watching the $0.000040 resistance zone.
- On-chain data shows increasing address count and transfer volume backing the price recovery.
| BONK price | $0.00003760 |
|---|---|
| Key BONK resistance levels | $0.00003780, $0.00004000, $0.00004500, $0.00005000 |
| Key BONK support levels | $0.00003250, $0.00003000, $0.00002789, $0.00002500 |
BONK is holding steady at $0.000035, as the meme token gains momentum after coming back from a recent decline to near the $0.000032 levels.
The currency is advancing towards a familiar resistance level of about $0.000038, where the rally-high level was established earlier this month. A daily close above this level could confirm a short-term breakout and open the door toward $0.000040 and beyond.
BONK price has already bounced nearly 13% off its recent low, and traders are watching to see if this move can extend into a larger trend. Support remains firm around $0.0000325, which has held during two recent pullbacks.
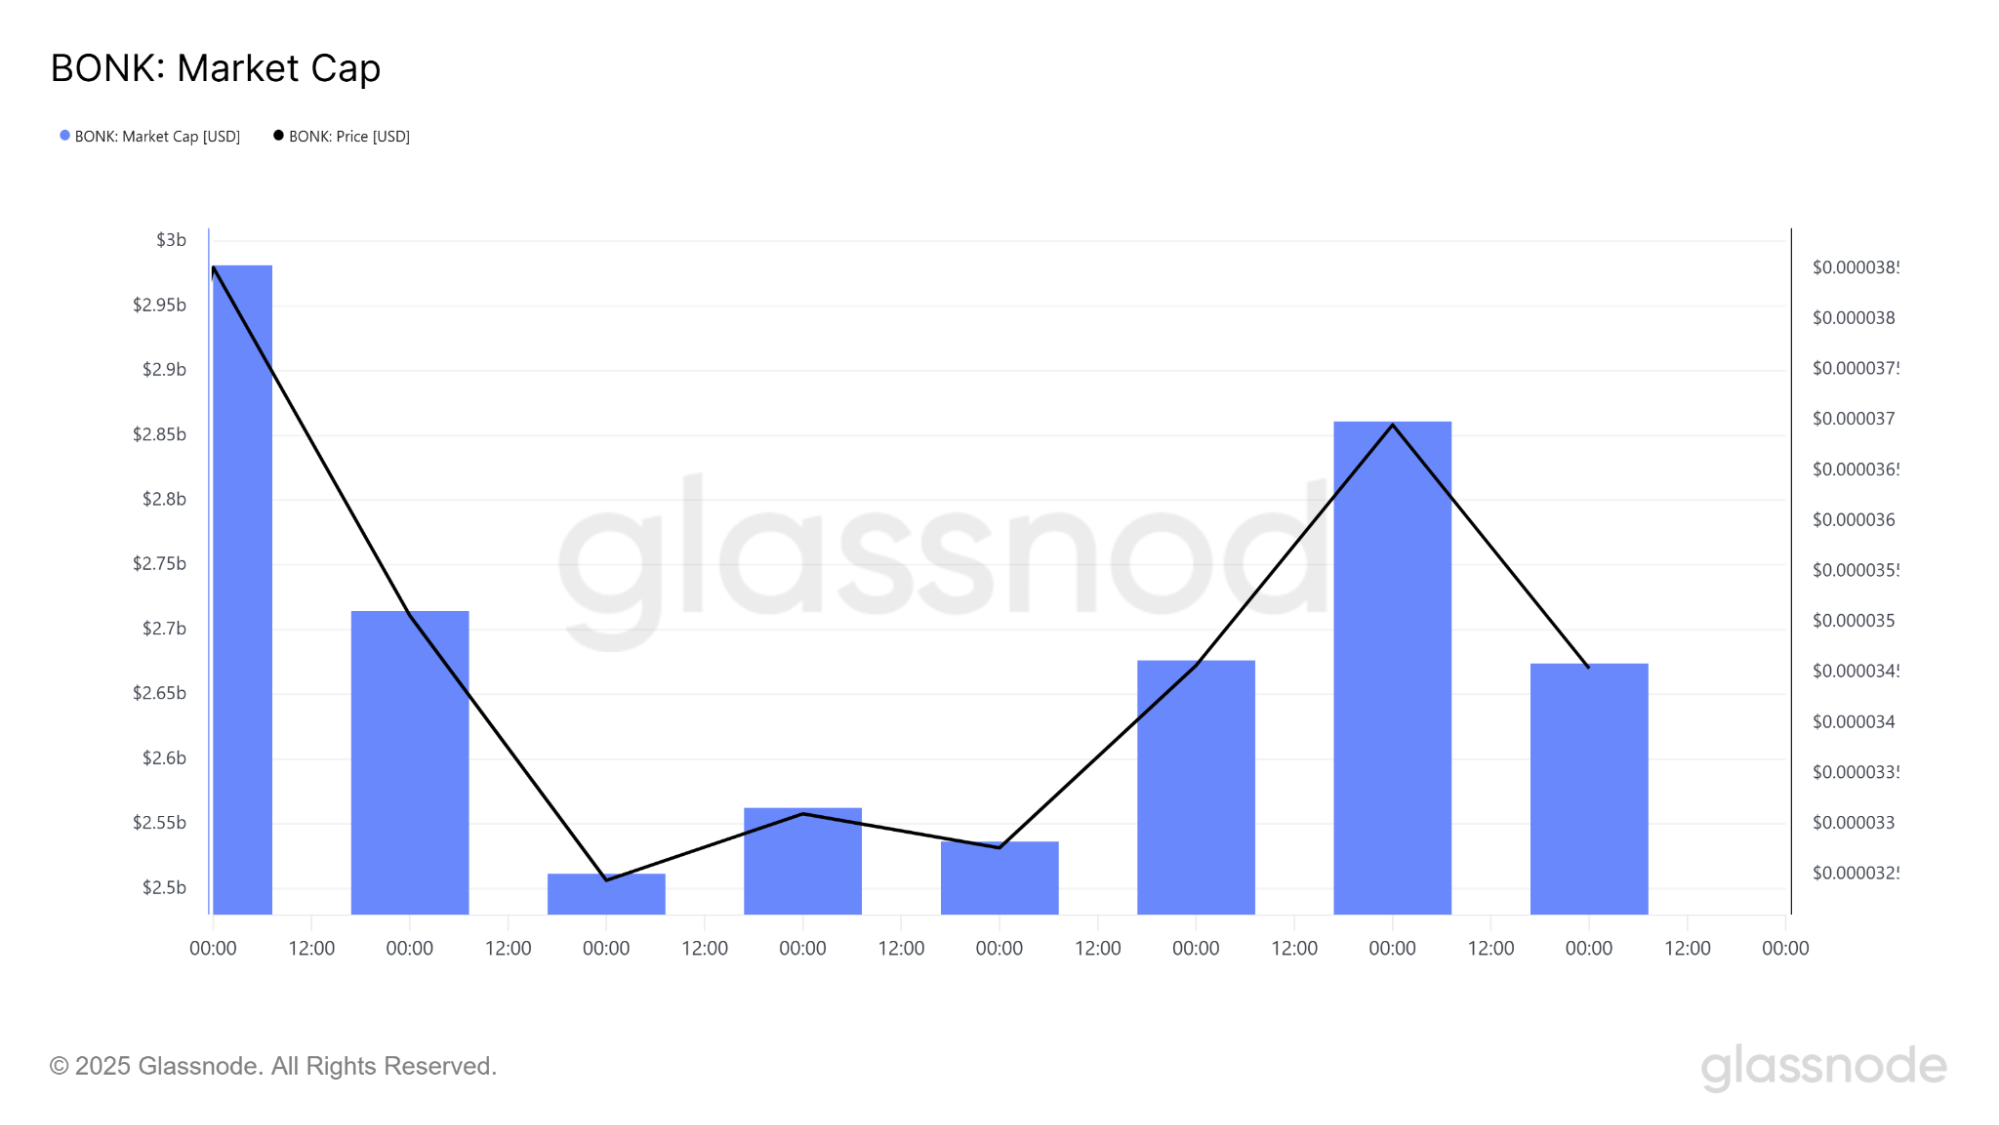
BONK market cap and address activity support the bounce
Glassnode data shows BONK’s market cap dropped from nearly $3 billion to $2.5 billion during the recent correction. The price followed closely, falling from $0.000038 to around $0.0000328.
That $2.5B zone has now been tested twice and held, acting as strong support. After the bounce, BONK’s market cap reclaimed $2.88B before settling near $2.68B in the latest session.
At the same time, BONK active addresses dropped from nearly 29,000 to 17,500 during the pullback. But user activity recovered first, and it rose above 28,000 before the BONK price fully caught up.
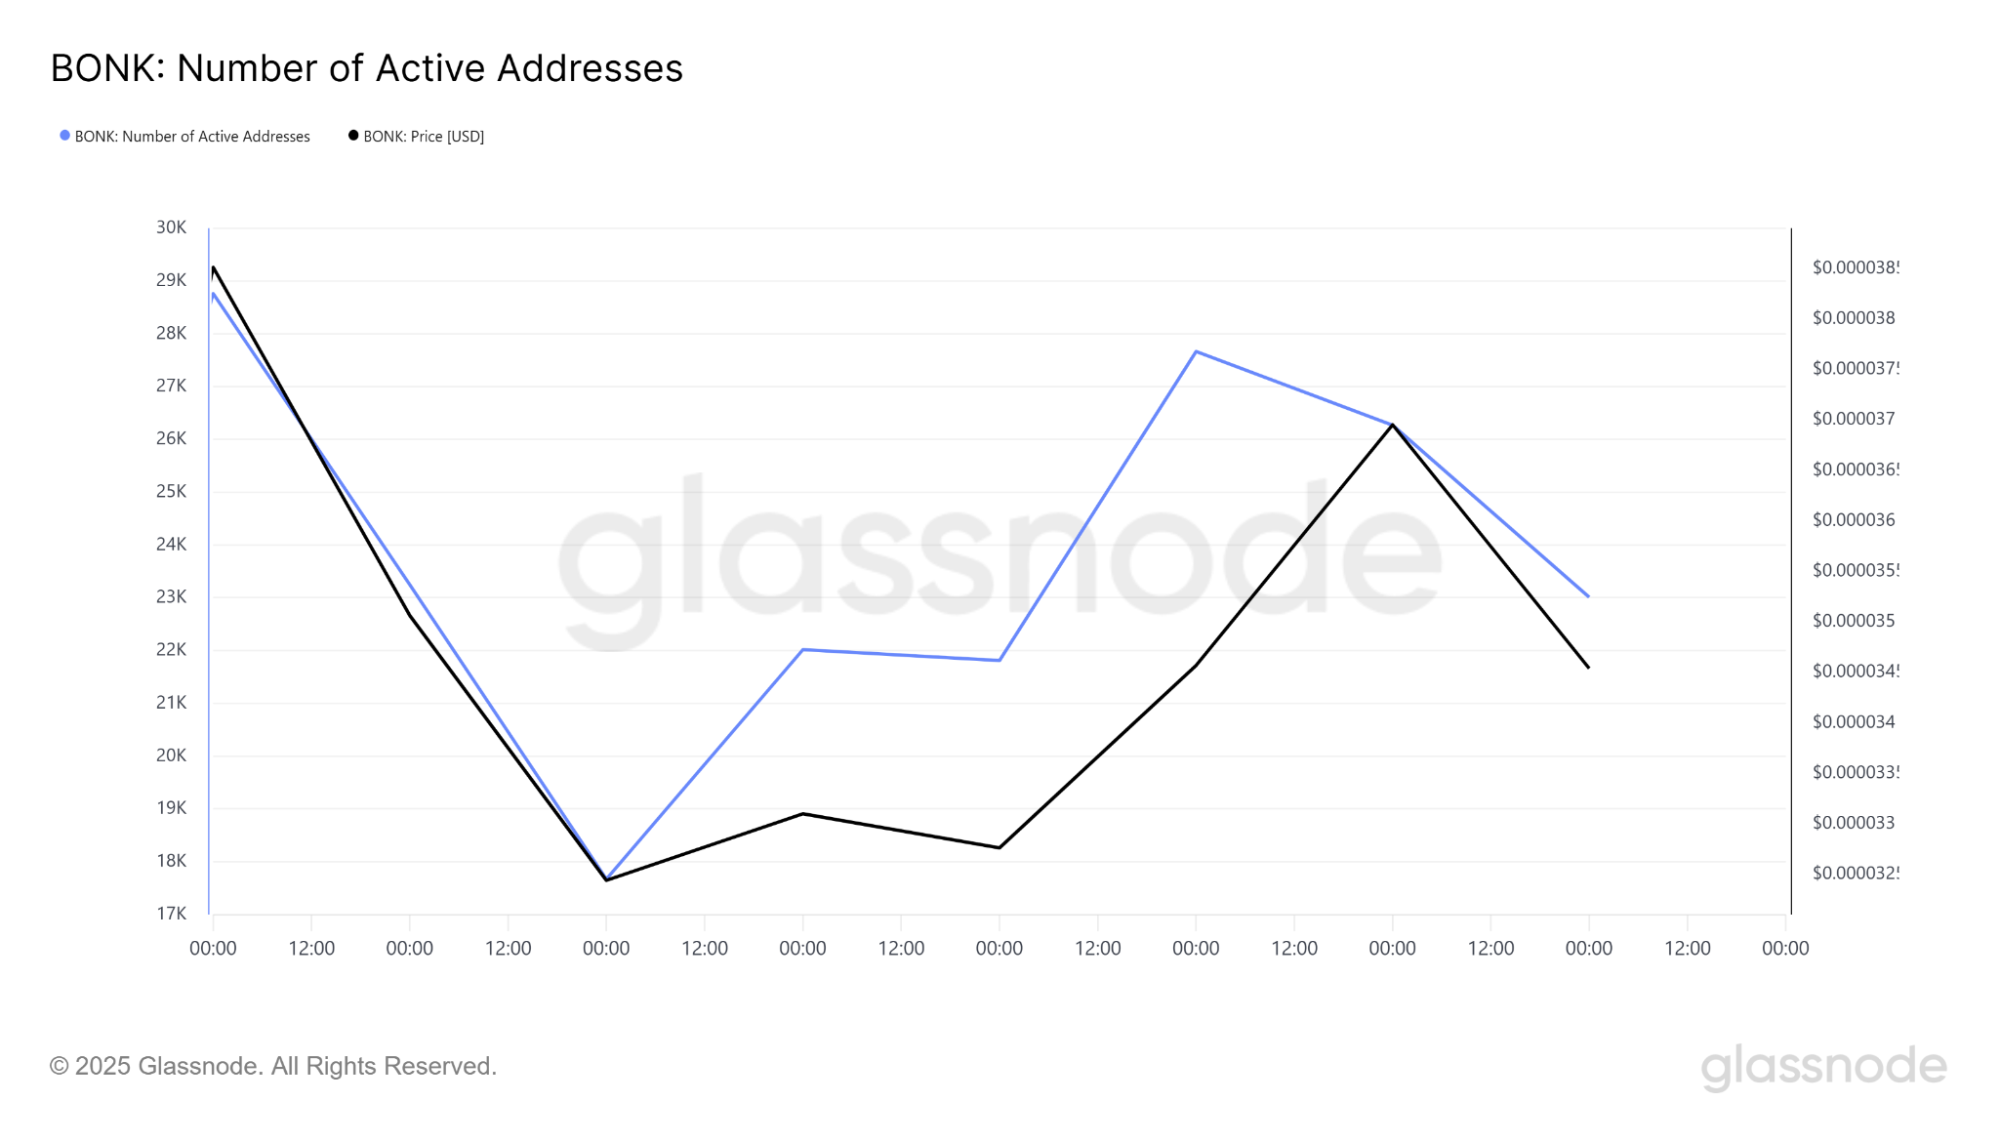
This kind of divergence, where addresses move first, often hints at smart accumulation before a price move. Both metrics dipped slightly in the final session, indicating either a pause or minor profit-taking.
If address activity picks up again while BONK price remains stable or rises, it could be a sign that the rally still has fuel.
BONK transfer volume shows shift from selling to buying
Transfer volume tells a similar story. Early on, BONK saw volume spikes above $500 million while the price dropped, a classic sign of sell pressure or whale exits.
But volume cooled off during the base-building phase and then started rising again as the price climbed. This transition from high-volume selling to volume-supported buying is a positive sign.
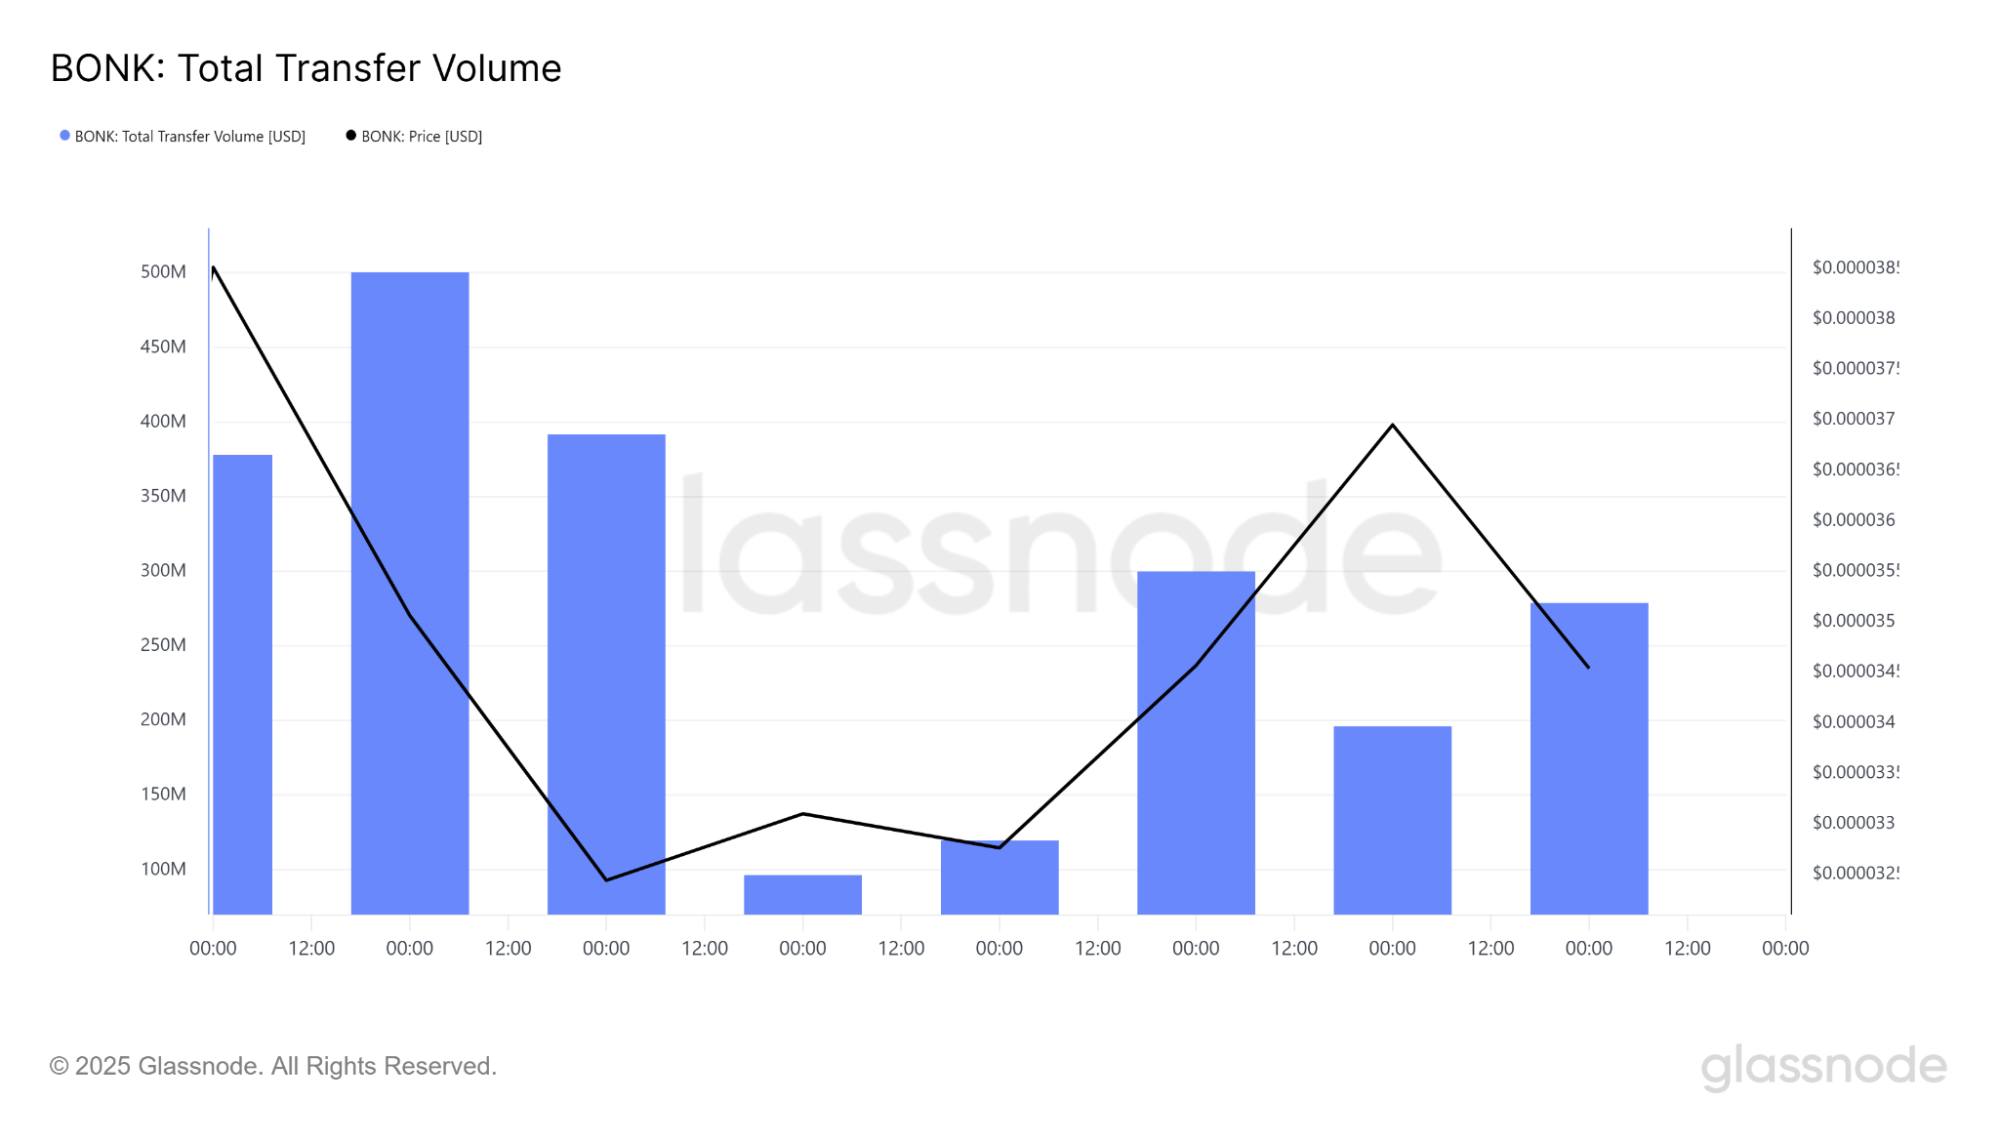
The current resistance sits around $0.0000378–$0.000038. A close above that with fresh volume would likely lead to a test of $0.000040 and possibly $0.000045 next.
If BONK Price pulls back again, $0.000033–$0.0000325 remains the zone to watch for a bounce.
BONK bullish structure points to potential blue sky breakout
What makes BONK price structure particularly interesting now is that it’s trading in what many analysts call “blue sky breakout territory.”
The coin recently accepted above the yearly Ichimoku cloud, a rare event for meme coins, and volume profile data shows limited resistance overhead.
$BONK accepts above yearly cloud and we are set for blue sky breakout territory
It looks strong
Notice interactions for year
Super clean pic.twitter.com/qrgwx1mncg
— TimelessBeing (@Timeless_Crypto) July 24, 2025
Historically, BONK traded between $0.000009 and $0.000025 for over a year, forming a deep base of accumulation. Since breaking out from that range in early July, the trend has flipped bullish. An inverse head and shoulders pattern played out from February to June, and price broke above the neckline cleanly.
This kind of structure is typical in major reversals, especially when supported by consistent volume and rising user activity, which BONK has both. Even though BONK price is above the neckline region ($0.000030–$0.0000325), buyers are in charge.
This type of visibility is normally a harbinger of further upside, especially when combined with a clean chart and clear breakout zones. BONK is no longer just riding the meme wave; it’s starting to build a narrative of its own.
BONK price analysis
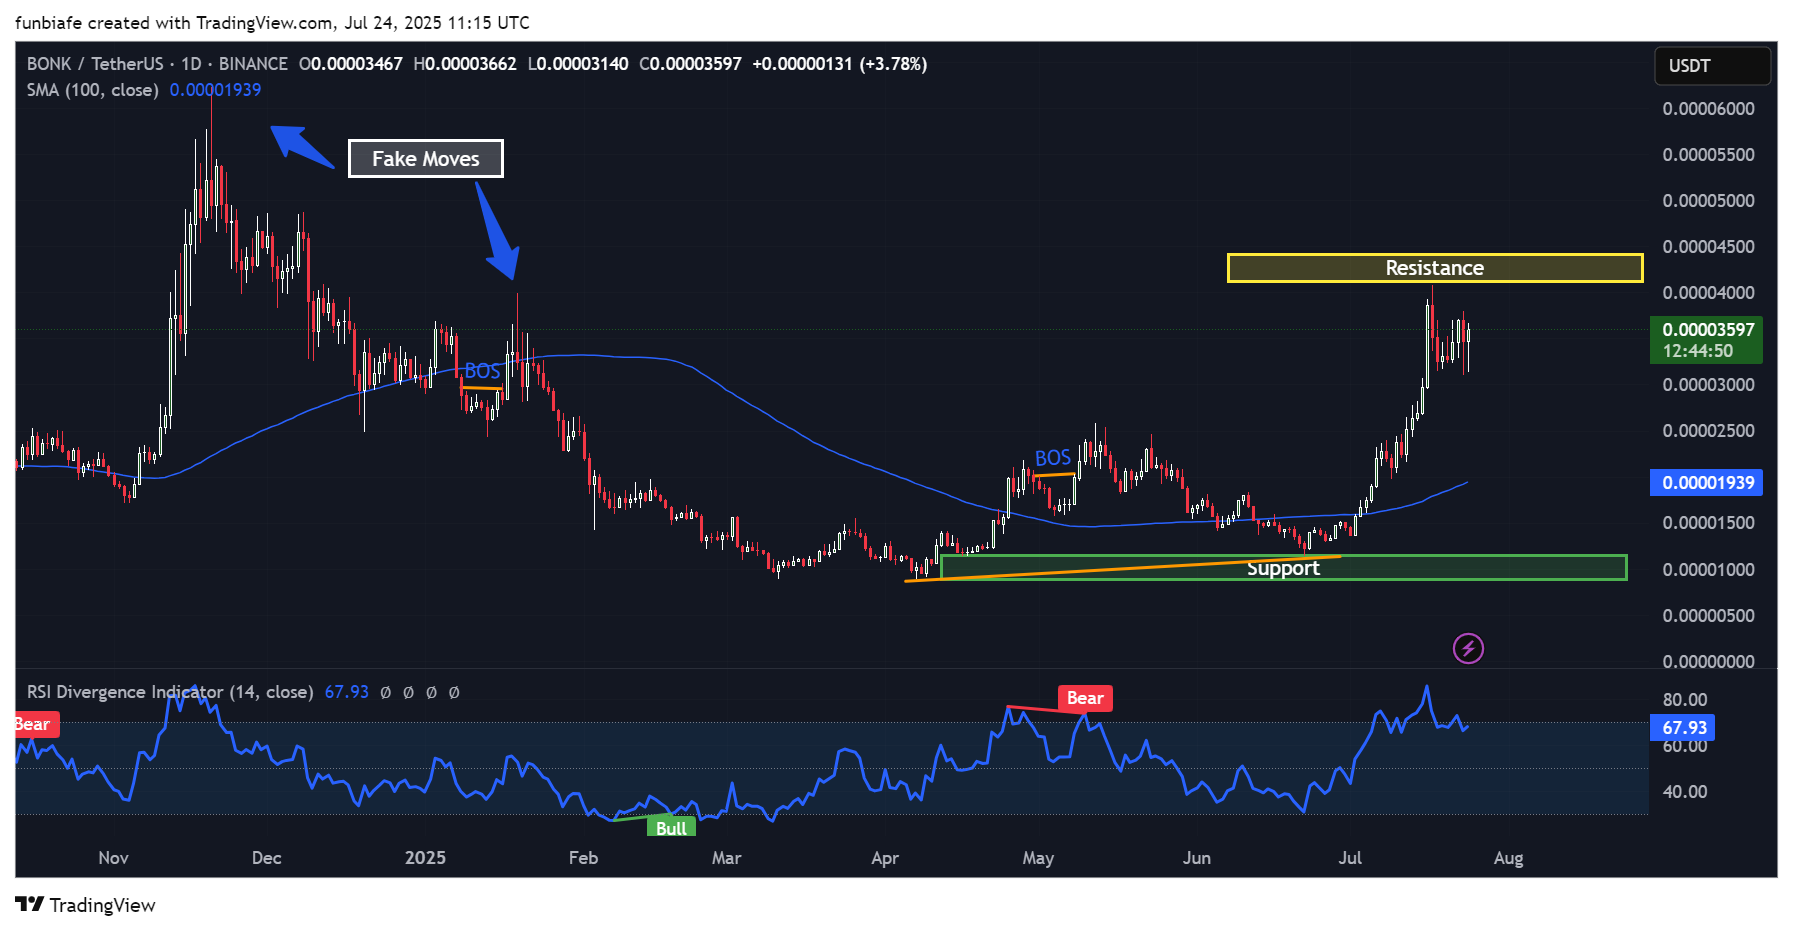
BONK daily chart. Source: Tradingview
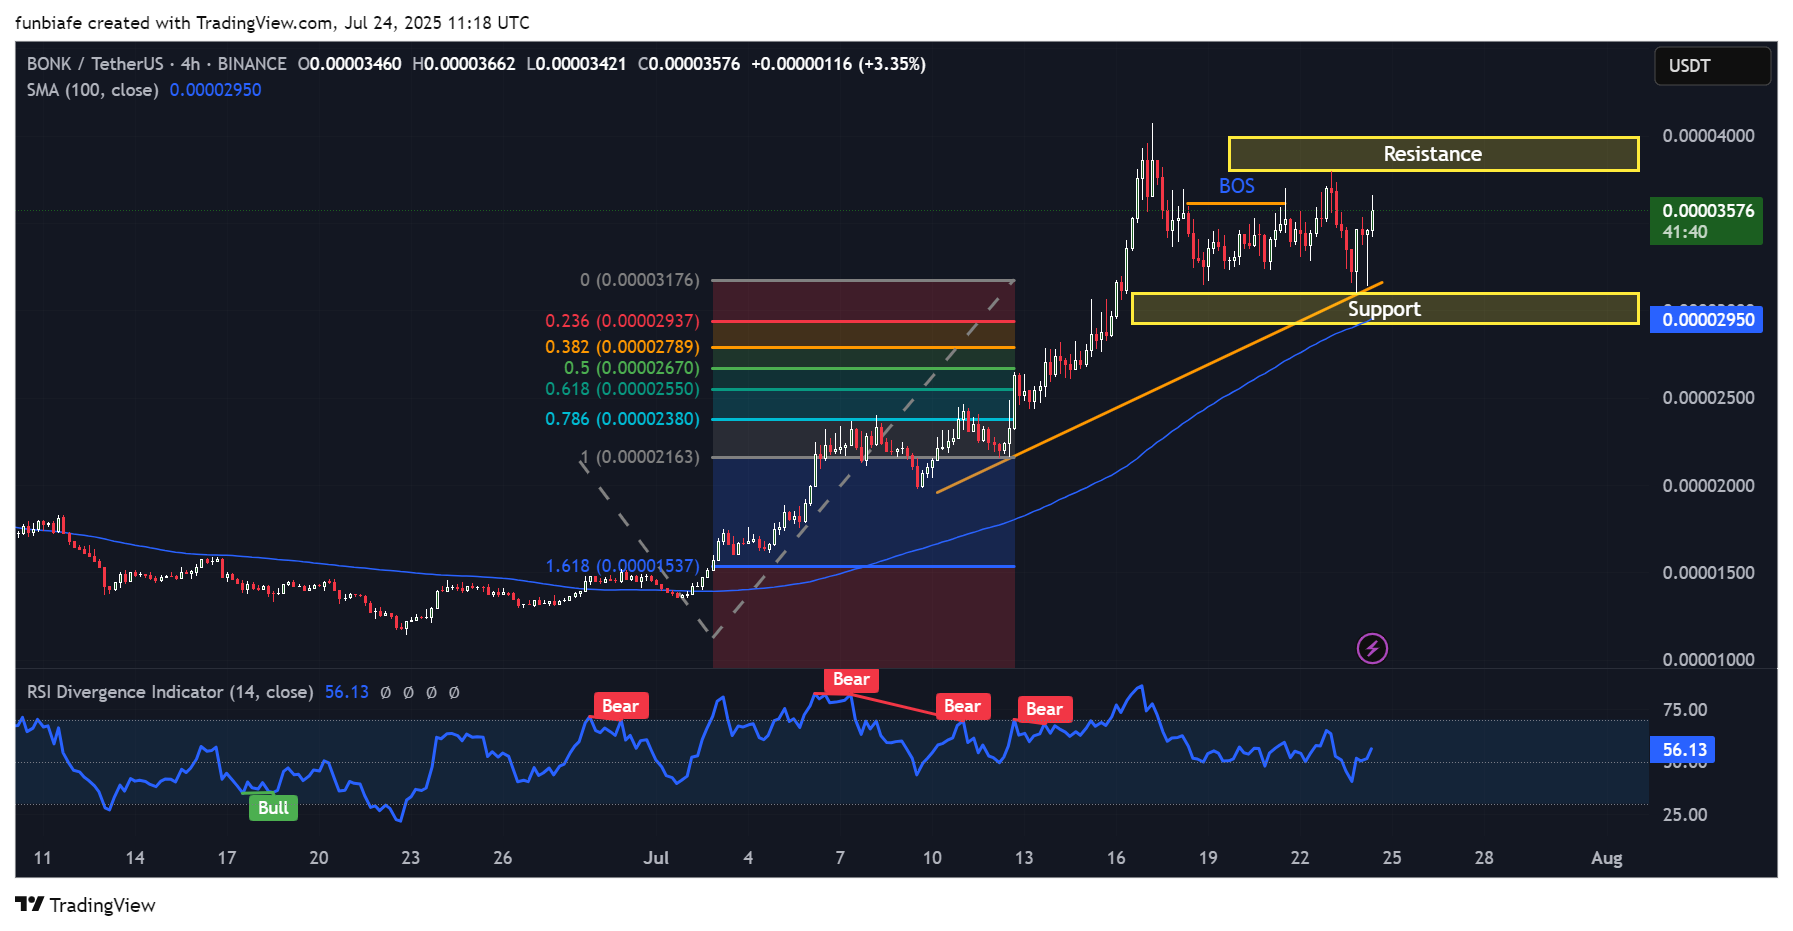
BONK 4h chart. Source: Tradingview
On the 4-hour timeframe, BONK price continues to make higher highs and higher lows. The 100-SMA is on an upward trend and is located close to $0.0000295, which is also the level of the 0.382 Fibonacci and offers layered support.
The RSI is neutral at 56, meaning there’s room for further upside. That said, if the price stalls near $0.000038 and RSI begins forming bearish divergence, a pullback could follow.
The 100-day SMA daily chart shows BONK firmly above the 100-day SMA and holding breakout levels. So long as the trend continues in motion, traders are looking to $0.000045–$0.000050 as the next levels higher.
BONK short-term outlook: Bulls face resistance at $0.000038
BONK price remains in a bullish structure, supported by market cap recovery, active user growth, and strong technical signals. The next hurdle is the resistance zone at $0.000038–$0.000040.
A clean breakout here with volume could send BONK to $0.000045 quickly. But if it stops or gets rejected, a retest of the $0.000033–$0.0000325 area is anticipated.
Below that, $0.000030 and $0.000025 are the additional support levels to keep an eye on; both previously acted as consolidation zones.
For the time being, BONK is in a breakout state, with structure, volume, and sentiment in bullish directions. But all eyes are on how price behaves at the $0.000038 resistance. A breakout means new highs, while a rejection could cool off the rally. Still, despite BONK’s current bullish price movements, its chances of ever reaching $1 are extremely low.
eToro: Best platform for beginners and social trading
- Trade cryptocurrencies, stocks, ETFs, and commodities on one easy-to-use platform
- Follow and copy top-performing traders with eToro’s unique social trading tools
- Earn passive income with staking on popular coins like ETH, ADA, and TRX
- Fully regulated in multiple jurisdictions with strong security protocols
- 0% commission on real stock trading and competitive spreads on crypto
- 30+ million registered users across 100+ countries
eToro is a multi-asset investment platform. The value of your investments may go up or down. Your capital is at risk. Don’t invest unless you’re prepared to lose all the money you invest. This is a high-risk investment and you should not expect to be protected if something goes wrong.
Source:: BONK Price Analysis: Analyst Says BONK Might Pump Soon – Here’s Why