Key highlights:
- BNB price hits a new all-time high above $1,200, but on-chain metrics indicate short-term exhaustion.
- Analysts are searching for a good retracement into $1,000-$1,100 before the possible next bullish leg.
- Rising active addresses and network fees confirm continued ecosystem growth despite overbought signals.
BNB just reached a new all-time high above $1,200, extending its powerful uptrend that started back in mid-August. But after such a steep rally, some analysts think a cooldown could be near.
Analyst Crypto Claws posted a BNB chart showing that momentum is beginning to fade as the price tests resistance, warning that “smart money” might start taking profits soon. If so, BNB price can fall back into the $700–$750 area by the end of the year.
On-chain and technical data both confirm that the trend remains bullish, though near-term indicators now show some exhaustion.
BNB on-chain data shows activity rising, but caution is setting in
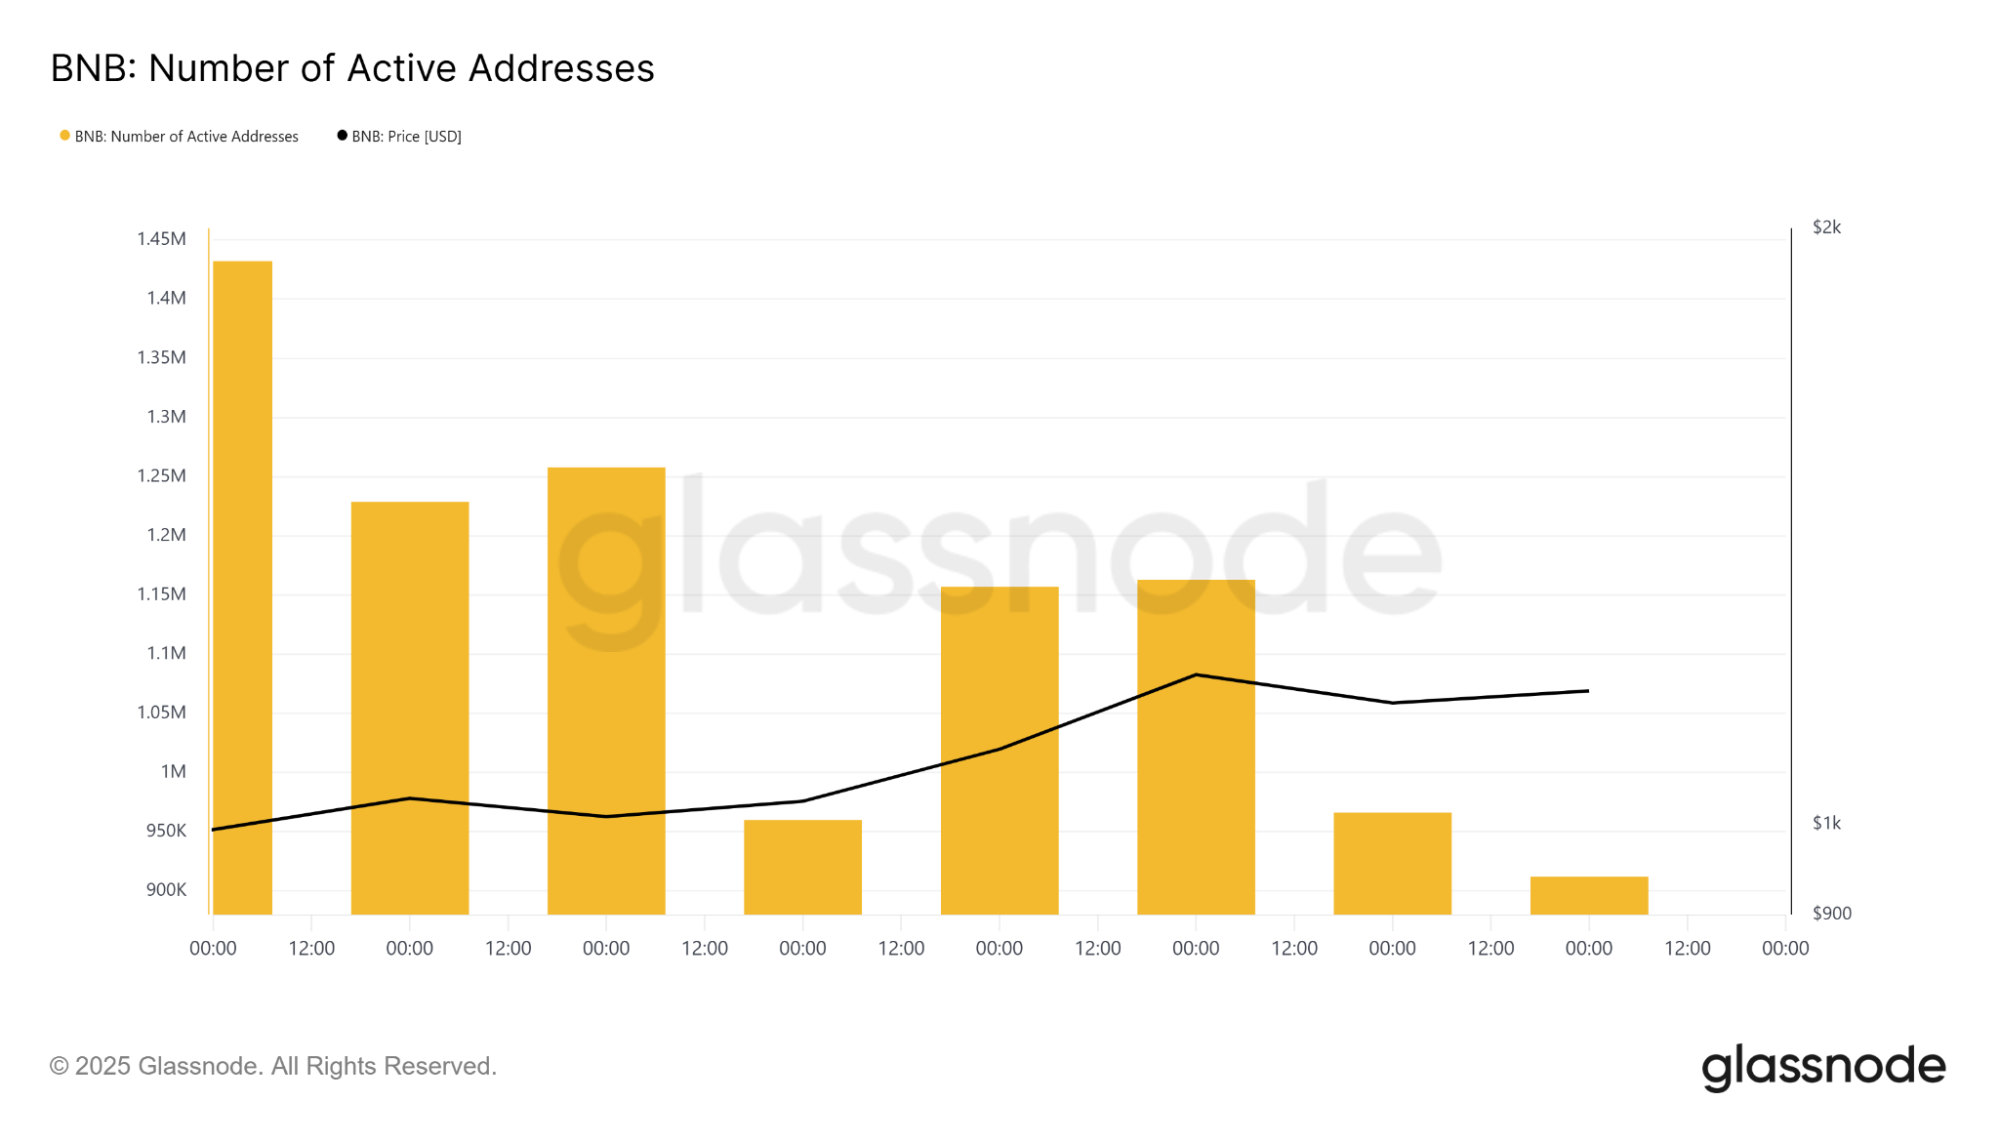
Data from Glassnode paints a mixed picture. The number of active BNB addresses has stayed between 900,000 and 1.4 million, showing that while the network remains busy, user growth isn’t accelerating in line with the price.
This indicates that BNB’s rally is being powered mostly by existing holders and capital rotation rather than an influx of new participants.
Even so, there’s a pattern worth noting. When active addresses recover after local lows, the price tends to follow. The latest small rebound in address activity points to renewed on-chain participation, something that often supports short-term price moves.
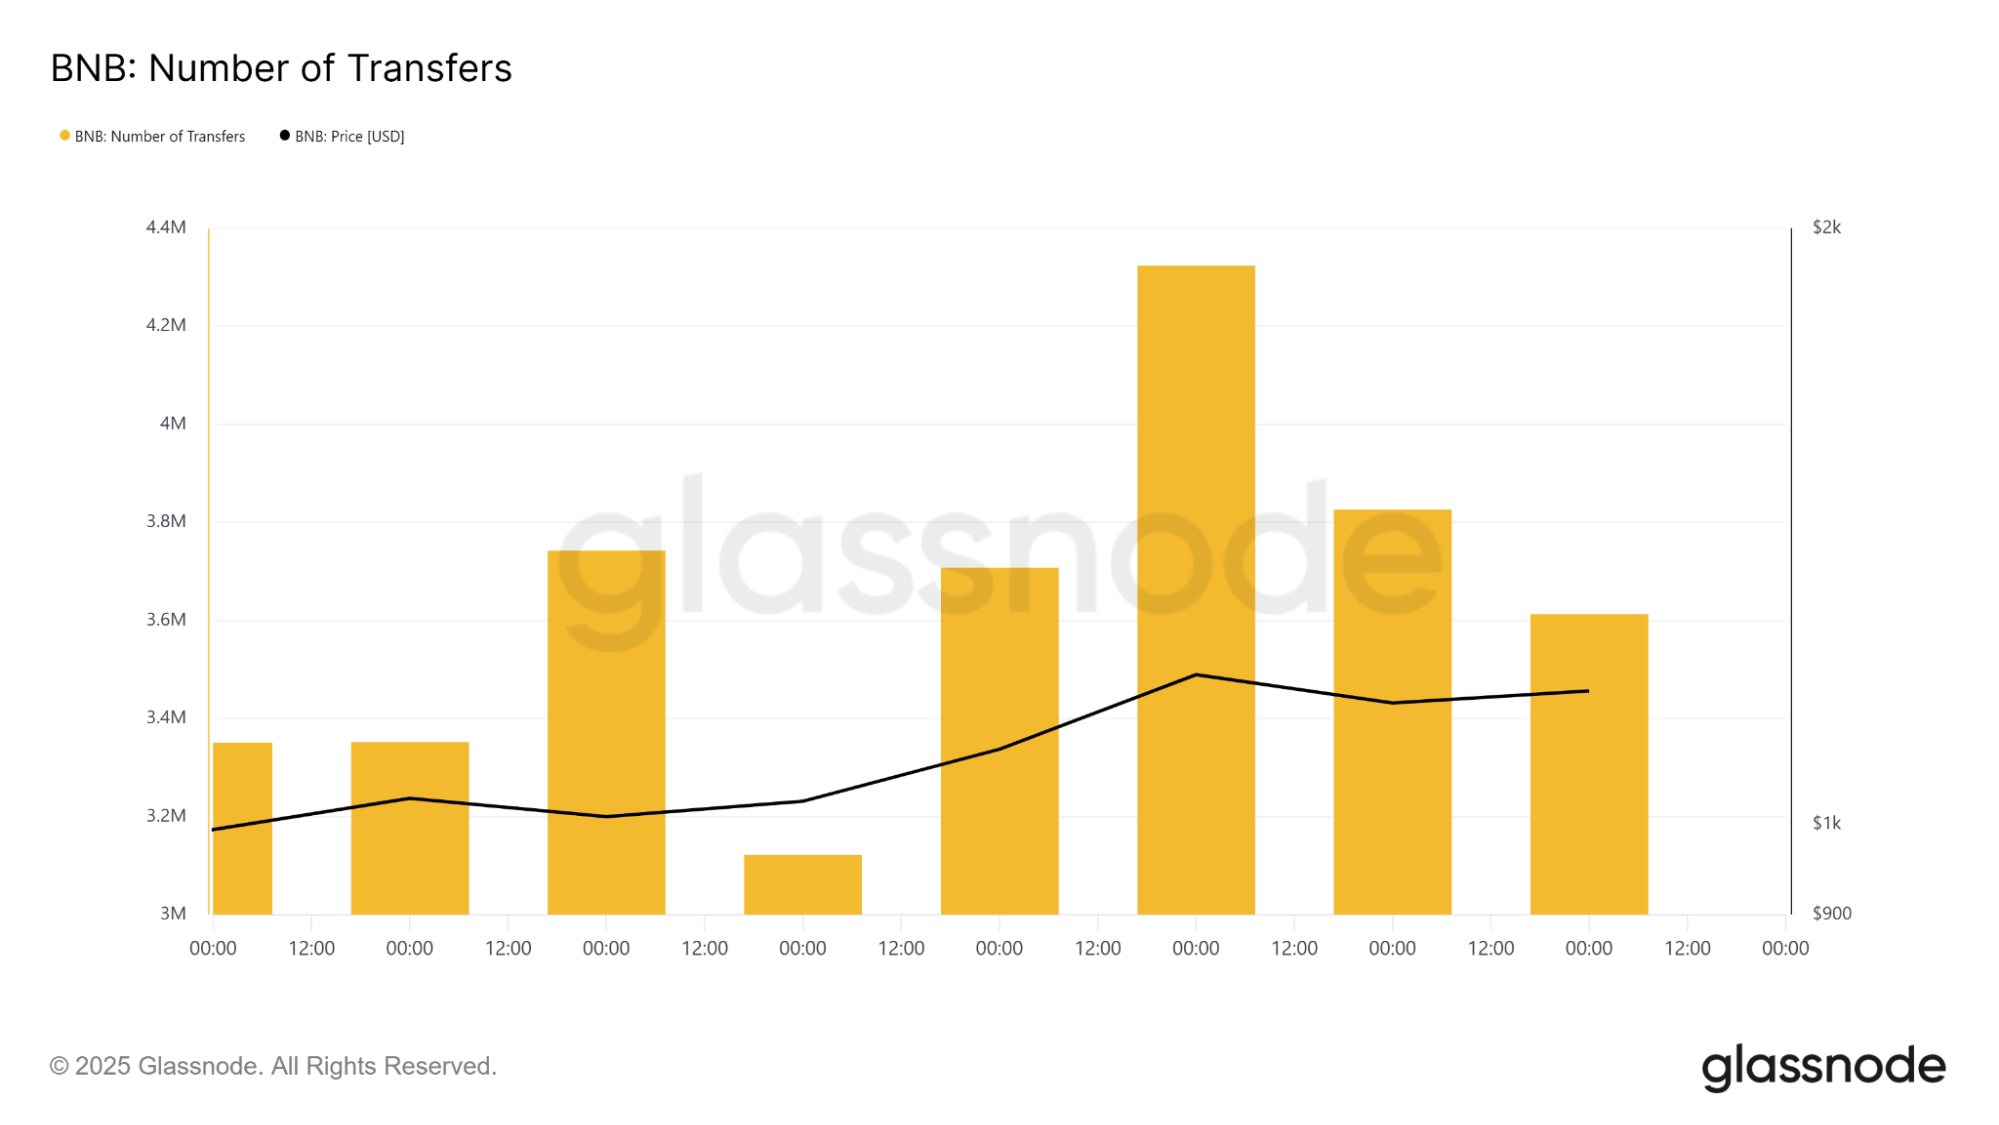
Meanwhile, the number of transfers has been holding between 3 million and 4.4 million, with activity peaking during major price swings. That kind of volume shows continued engagement from traders and stakers.
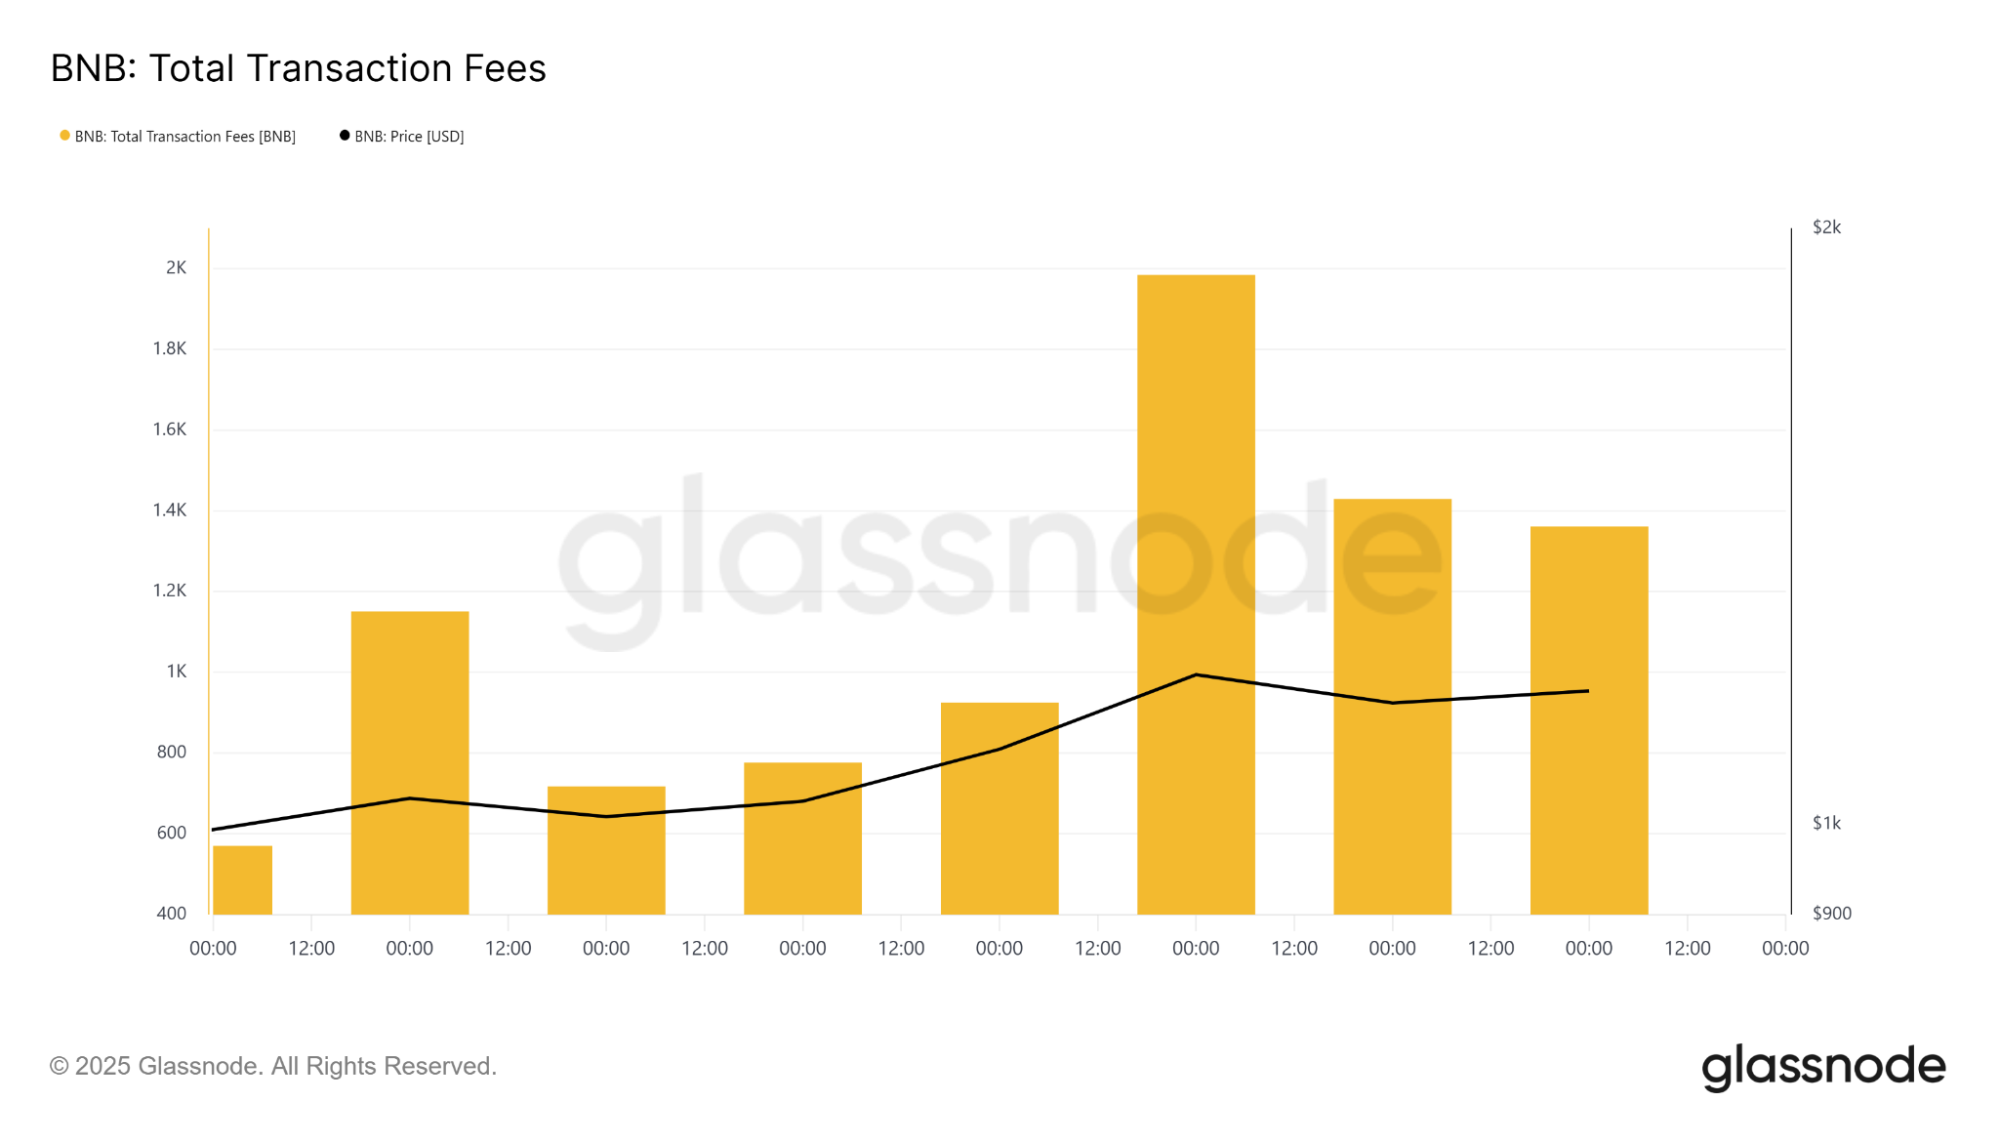
The network’s total transaction fees have also started rising again, reflecting increased activity and network demand. When fees rise alongside price, it often signals growing user interaction and healthy momentum in the market.
Technical picture: BNB tests heavy resistance around $1,200
BNB price is trading near $1,208, sitting right at a key resistance zone between $1,200 and $1,270. The daily chart shows a clear breakout from the $1,000 consolidation zone, with strong volume confirming the move.
The Fibonacci retracement setup gives a good overview of key levels. The 0.236 retracement zone at $1,158 has flipped into support, while the 0.382-0.5 area ($1,122–$1,087) would act as the next pullback target if price corrects.
Resistance sits between $1,270 and $1,300, which lines up with extension levels where traders may look to take profits.
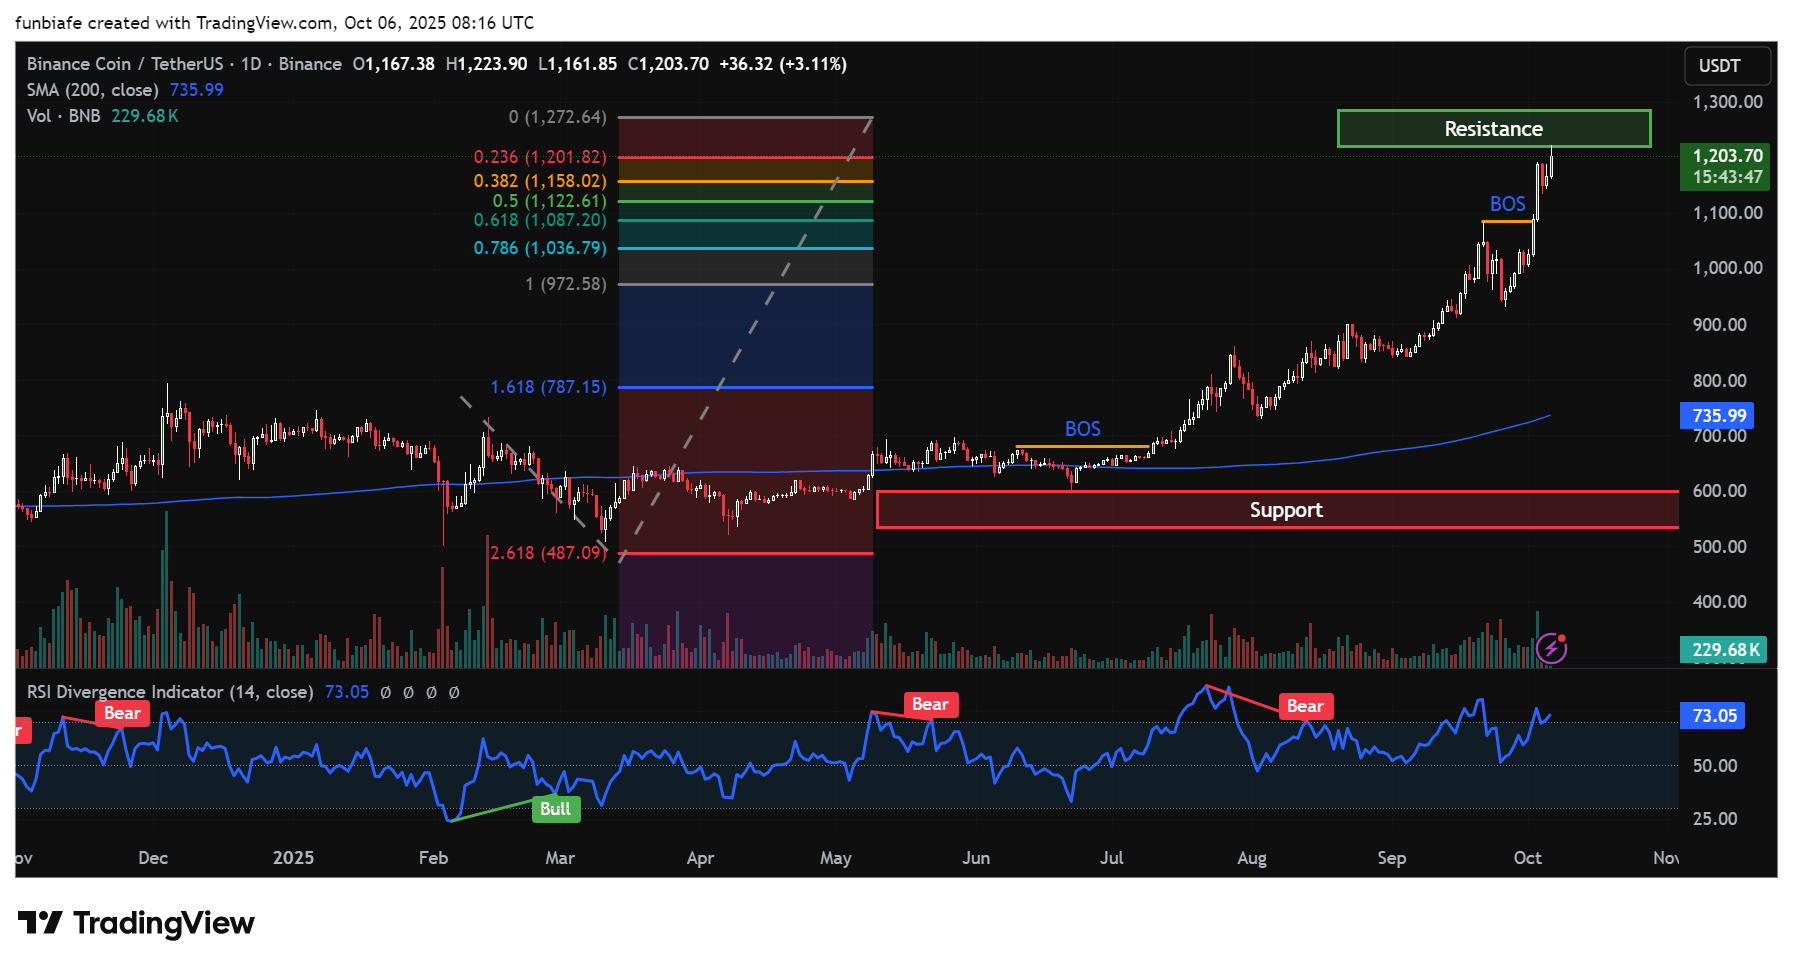
BNB daily chart. Source: Tradingview
BNB’s RSI reading of 73 signals strong momentum but also indicates the market could be overheated in the short term. A temporary dip to $1,120-$1,150 may reset the trend before the next move upwards. If bulls continue to dominate, the next resistance zone lies between $1,350 and $1,400, where price discovery may ensue.
On the 4-hour chart, the setup mirrors the higher timeframe. BNB continues to respect the 100-period SMA near $1,037, which has acted as a reliable support line throughout the rally.
The BNB price action displays several break-of-structure (BOS) incidents, affirming that buyers remain dominant.
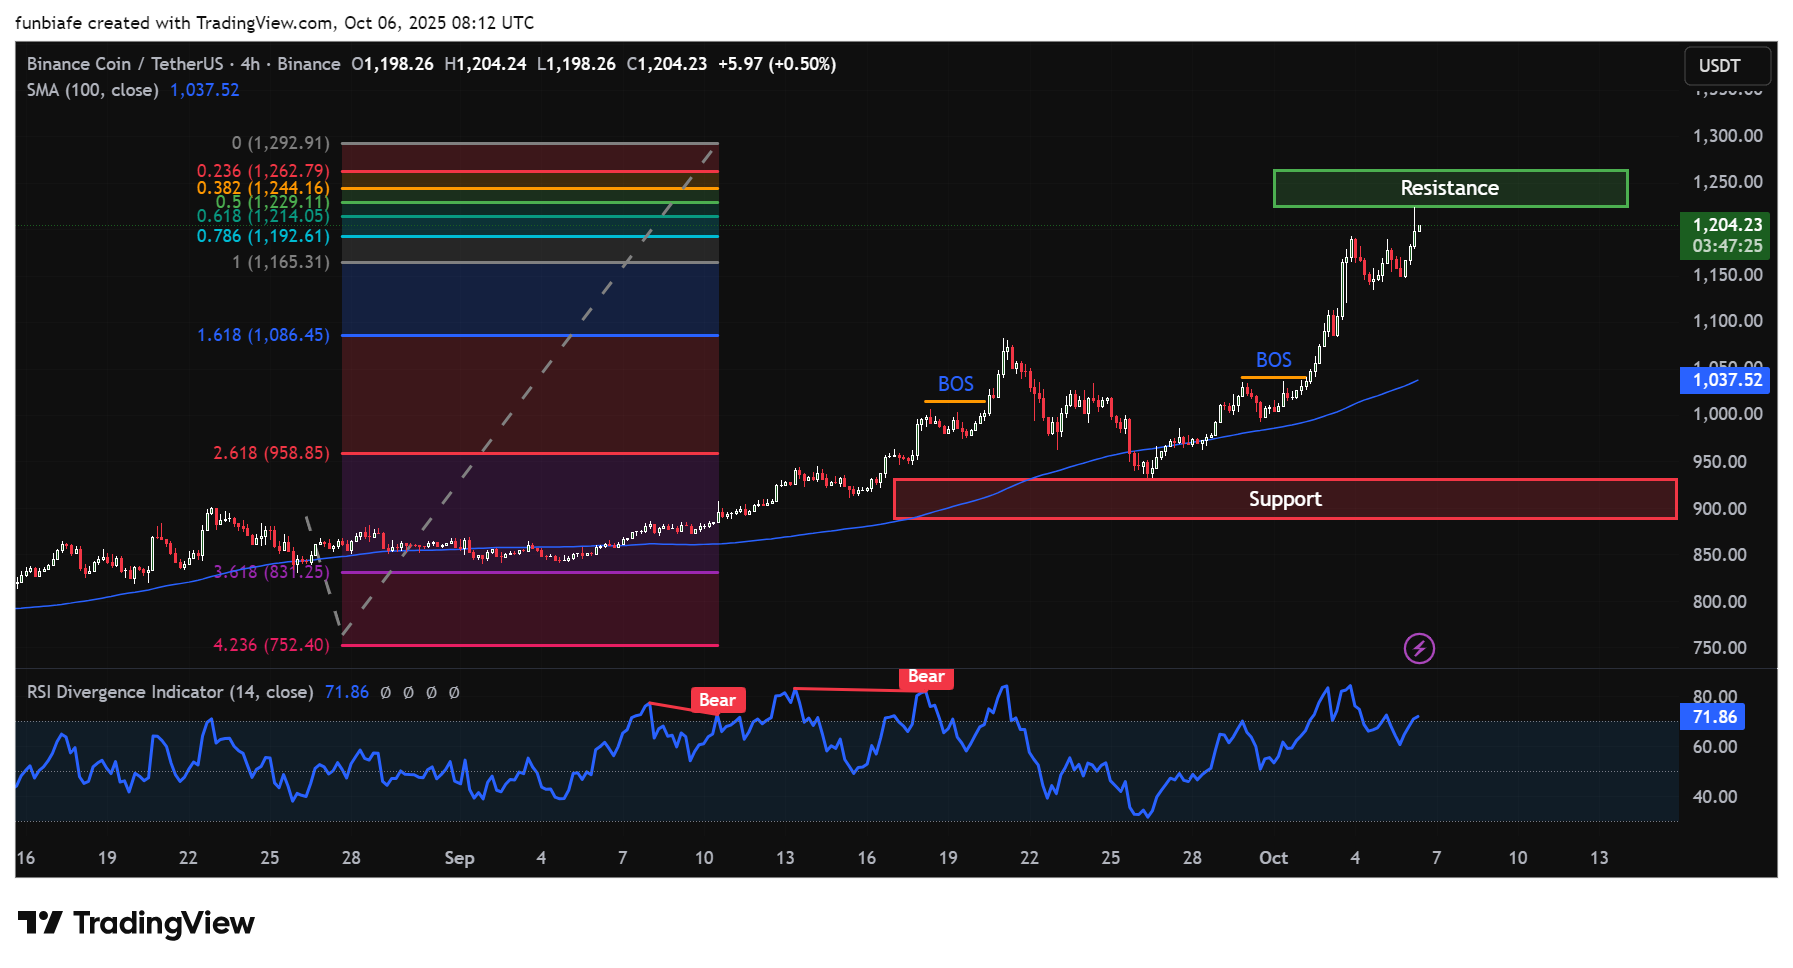
BNB 4hr chart. Source: Tradingview
Short-term resistance is $1,250-$1,270, where sellers might come in for a little while. If the price remains above $1,165-$1,190, the rally is good enough to break through to $1,300. Below $1,100, however, would show that momentum is fading, and the path would be clear to a retest of $950-$1,000.
The RSI on this chart is 72, once more in sync with the daily chart, momentum is still high but stretched. This often leads to brief consolidations or sideway ranges before the next leg up.
Analyst outlook: BNB’s parabolic rally may be due for a pause
According to Crypto Claws, BNB’s move from mid-August to October looks “parabolic,” and that kind of vertical rise often ends with a temporary slowdown.
The analyst notes that BNB price action near $1,200 shows smaller candles and longer wicks, a classic sign of exhaustion.
• $BNB just hit a new all-time high, signaling potential exhaustion after a strong parabolic rally.
• Price action shows signs of weakness near resistance, indicating that smart money might start taking profits.
• If momentum fades, a correction toward the $700 zone by… pic.twitter.com/DgIRa72A2y
— Crypto Claws (@cryptoclaws_) October 5, 2025
If momentum fades, the first potential retracement zone sits near $1,060, followed by $900, and then $720-$740, the same base where BNB last consolidated. This region, the analyst adds, could attract long-term buyers if the pullback extends into the end of the year.
Still, the bigger trend remains bullish. If BNB can close a daily candle above $1,200 and hold it on retest, that would confirm the breakout and signal further upside. In that case, the market could range between $1,150 and $1,300 before trying for higher targets.
What’s next for BNB
BNB’s structure across all timeframes remains bullish. On-chain metrics show rising network activity and growing fees, both pointing to an active ecosystem. The technical charts support that narrative but indicate a short breather might be on the horizon.
Resistance remains at $1,250-$1,300, and support is $1,120, $1,000, and $950, with an extension target of approximately $1,400. Daily and 4-hour RSI show strong but overbought momentum and indicate a tame pullback or sideways range is more probable before the next rise.
If a correction happens, it would be more likely a healthy rebalancing in the bigger uptrend and not a reversal. Long-term setup continues to be bullish as long as the BNB price is above the $1,000 mark and network usage continues to grow. CoinCodex’s BNB price prediction shows that the coin could grow by nearly 20% to reach $1,400 by the end of 2025
As of now, BNB is hovering around $1,209, resting near its new all-time high and reigning supreme in the large-cap altcoin universe. Whether it comes down or keeps going up, technicals and on-chain indicators agree on one thing: BNB remains among the strongest in the current cycle.
Kraken: Best crypto exchange for security & reliability
- Buy, sell, and trade 400+ cryptocurrencies with industry-leading security
- Spot, Futures & Margin trading – leverage up to 5x for advanced traders
- Earn rewards with staking on top cryptocurrencies
- 24/7 customer support and high liquidity for fast trades
- Regulated in the US with strong compliance and security measures
- 13+ million users worldwide
Source:: BNB Price Analysis: New All-Time High Reached as Analysts Warn of Pullback