Key highlights:
- Bitcoin flashes a rare indicator that previously triggered parabolic rallies
- Volatility hits historic lows, hinting at a major move ahead
- Analysts compare Bitcoin’s setup to Google before a massive surge
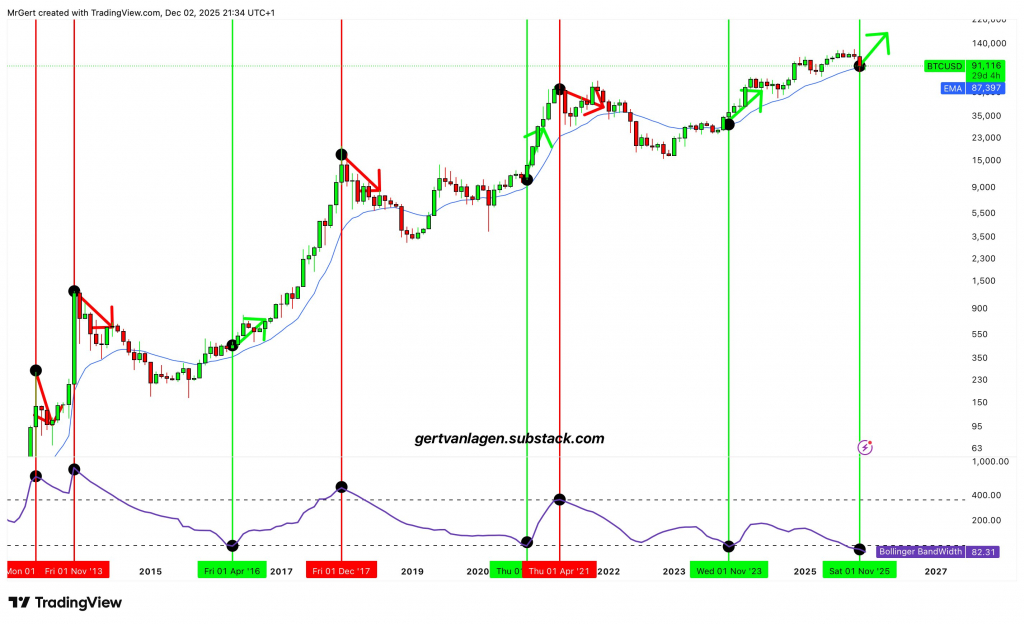
Bitcoin has triggered one of its rarest technical signals, as the Bollinger BandWidth indicator on the monthly chart has fallen to its lowest level on record. Historically, this setup has preceded sharp and sudden rallies, and analysts suggest the pattern could be repeating.
BTC/USD 1-Month Chart. Source: Gert van Lagen via X
The Bollinger BandWidth measures the percentage difference between the upper and lower Bollinger Bands, offering a window into upcoming volatility. According to macro strategist Gert van Lagen, the current BandWidth reading on the monthly timeframe has never been lower.
History supports the significance of this moment. BandWidth almost never drops below 100 on this scale but when it does, Bitcoin tends to respond with a steep upward move. “Historically, every time this triggers, Bitcoin follows with a direct parabolic leg up,” van Lagen noted.
The last time this “green” signal appeared was in early November 2023, when BTC/USD nearly doubled within four months. Previous occurrences show the same pattern: a period of extreme consolidation followed by explosive expansion.
Notably, recent reporting confirms that the monthly BandWidth has now reached all-time lows, and many analysts are interpreting this squeeze as a clear setup for a “parabolic leg up.”
A pattern similar to Google before its pre-crisis surge
Van Lagen also compared Bitcoin’s current technical configuration to Google (GOOG) before its major rally ahead of the 2008 financial crisis. He highlighted a series of lower highs on the BandWidth that eventually broke, fueling volatility and a strong move upward before a broader downturn.
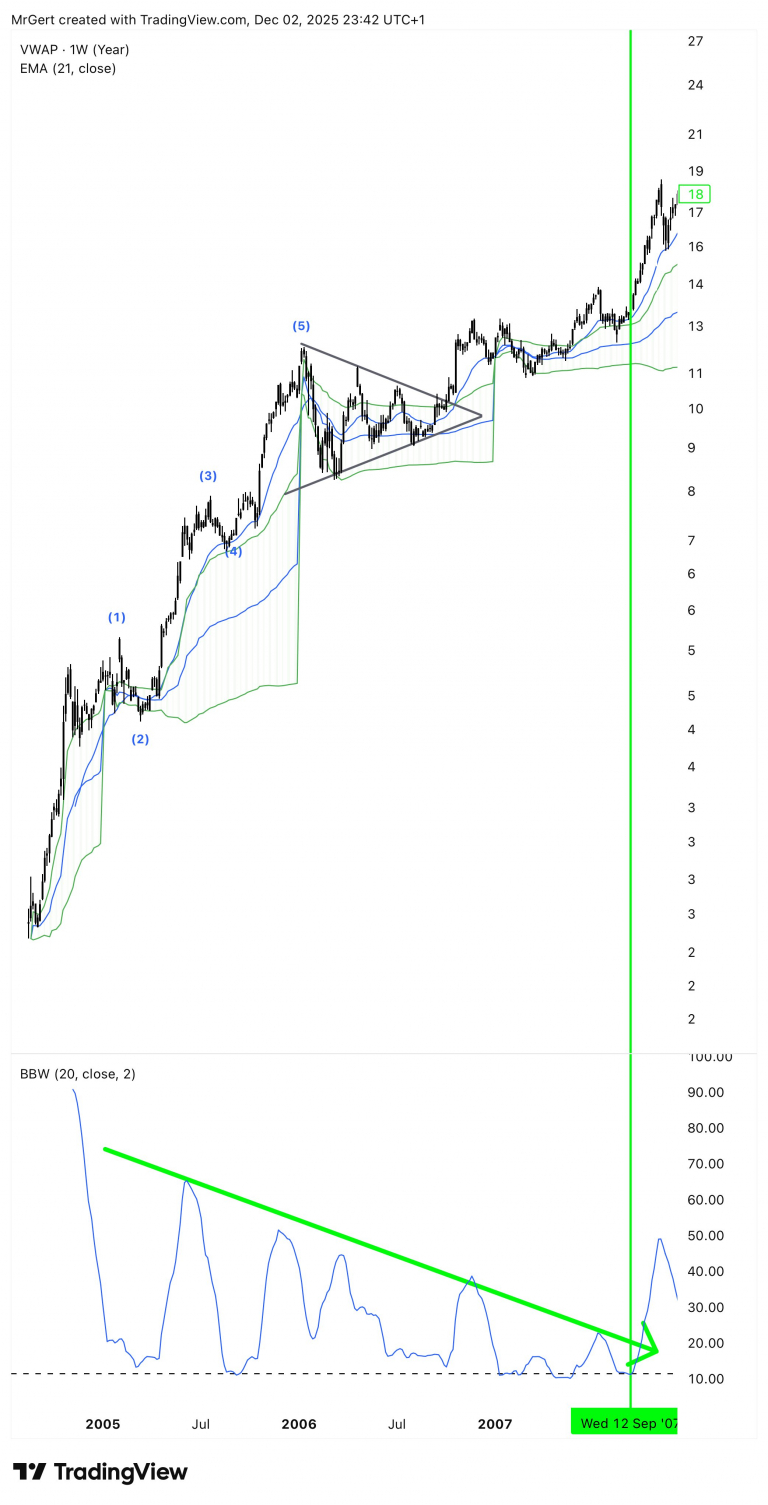
GOOGL/USD 1-Week Chart. Source: Gert van Lagen via X
This parallel suggests that Bitcoin could still be forming a final rally to a new high before the next bear market begins.
Traders stay cautious despite bullish technical setup
Even as technical signals turn bullish, traders remain restrained. On December 3, BTC/USD reached its highest level in more than two weeks, nearing $94,000 amid rumors that a cryptocurrency supporter could be appointed to lead the U.S. Federal Reserve.
“Price did now make a higher high and higher low, so technically the market structure is back to bullish on this timeframe,” said trader Daan Crypto Trades. “But to properly get this going I want to see it sustain above this current price area.”
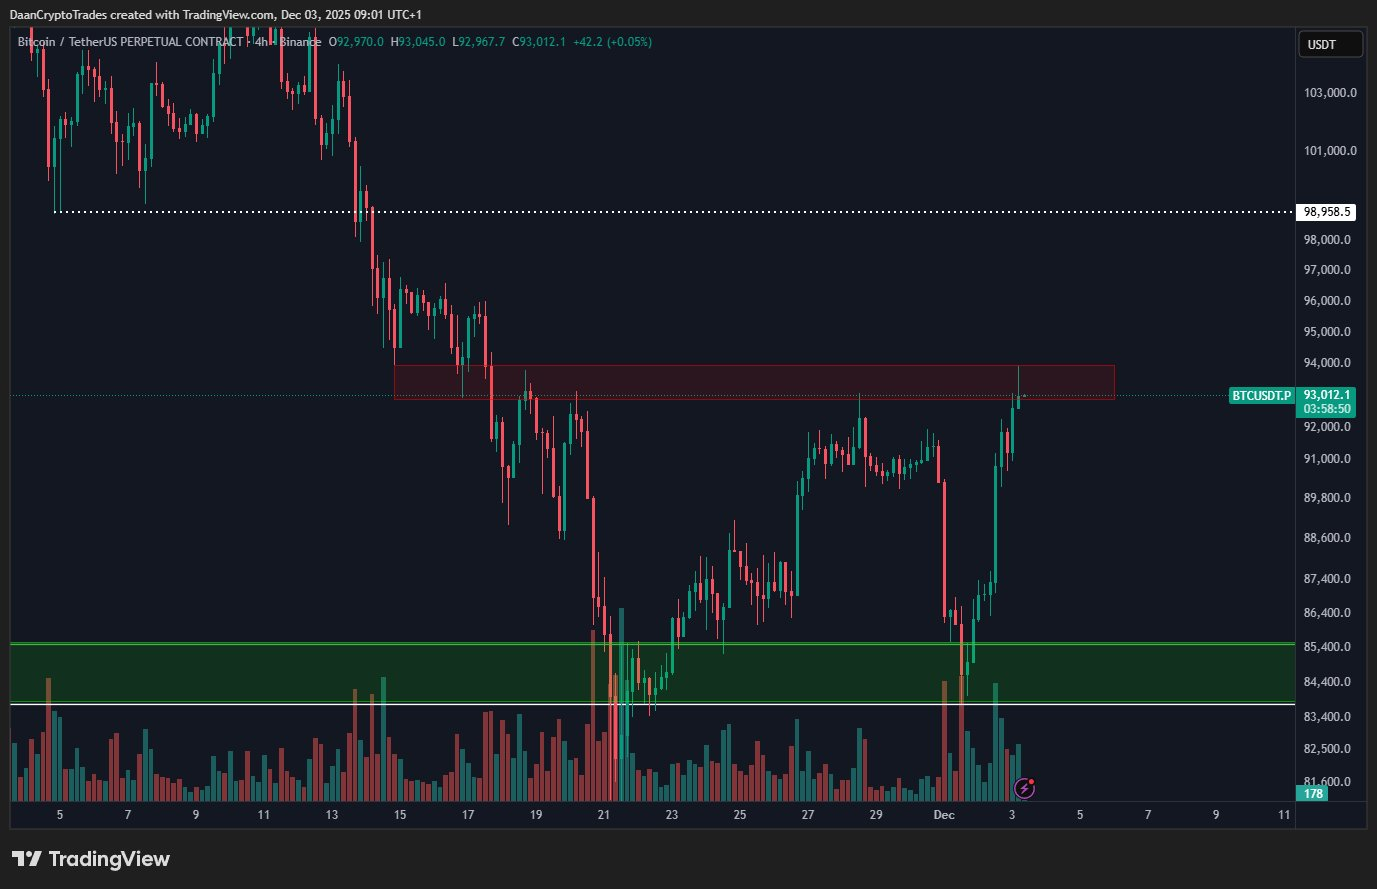
BTC/USD 4-hour chart. Source: Daan Crypto via X
Analyst Rekt Capital added that Bitcoin has an entire month to post a modest 2% gain in order to finish the year above the key four-year cycle level of $93,500, an outcome that would close the year with a green candle and add confidence to bullish projections.
Kraken: Best crypto exchange for security & reliability
- Buy, sell, and trade 400+ cryptocurrencies with industry-leading security
- Spot, Futures & Margin trading – leverage up to 5x for advanced traders
- Earn rewards with staking on top cryptocurrencies
- 24/7 customer support and high liquidity for fast trades
- Regulated in the US with strong compliance and security measures
- 13+ million users worldwide
Disclaimer: This content is for informational purposes only and does not constitute financial, investment, or other advice. Nothing on this page is a recommendation or solicitation. Always seek independent professional advice before making investment decisions. Some links may earn us a commission at no extra cost to you.