Key highlights:
- Bitcoin rose 21% from $80,500 to $97,900 since November, but technical signs suggest a potential bear market continuation.
- Large inflows of 39,000 BTC to exchanges indicate increasing selling pressure from investors.
- The 365-day moving average at $101,000 is critical; failure to consolidate above it may extend bearish trends into 2026.
Bitcoin’s price performance since late 2025 shows a familiar pattern from the previous downturn, but recent strengths suggest a complex market picture for 2026.
Bitcoin has climbed about 21% since November, rising from near $80,500 to peaks around $97,900, but analysts caution this move may represent a “bear market rally” rather than a sustainable recovery.
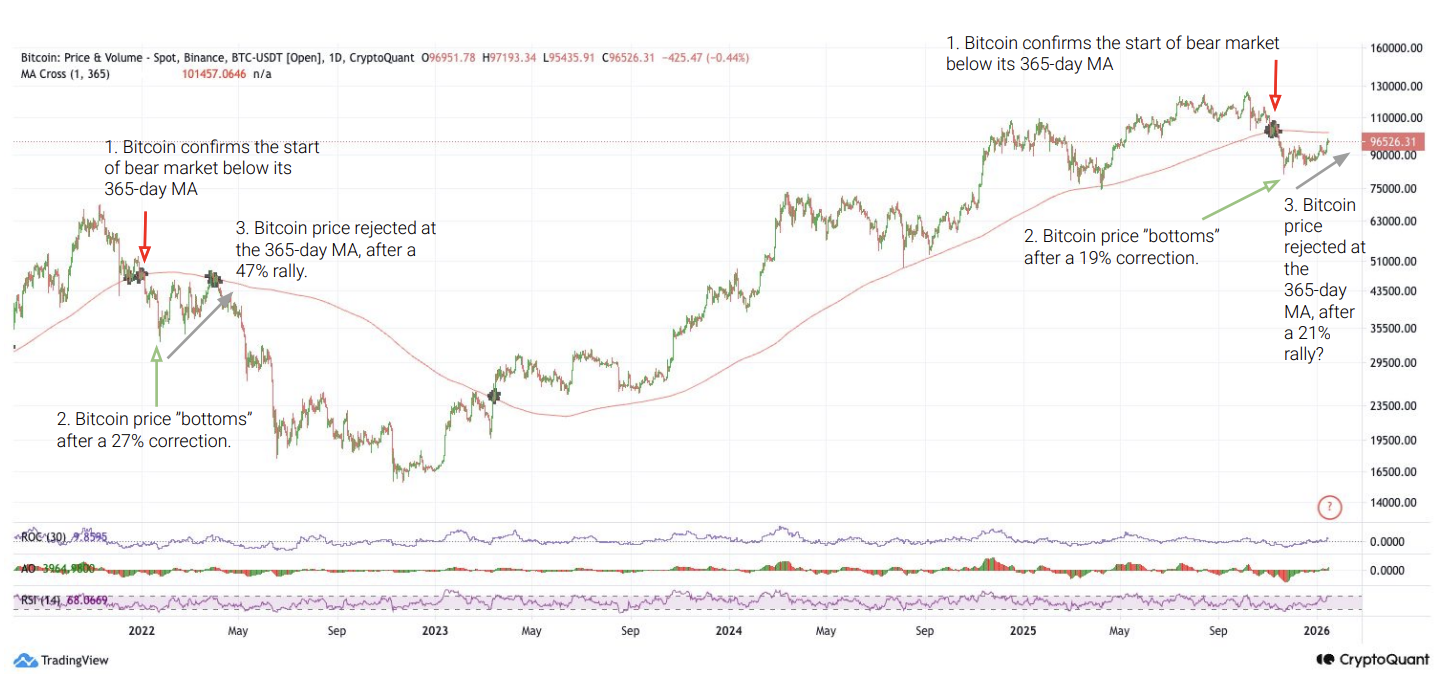
According to on‑chain analytics firm CryptoQuant, if Bitcoin fails to consolidate above its 365‑day moving average, currently near $101,000, it risks extending a bear market into 2026.
Bear market rally or start of a sustainable trend
CryptoQuant data shows that Bitcoin’s rebound from November is similar to the pattern observed in the 2022 bear market. Back then, after dropping below the 365‑day moving average, Bitcoin declined about 19% before rallying roughly 19% toward the same long‑term trendline – only to stall.
BTC/USD 1-day chart and 365-day moving average. Source: CryptoQuant
The current market has shown a comparable trajectory, with Bitcoin’s 21% rise failing to break decisively above the critical 365‑day average.
Analysts emphasize that while the rebound demonstrates resilience, key technical and fundamental indicators still suggest the broader downtrend remains intact.
Recent reports from CryptoQuant and other market observers show weak underlying demand, contracting spot demand over the past 30 days, and exchange inflows increasing, a traditional sign of rising selling pressure as investors move Bitcoin into exchange wallets.
In particular, the seven‑day average of Bitcoin inflows to exchanges hit approximately 39,000 BTC, its highest level since late November 2025, which may signal that holders are preparing to sell rather than accumulate.
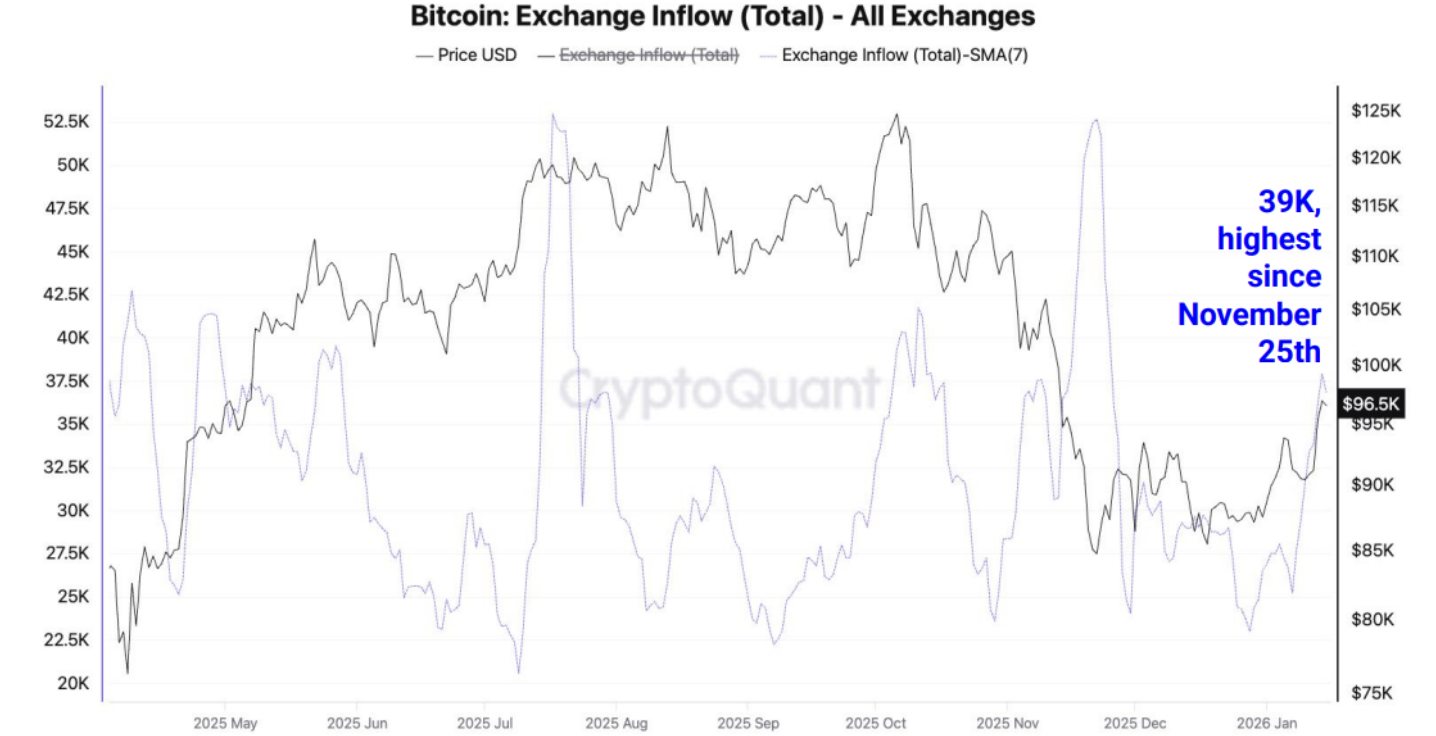
Increased Bitcoin inflows to exchanges. Source: CryptoQuant
Historical parallels and broader market context
Comparisons to 2022 have gained traction as many traders remember that year’s price action: a rally that eventually failed to transition into a fresh bull cycle. Some forecasts even suggest Bitcoin could fall further in 2026 if broader weakness prevails.
Market sentiment is also influenced by macroeconomic signals and structural indicators. While 2026 has seen improved demand conditions at times, overall market strength remains muted. CryptoQuant’s Bull‑Bear Cycle indicator has stayed at low levels similar to deep correction phases, and a lack of sustained ETF inflows adds to the concern.
From a macro perspective, broader crypto sentiment has oscillated between optimism, driven by rallies near resistance levels and speculative interest, and caution due to weakening on‑chain demand. Some analysts still argue the consolidation phase could lead to renewed accumulation if structural demand improves.
Source:: Bitcoin Could Repeat the 2022 Bear Market Scenario Despite 21% Rally