Key highlights:
- The ASTER price is pushing into a major flip zone, and this is the level that could change the whole structure if it holds.
- Both the daily and 4-hour charts show ASTER tightening up, with resistance overhead but strong support still holding underneath.
- With market cap starting to recover and the token still deep off its highs, ASTER may finally be entering an early rebound phase.
ASTER has been going through a pretty classic post-launch cycle. After that first explosive run higher, the kind that pushed the Aster price above $2 almost instantly, the token spent the next few months doing what most new altcoins do once the hype fades: it sold off hard, cooled down, and started searching for a real base.
For a long stretch, the ASTER price wasn’t doing much besides drifting lower and shaking out traders who bought too late. But over the last couple of weeks, the chart has started to feel different.
The ASTER downtrend is still there – but it’s losing control
On the daily chart shared by Crypto Knight, the story is clear. ASTER launched with a vertical spike, topped out near the $2.00–$2.20 area, and then sellers took over completely. The ASTER price rolled into a long downtrend through Q4, printing lower highs and slowly bleeding out.
Eventually, that downtrend began to slow down. Price stopped making aggressive new lows and started trading sideways around the $0.60 region. That blue accumulation zone on the chart is basically where the ASTER price finally found a floor.
$ASTER IF IT FLIPS THIS ZONE GOOD RR FORMING HERE pic.twitter.com/DXu3NWmFlI
— KNIGHT (@cryptoknight890) February 10, 2026
That’s usually how bigger reversals begin. Not with a breakout first, but with price simply refusing to fall further. KNIGHT’s tweet is focused on one key area: the zone ASTER is now trying to reclaim.
Right now, the ASTER price is sitting around $0.65, pushing into the same region that used to act as support before the last breakdown. This is the kind of level traders call a flip zone. If price can reclaim it and hold, the entire tone changes.
Instead of every bounce getting sold, dips start getting bought. That’s where the “good RR” comes in: downside is defined, but upside can open up quickly.
The projection on the chart shows that clearly. If this level holds, the ASTER price could start working its way toward $1.20 first, and potentially even higher if momentum really kicks in.
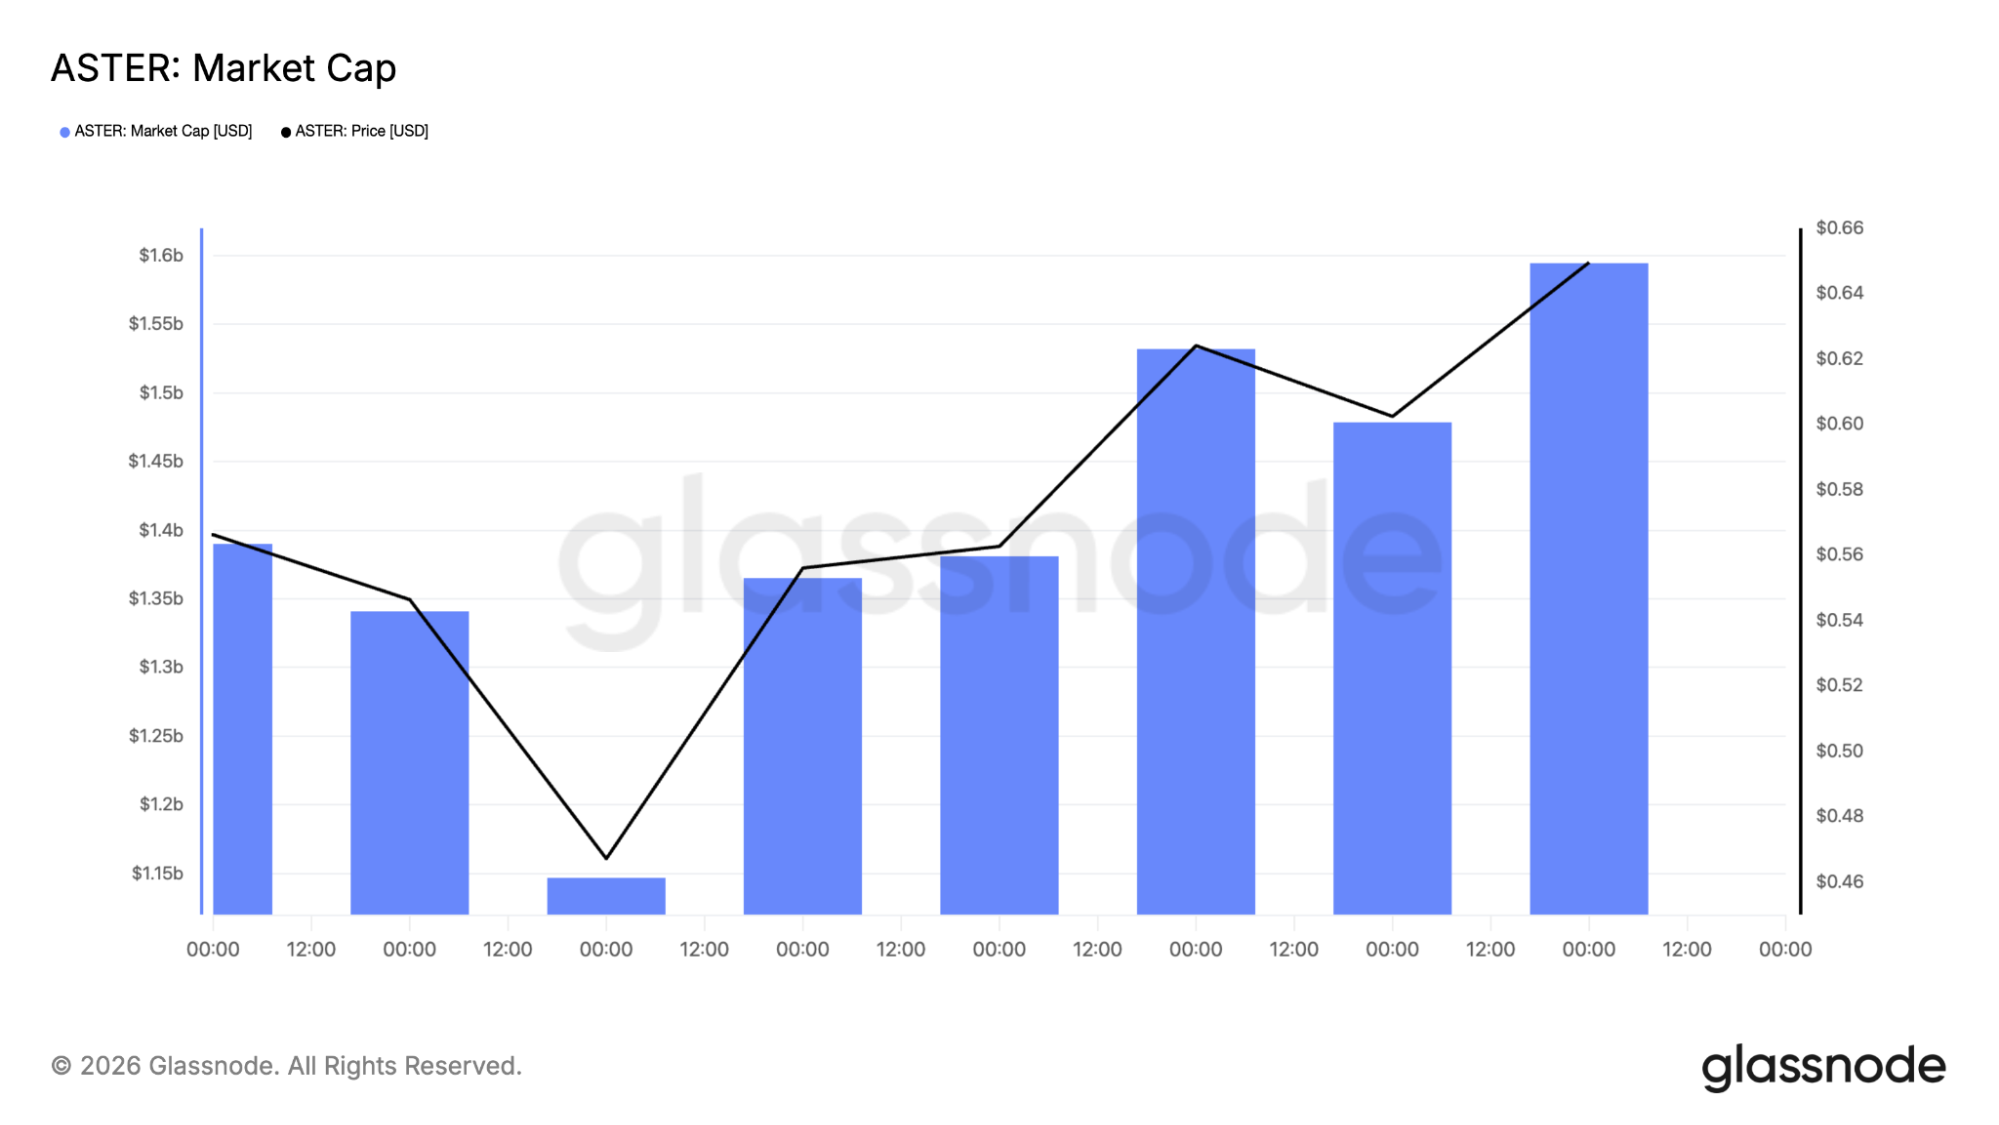
Market cap is starting to recover too – Aster is still deep off the high
The Glassnode market cap chart adds another interesting piece. After a sharp dip during the selloff, ASTER’s market cap has started climbing again.
ASTER isn’t back in full bull mode yet, but capital returning is always something worth watching. Market cap recovery usually happens before price starts trending strongly, not after. It’s not confirmation on its own, but it supports the idea that the worst phase may be fading.
The second chart shows ASTER’s drawdown from its all-time high still sitting around -73% to -80%. That sounds brutal, but that’s also where recovery trades often start forming.
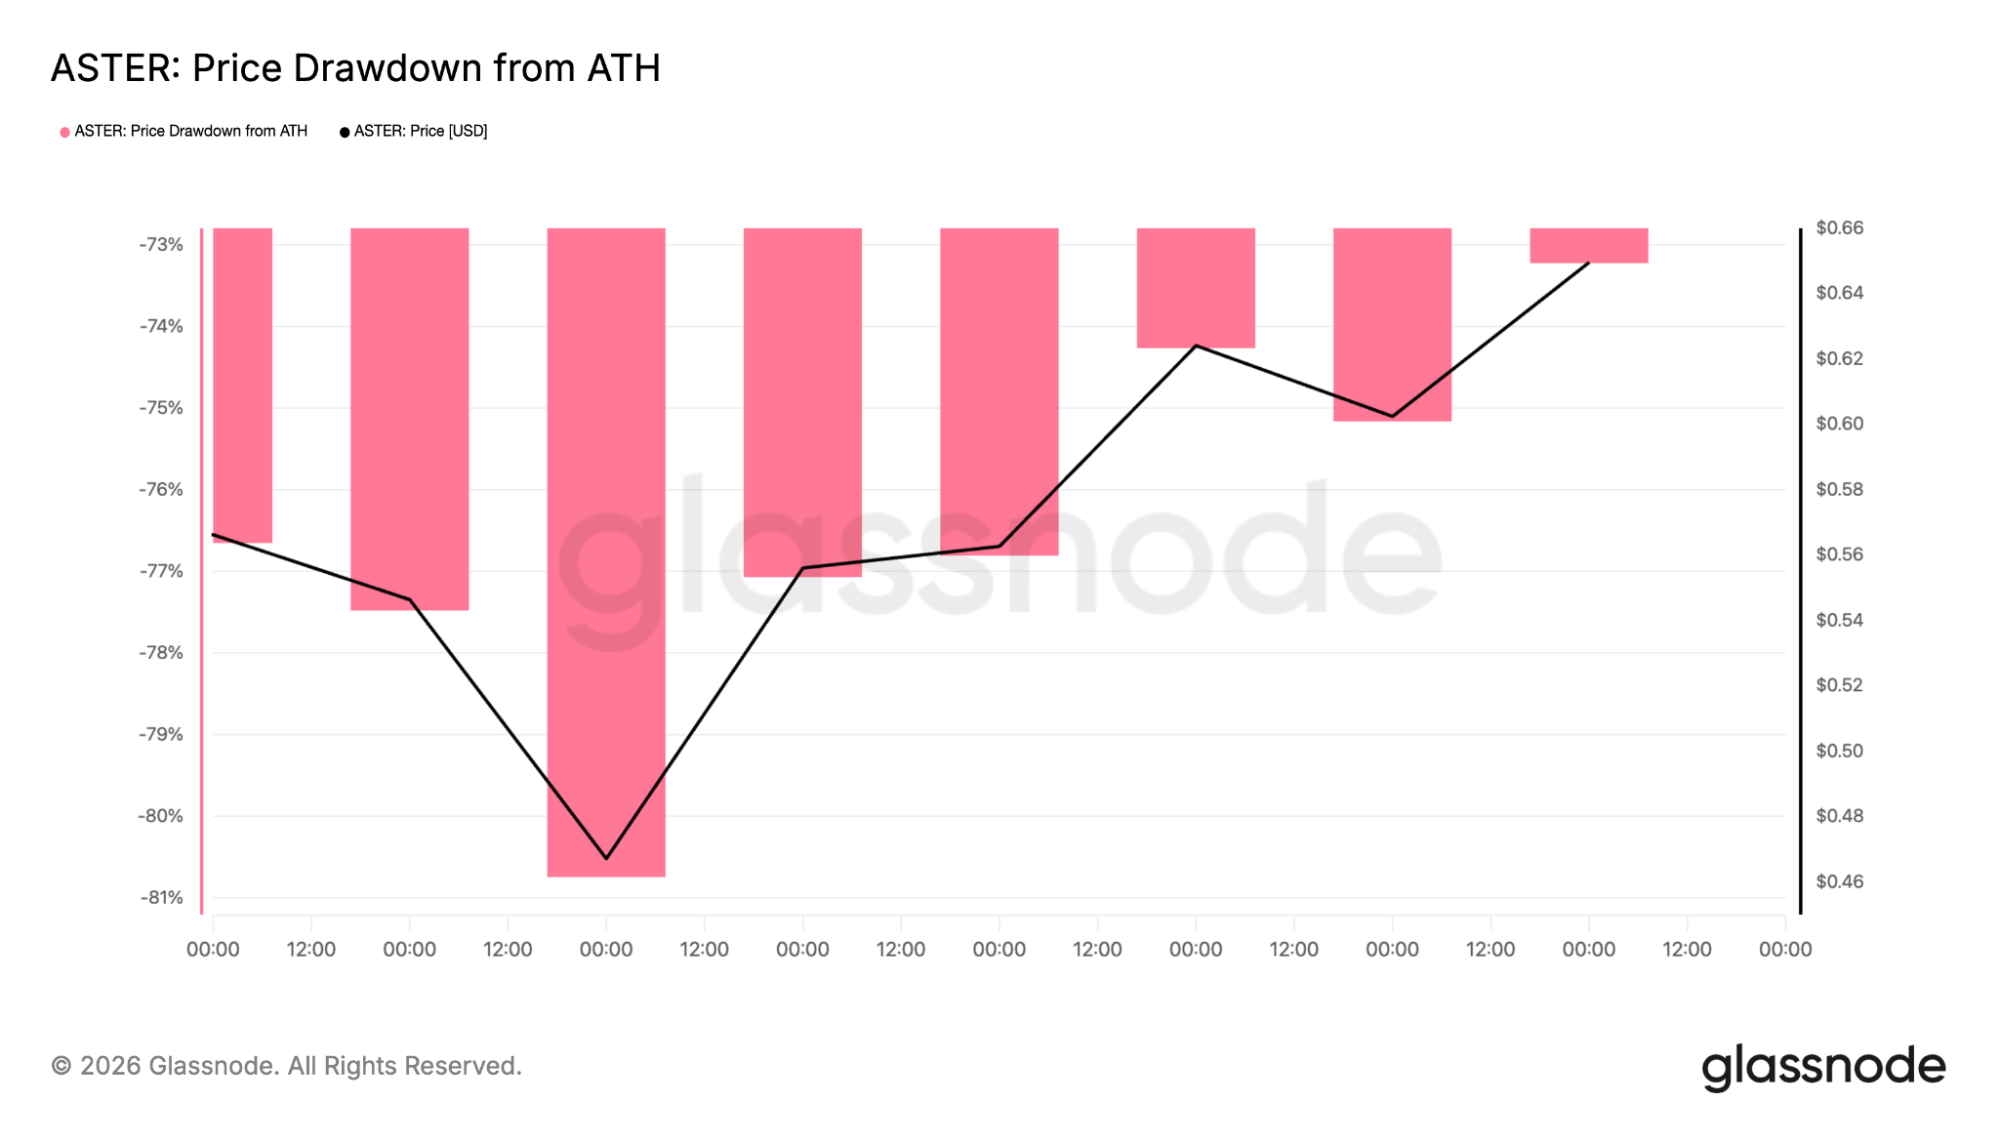
The ASTER price has already been crushed. The easy downside has happened. Now it’s about whether price can build a new trend from the lows. The drawdown tightening slightly as price pushes higher is one of the first signs that sellers may be running out of steam.
Resistance is still the main battle for Aster
If you zoom into the 4-hour chart, it becomes pretty obvious what the ASTER price is dealing with right now. The first real wall is sitting around $0.70–$0.75, which is where sellers stepped in last time and pushed the price back down.
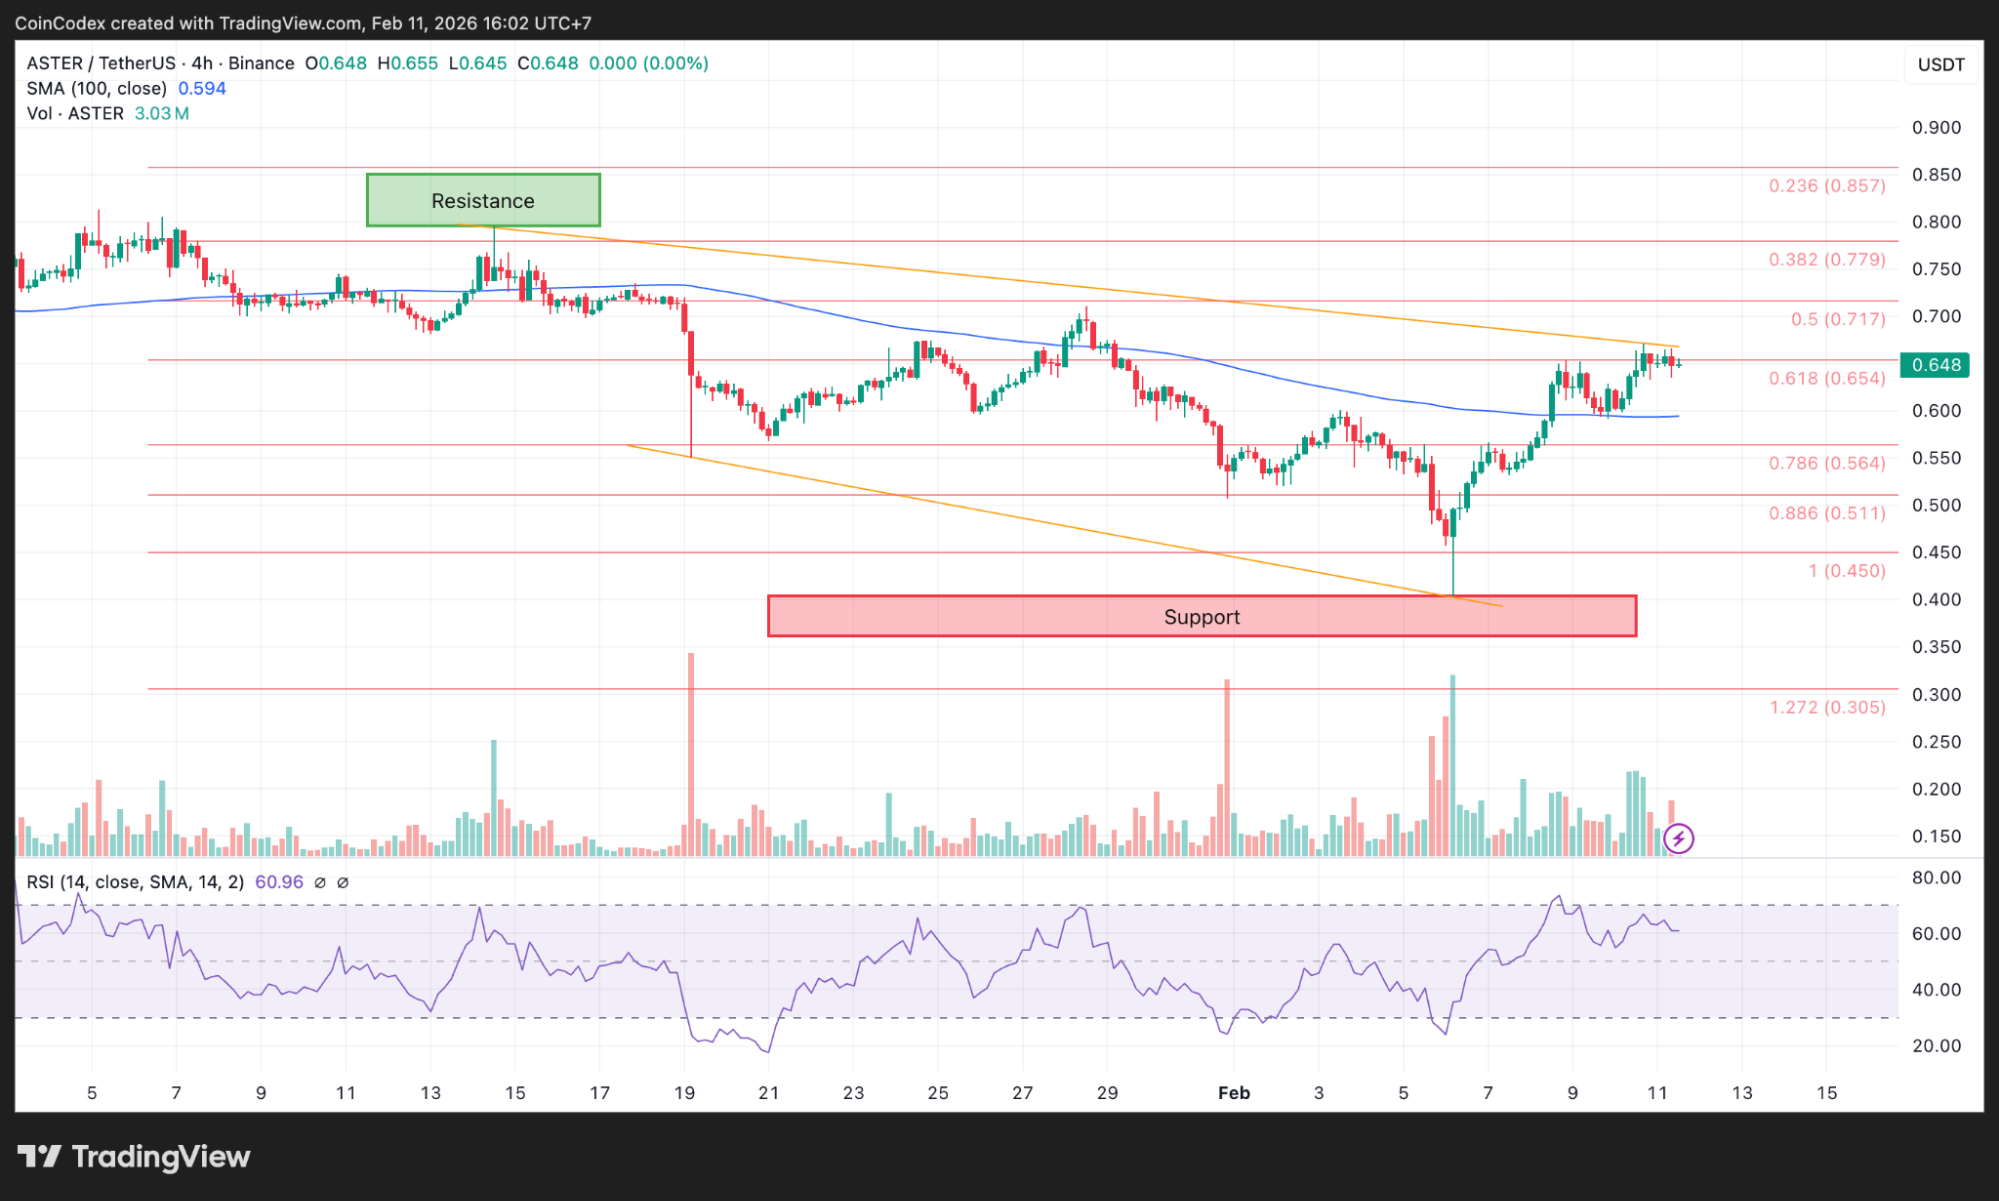
4-hour Aster price chart analysis
Above that, there’s an even heavier resistance zone up near $0.82–$0.85, and that’s the area marked clearly on the chart. This zone also lines up with the descending trendline that’s been pressing down on ASTER for weeks. If price can finally break through that, it would be a big signal that the downtrend is starting to lose its grip.
Momentum is picking up too. RSI is hovering close to 60, which shows buyers are starting to step in, but the market isn’t overheated yet. That’s usually the kind of setup you see when a breakout is still in its early stages.
The daily chart makes the bigger picture even easier to understand. The ASTER price is still miles below its launch highs, but the constant selloff has clearly slowed down. Price has been stabilizing, and now it’s pushing back into the same zone that used to act as support before the last breakdown.
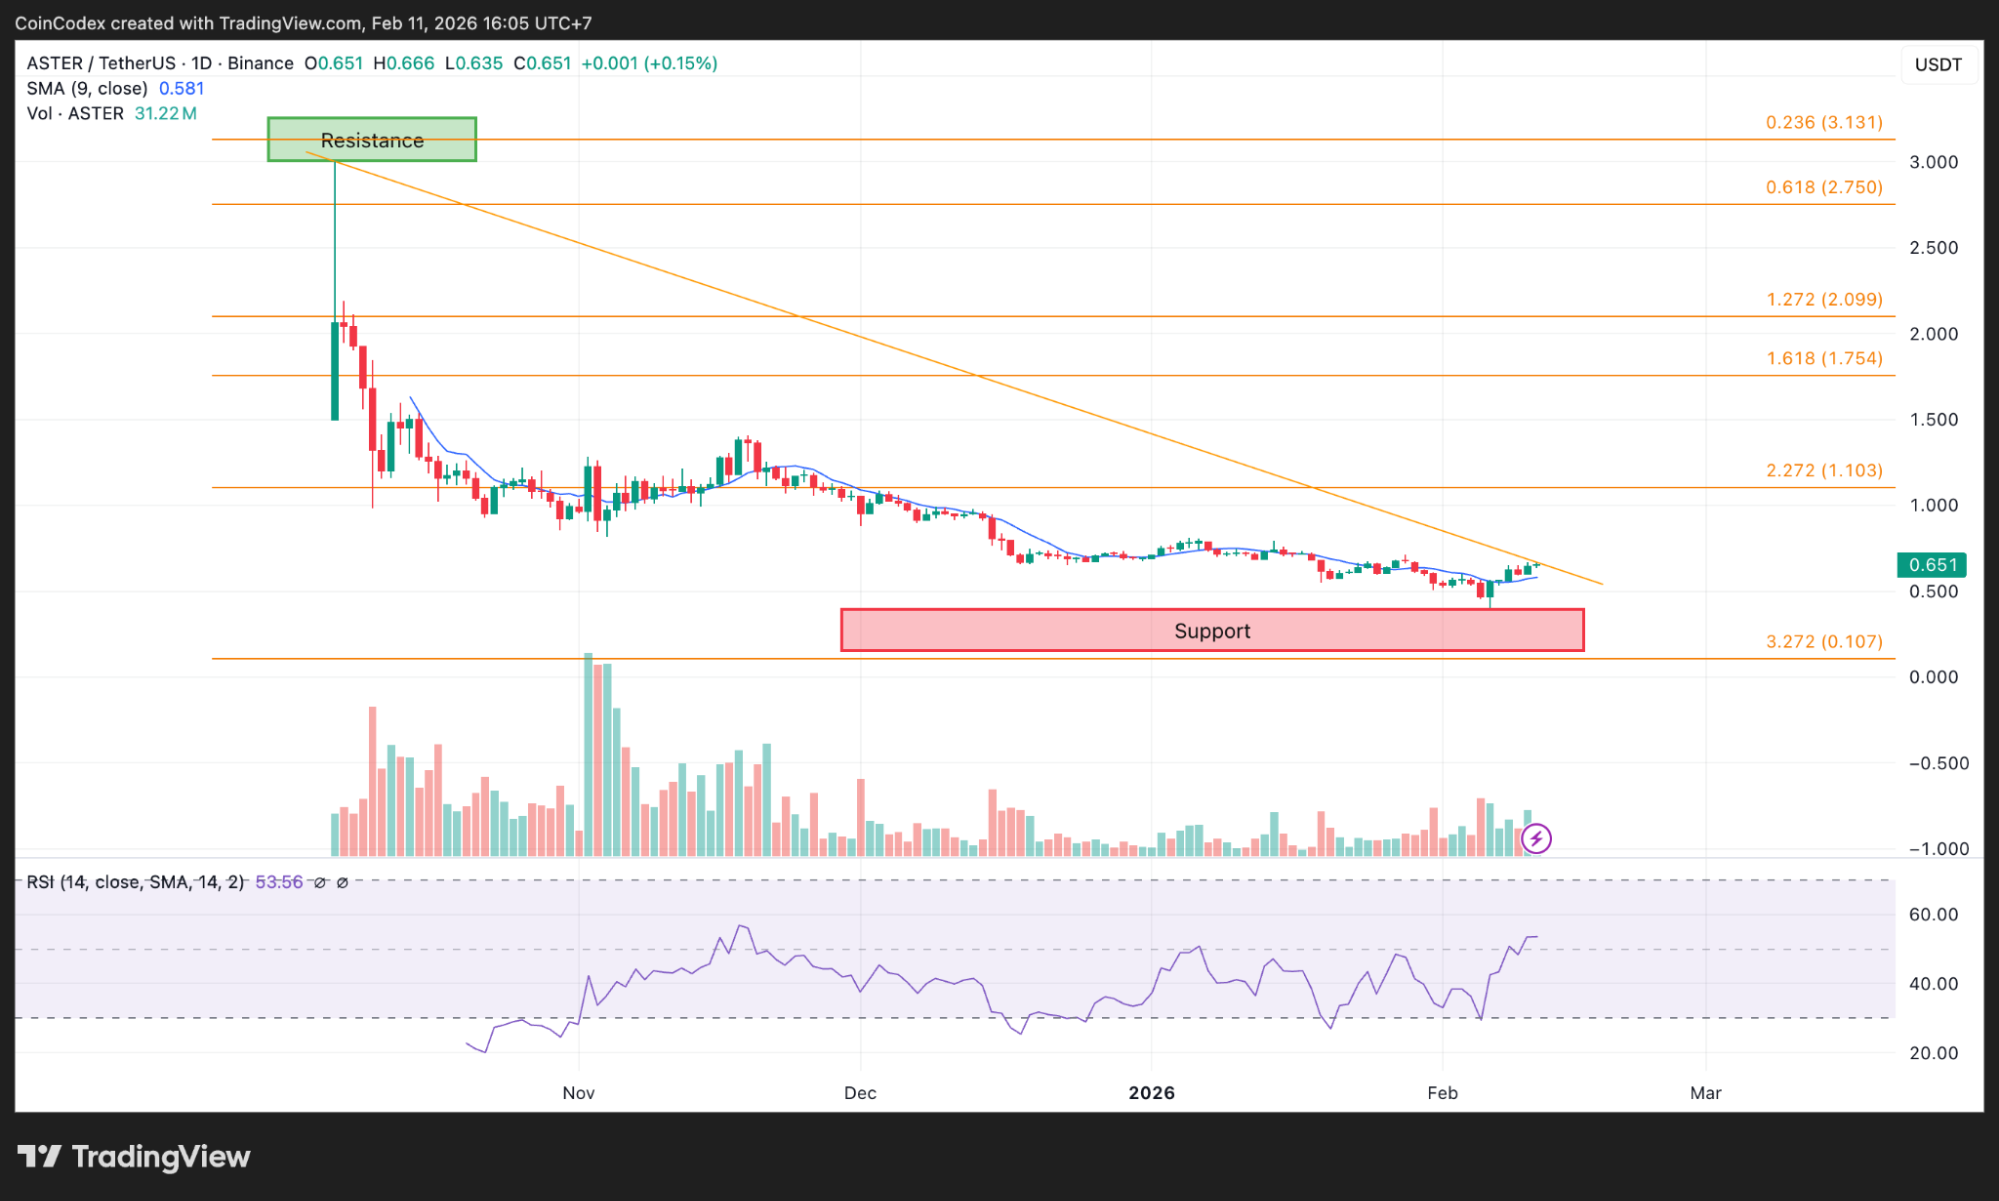
Daily Aster price chart analysis
That’s why this level matters so much. If ASTER can start closing daily candles above $0.70, it would be one of the first real signs that the chart is shifting from pure consolidation into something more bullish.
The good news is that the downside levels are pretty clean. The ASTER price has defended the $0.45–$0.55 support zone multiple times, and that area has basically become the floor of this entire post-launch decline.
As long as price stays above that base, ASTER has room to keep building higher lows and continue pressing into resistance.
What happens next for the ASTER price
At this point, everything comes back to the flip zone KNIGHT highlighted. If the ASTER price can hold above $0.65 and break through $0.75, the next major target becomes that $0.85 resistance block. Clear that, and $1.20 starts coming into view pretty quickly.
If the breakout fails and price drops back below $0.60, then ASTER probably returns to consolidation, with $0.50 as the key floor to watch. According to CoinCodex’s 1-month ASTER price prediction, the tokens’s price could drift toward $0.4892 in the near term, which leans more to the bearish side.
The ASTER price isn’t collapsing anymore. It’s pushing into resistance. And if this zone flips, the next move could be the first real trend change since the post-launch selloff.
Kraken: Best crypto exchange for security & reliability
- Buy, sell, and trade 400+ cryptocurrencies with industry-leading security
- Spot, Futures & Margin trading – leverage up to 5x for advanced traders
- Earn rewards with staking on top cryptocurrencies
- 24/7 customer support and high liquidity for fast trades
- Regulated in the US with strong compliance and security measures
- 13+ million users worldwide
Disclaimer: This content is for informational purposes only and does not constitute financial, investment, or other advice. Nothing on this page is a recommendation or solicitation. Always seek independent professional advice before making investment decisions. Some links may earn us a commission at no extra cost to you.
Source:: ASTER Price Prediction: Aster Could Be One Flip Away From a Recovery Run