Key highlights:
- Bitcoin approached $90,000 on January 20 as geopolitical tensions and macro risks increased volatility.
- Analysts identified $87,000 as a potential support level while traders monitor the $93,500 weekly resistance.
- Technical signals like the 21-week and 50-week death cross suggest Bitcoin may see short-term corrections before rebounding.
Bitcoin (BTC) approached an eight-day low of $90,000 on January 20 as macroeconomic and geopolitical factors created new challenges for bulls. The current volatility is driven in part by renewed trade tensions between the U.S. and the EU, sparked by statements from the U.S. President Donald Trump regarding territorial influence.
With trade tariffs back in effect, risk assets declined while safe-haven assets like gold and silver reached new highs as investors sought stability.
Bitcoin fails to break recent range
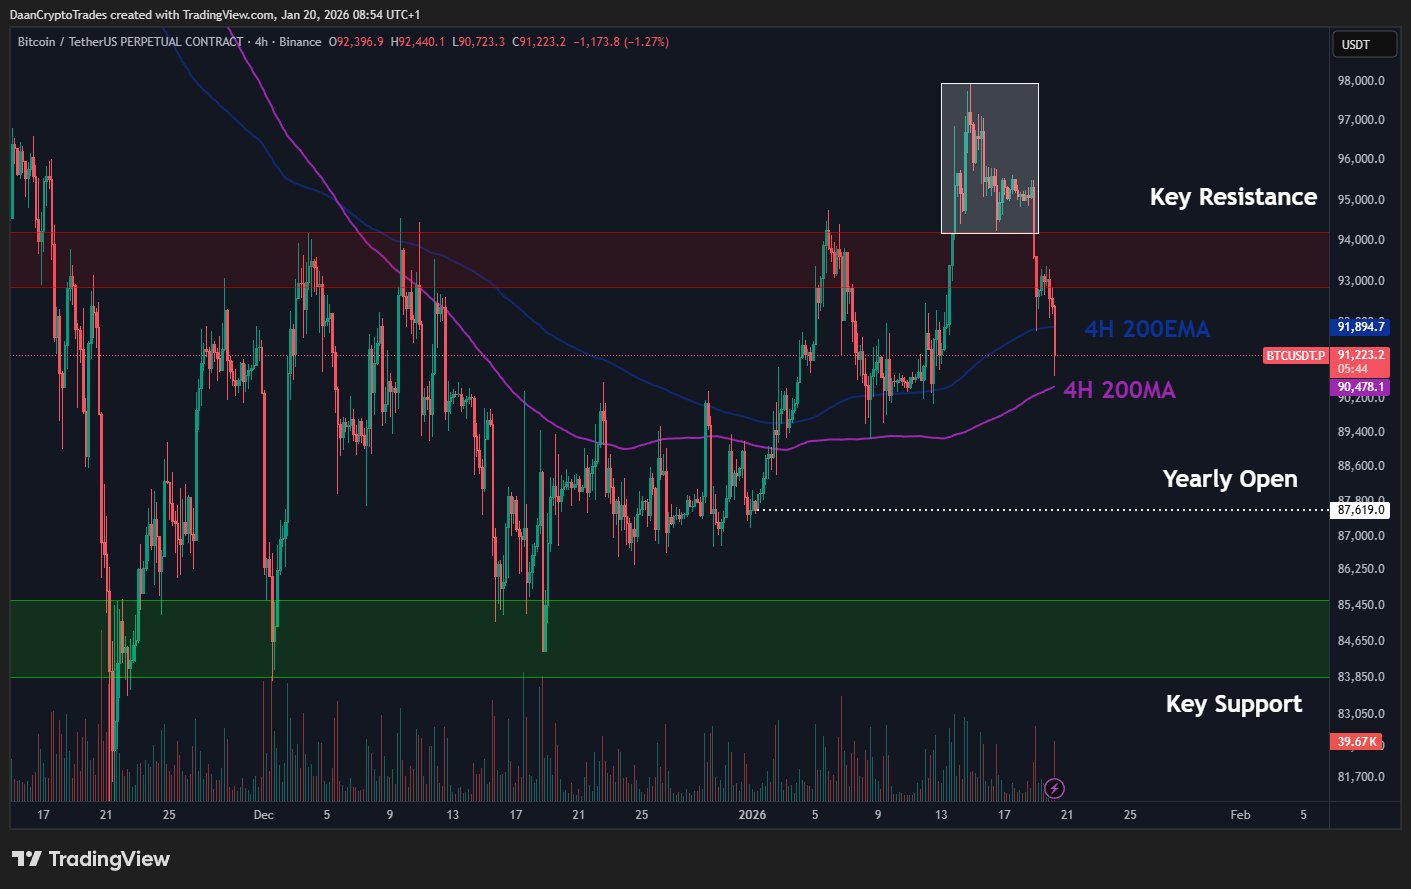
Traders noted that Bitcoin has returned to the $84,000-$94,000 trading range seen over the past two months. According to analyst Daan Crypto Trades, the recent breakout above this range failed, with $87,000 emerging as a key support level for early 2026.
BTC/USD 4-hour chart. Source: Daan Crypto Trades via X
He noted to his followers on X, formerly known as Twitter, that it is rare to see a yearly candlestick without a shadow at the bottom, and suggested that this level could be tested sooner rather than later.
Analyst Rekt Capital highlighted $93,500 as a significant weekly resistance level, noting that Bitcoin would need to regain control of this level to confirm a breakout of the weekly range and adding that the pullback from the bullish moving average cluster indicates traders remain cautious.
Bitcoin has indeed rejected from the cluster of Bull Market EMAs, forcing a post-breakout retest of the $93500 level
In fact, Bitcoin has marginally Weekly Closed above $93500, therefore resembling more the April 2025 Weekly Close above $93500 than the November 2024 one… https://t.co/yaEE3QcJRK pic.twitter.com/DHhhEZKLJp
— Rekt Capital (@rektcapital) January 19, 2026
Technical signals suggest short-term corrections
Keith Alan, founder of trading resource Material Indicators, pointed to the “death cross” of the 21-week and 50-week moving averages. Historically, this pattern has often indicated a long-term bottom rather than an immediate trend reversal.
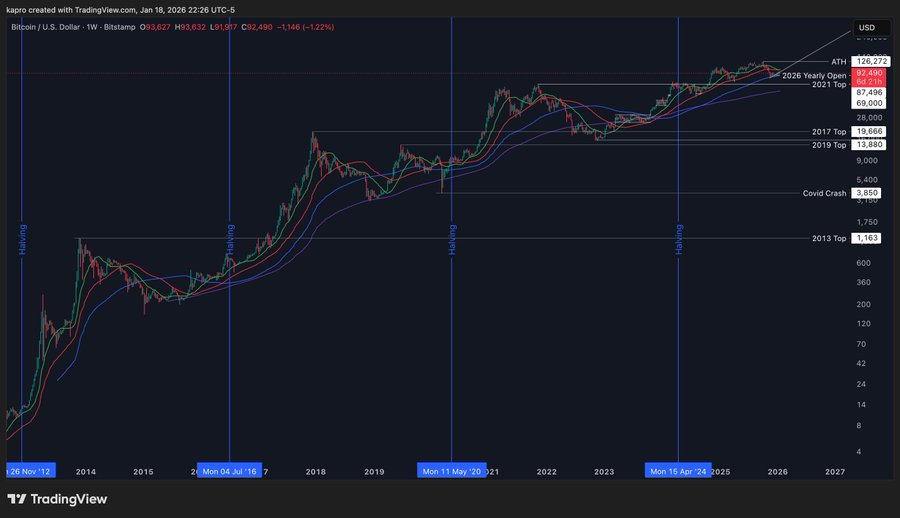
Source: Keith Alan via X
Alan also mentioned that Bitcoin could find support near the 100-week simple moving average at $86,900.
Veteran trader Peter Brandt presented a more bearish view, forecasting a potential decline toward $58,000 if selling pressure continues. The last time BTC traded near these levels was in October 2024.
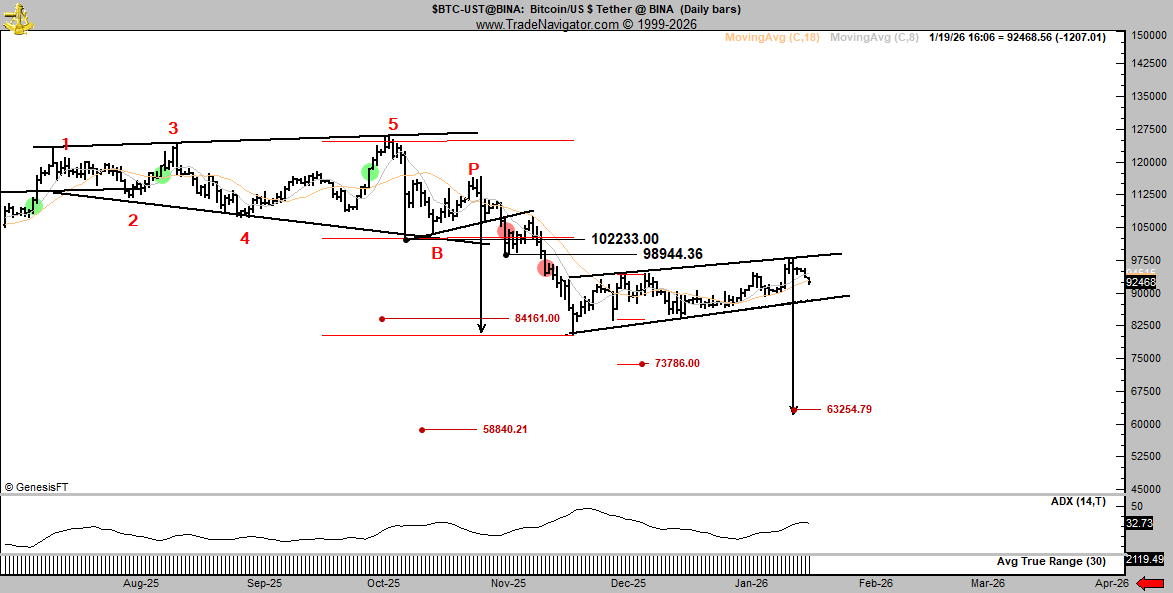
BTC/USD 1-Day Chart. Source: Peter Brandt via X
Bitcoin’s reaction to geopolitical events shows unusual behavior compared with traditional safe-haven assets. The January dip may also reflect typical seasonal liquidity effects as institutional investors rebalance portfolios after reporting periods.
Analysts are assessing whether the current correction signals a fundamental shift in Bitcoin’s perception or a temporary seasonal adjustment.
Source:: Analyst Warns Bitcoin Could Drop to $58,000 Amid New Death Cross