Key highlights:
- ETH price continues to maintain a position above the 100-day simple moving average at $2,345 with the daily RSI registering 63.
- The 4-hour RSI indicator touched a level of 70.58, indicating overbought conditions.
- Funding rates on various exchanges reflect greed readings, while ETH/BTC dominance is at a new high not seen since January.
The price of Ethereum has reached a level of $2,391, but the thing that is crucial to notice there is what lies under the surface. Ethereum price dominance over Bitcoin has achieved its maximum point since early January.
But here is the catch. Funding rates across exchanges are flashing familiar greed signals. The same kind of FOMO that has preceded pullbacks in the past. The ETH price is in a good spot, but the crowd is getting excited. That tension is worth watching.
On-chain data says caution, not panic
The Santiment data adds a whole other layer. Ethereum’s funding rates across exchanges are showing greed. The same kind of funding rate FOMO that Santiment has flagged before.
📈 Ethereum has jumped as high as $2,391, and its price dominance against Bitcoin is officially at its highest level since late January. According to funding rates across exchanges, there are some familiar $ETH greed signals.
🔗 Link to Santiment chart: https://t.co/o6kUKLddVj pic.twitter.com/gkBqtJ3S10
— Santiment (@santimentfeed) April 14, 2026
When funding rates get too high, it means long positions are paying short positions, and that often leads to a squeeze or a cooldown. The ETH price dominance against Bitcoin is also at a two month high. That is a genuine shift. Ethereum is leading, not following.
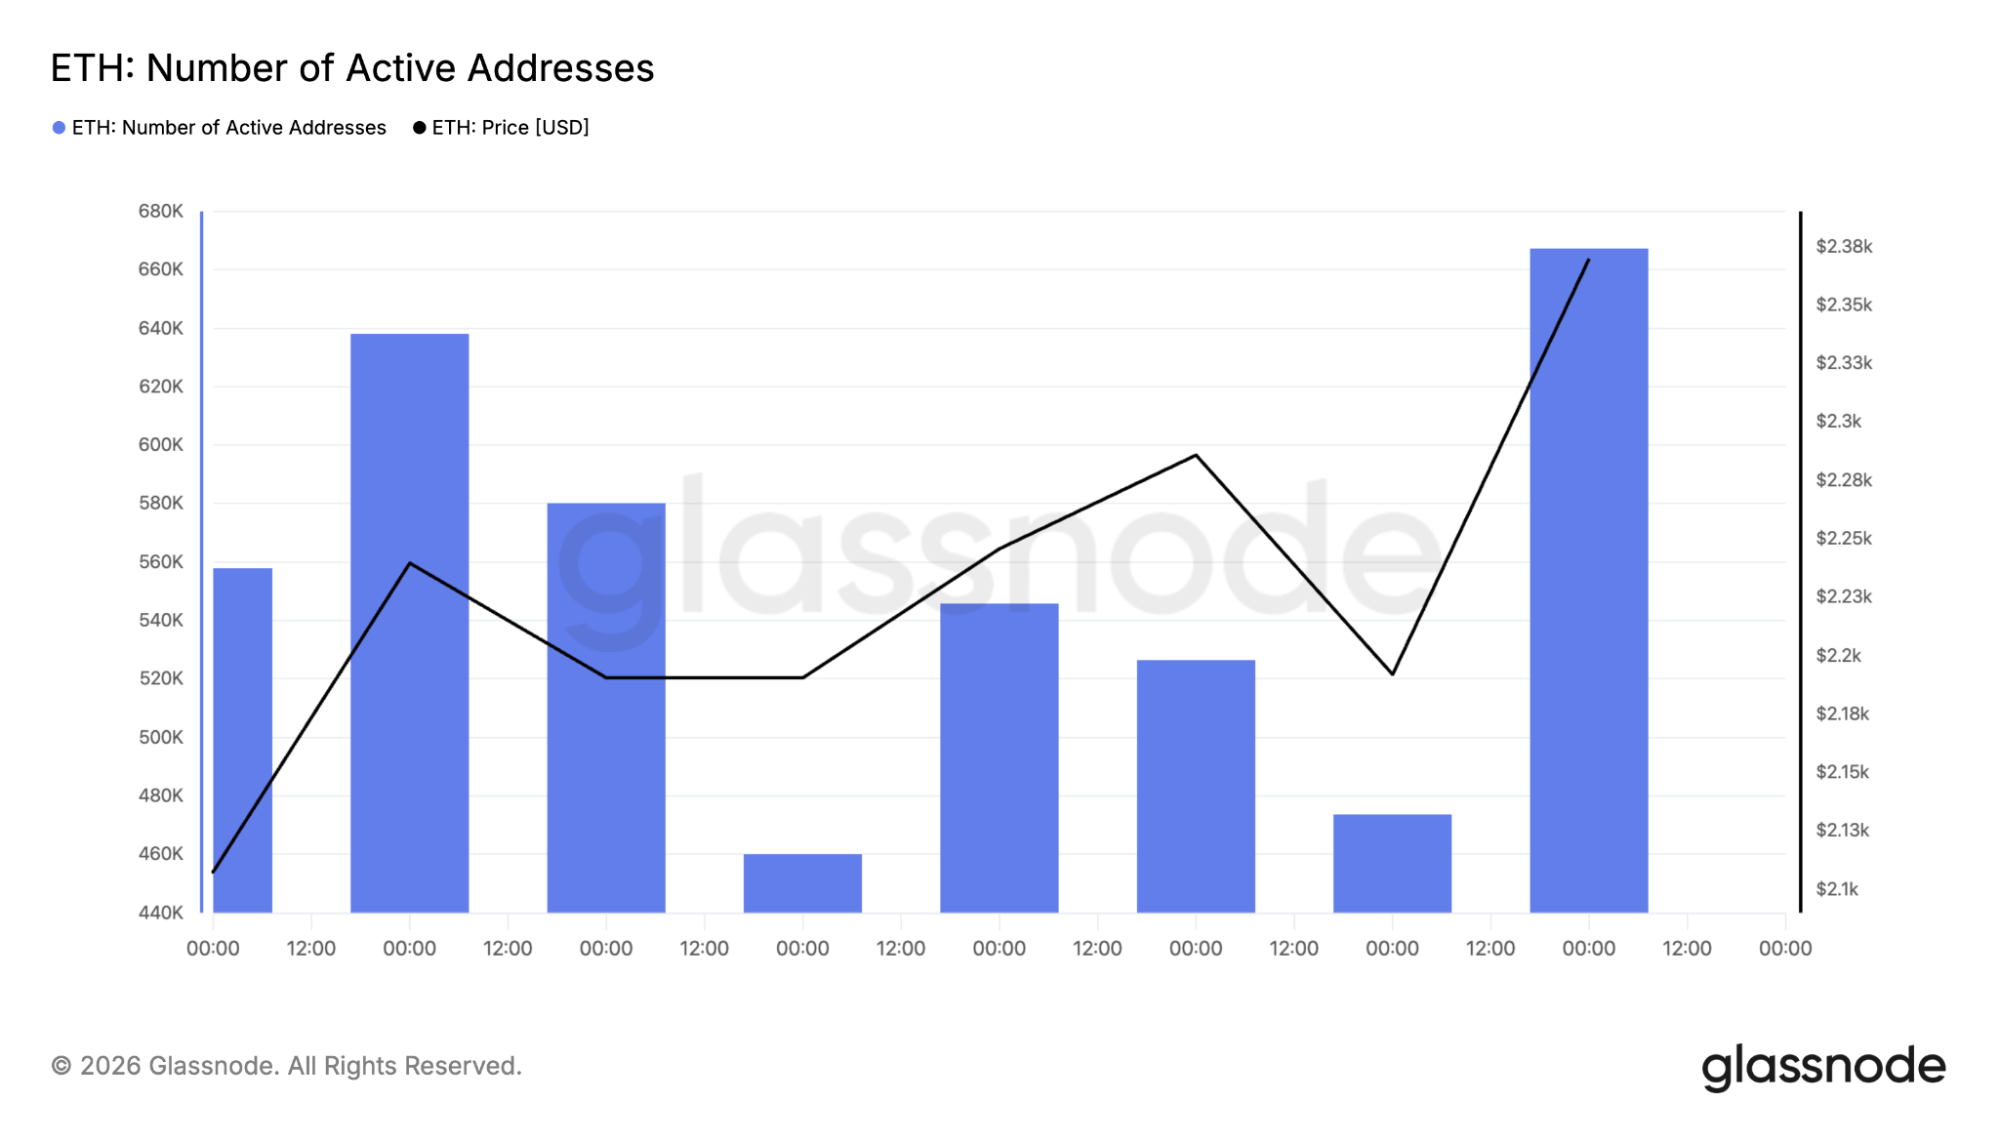
The Glassnode charts show steady network activity. The number of active addresses has been holding near 560,000, and the number of transactions is hovering around 3.2 million. Those numbers are not exploding higher, but they are not collapsing either.
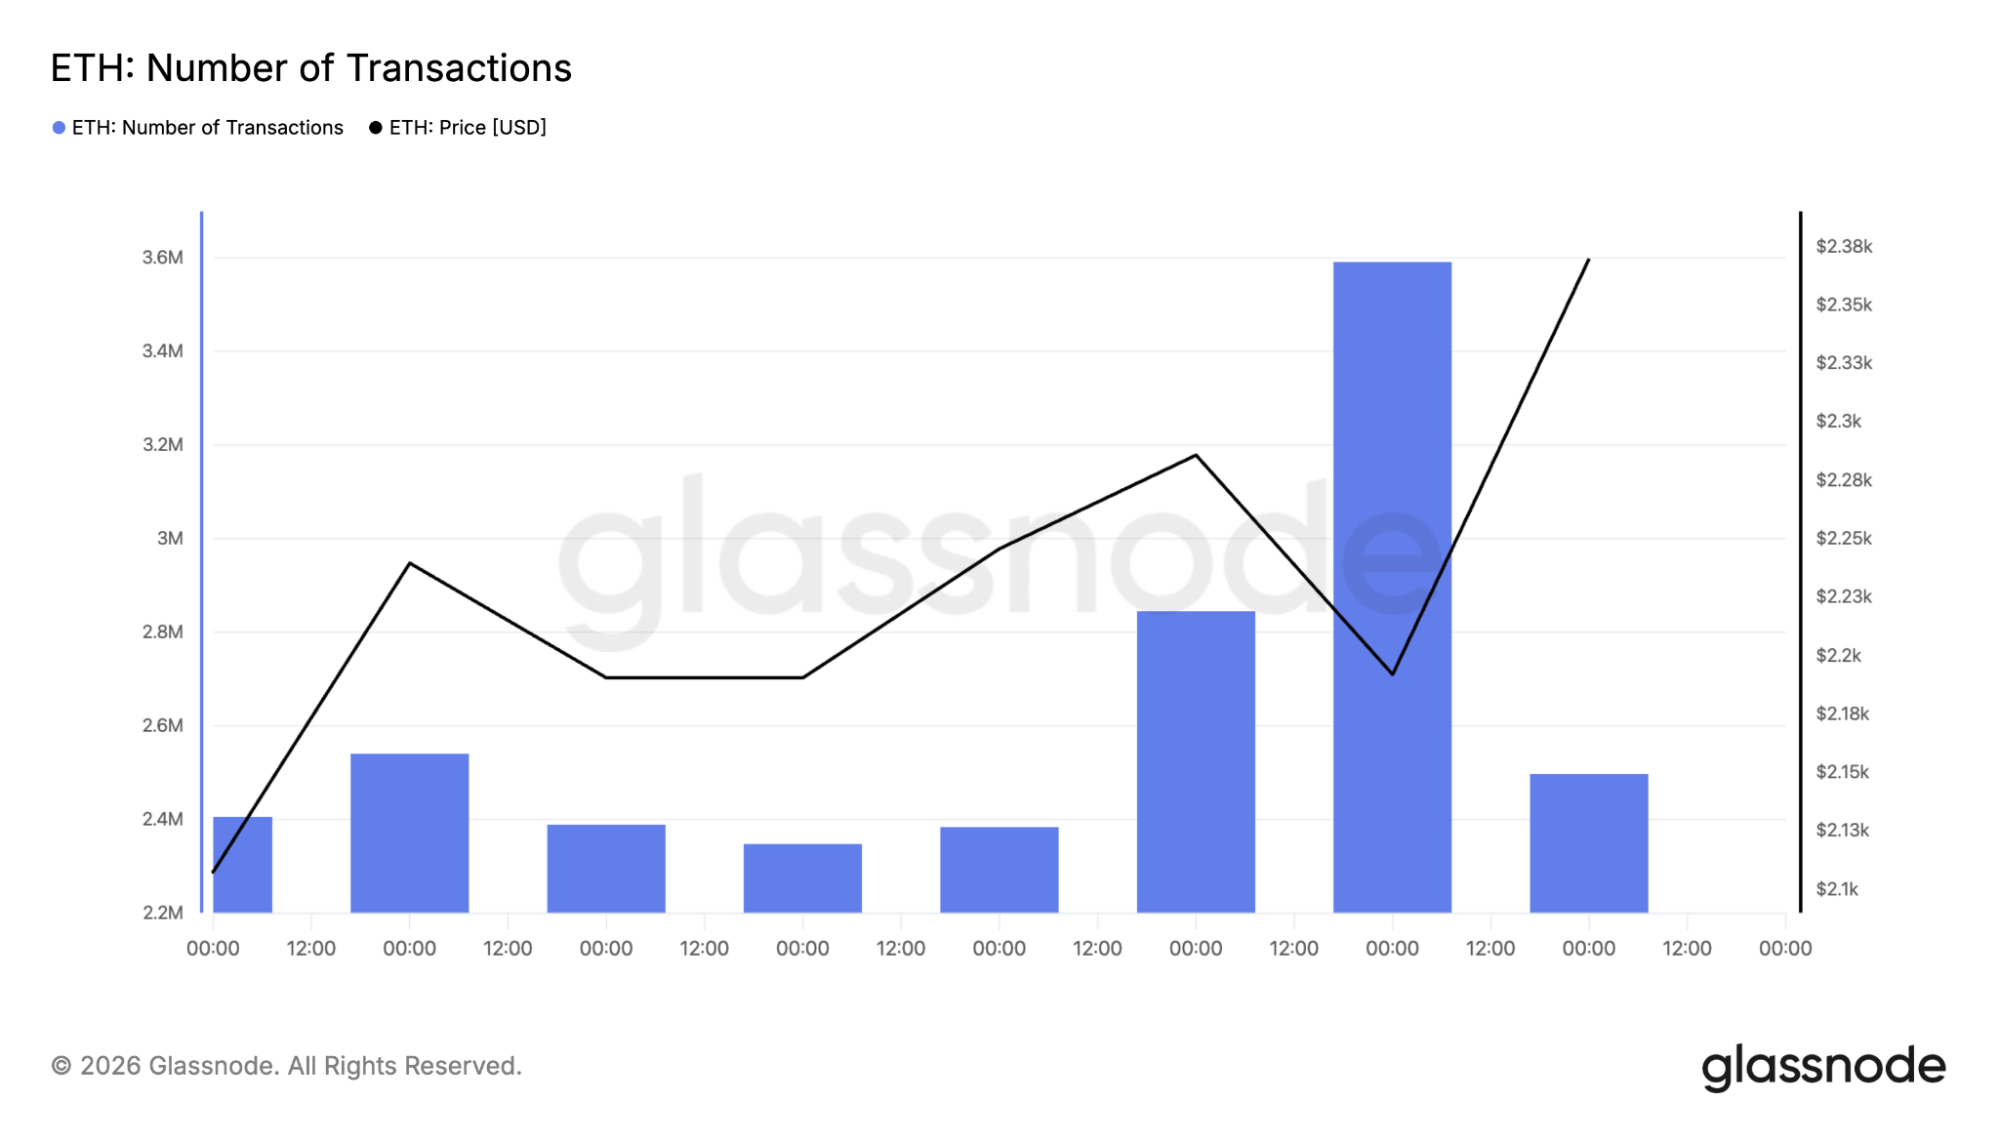
The ETH price is moving up on relatively quiet on-chain activity. That indicates the current move is more about macro sentiment and Bitcoin rotation than a fundamental explosion in Ethereum usage.
ETH price outlook: Two charts, one bullish setup with a yellow flag
We had a look at the ETH daily chart, and the structure is bullish but cautious. The ETH price closed the latest day at $2,366.97, down 0.33% on the session, with a high of $2,377.67 and a low of $2,362.78. The 100-day SMA sits below at $2,345.79, and the ETH price has been holding above that level for several days. That is a positive sign. The 100 SMA is now acting as support instead of resistance.
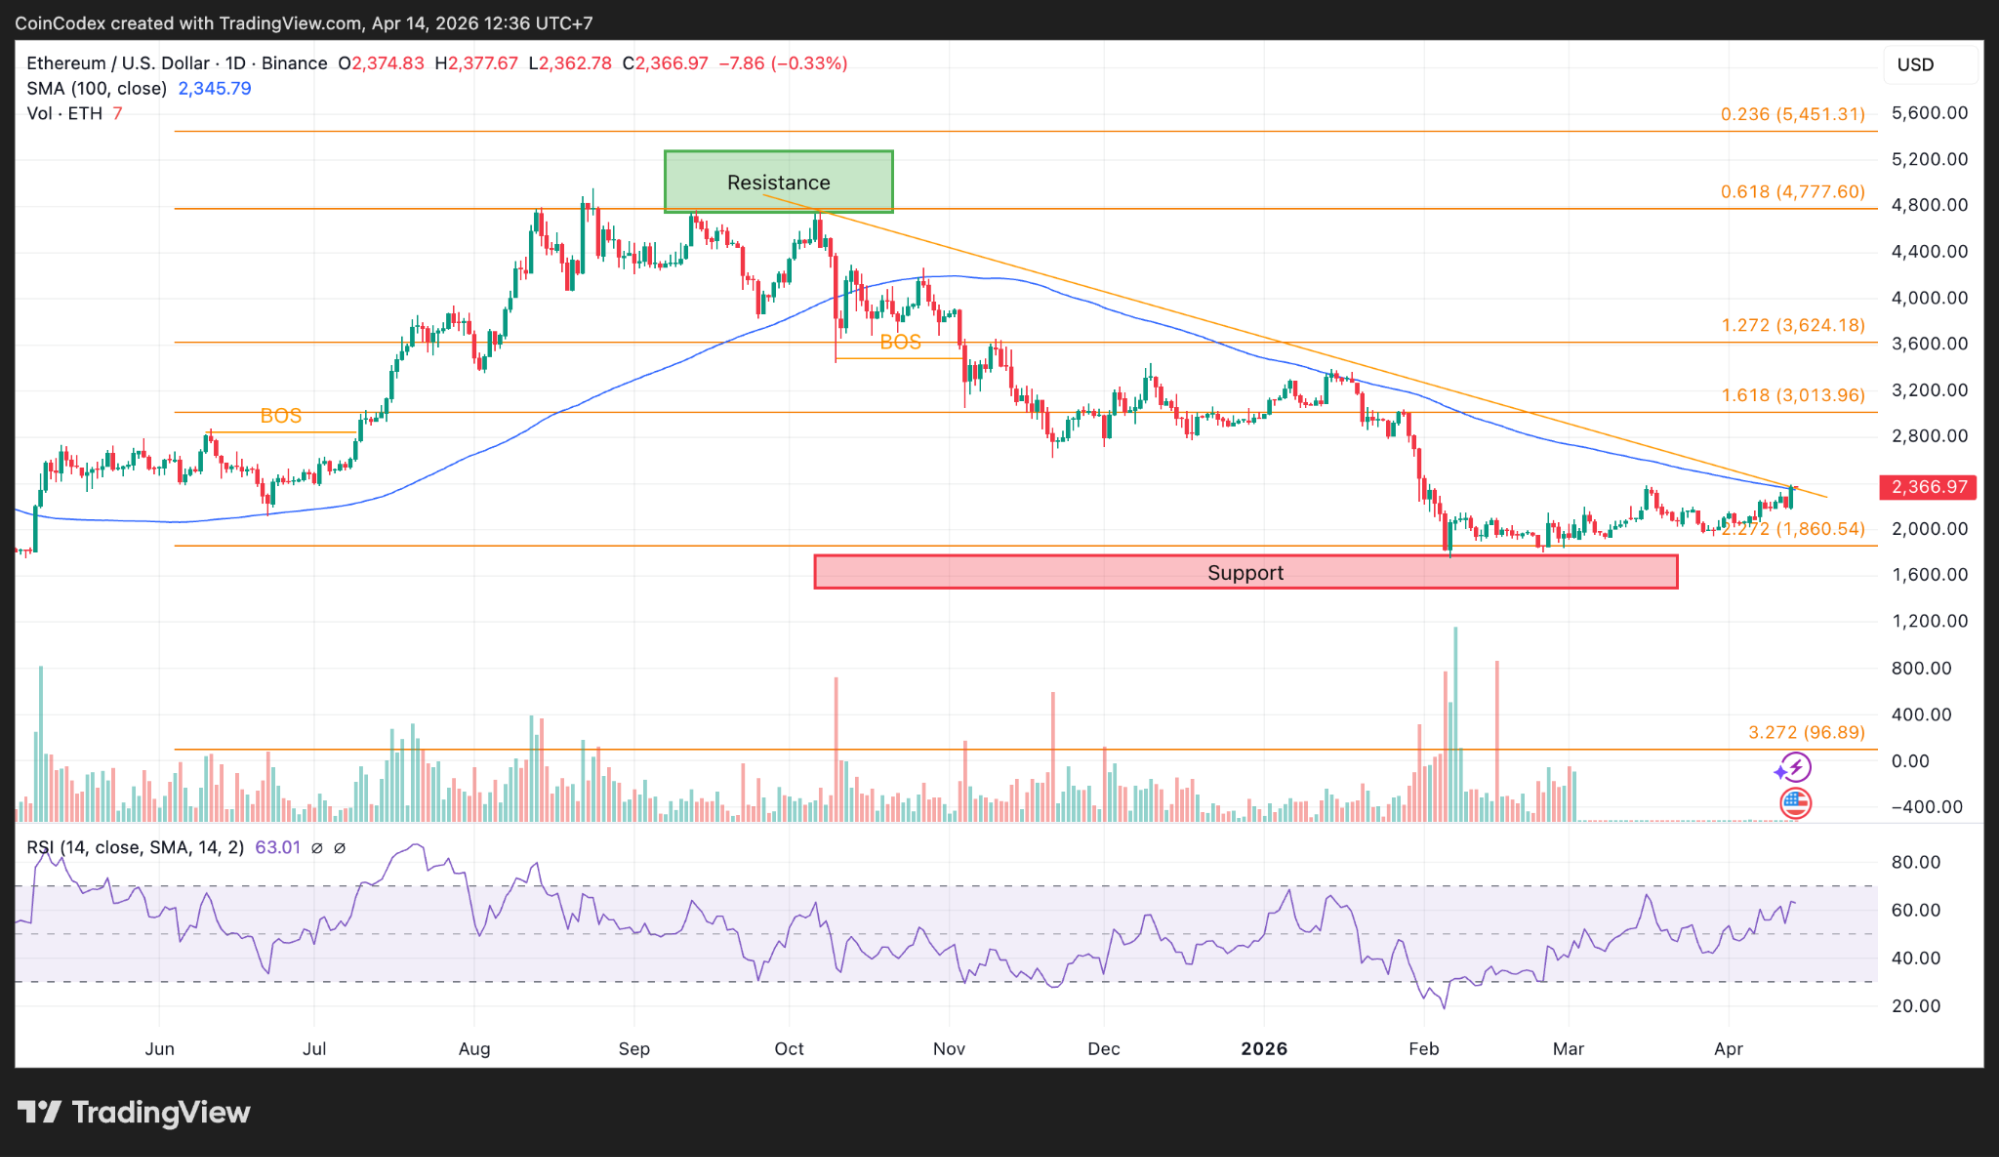
Daily ETH price chart analysis.
The daily chart shows a clear resistance zone above near $2,600 to $2,700. That is the ceiling that has rejected price multiple times. Support sits below near $2,100 to $2,200. The daily RSI is at 63.01, which is bullish but not overbought. There is room to run before hitting the 70 level that often signals a short-term top. The ETH price is in a nice spot technically. Above key moving averages, room to run, but not overheated.
The 4-hour chart gives us a closer look at the short-term setup. The ETH price is trading at $2,366.97, down 0.21% on the session. The 100 period SMA sits way down at $2,132.24, which means the ETH price is well above its short-term average.
That is a strong bullish signal. The 4-hour chart also has Fibonacci levels marked. The 0.382 level sits at $2,300. The 0.618 level is at $2,109.49. The 0.786 level is at $1,934.85. Those are the downside support zones if the ETH price corrects.
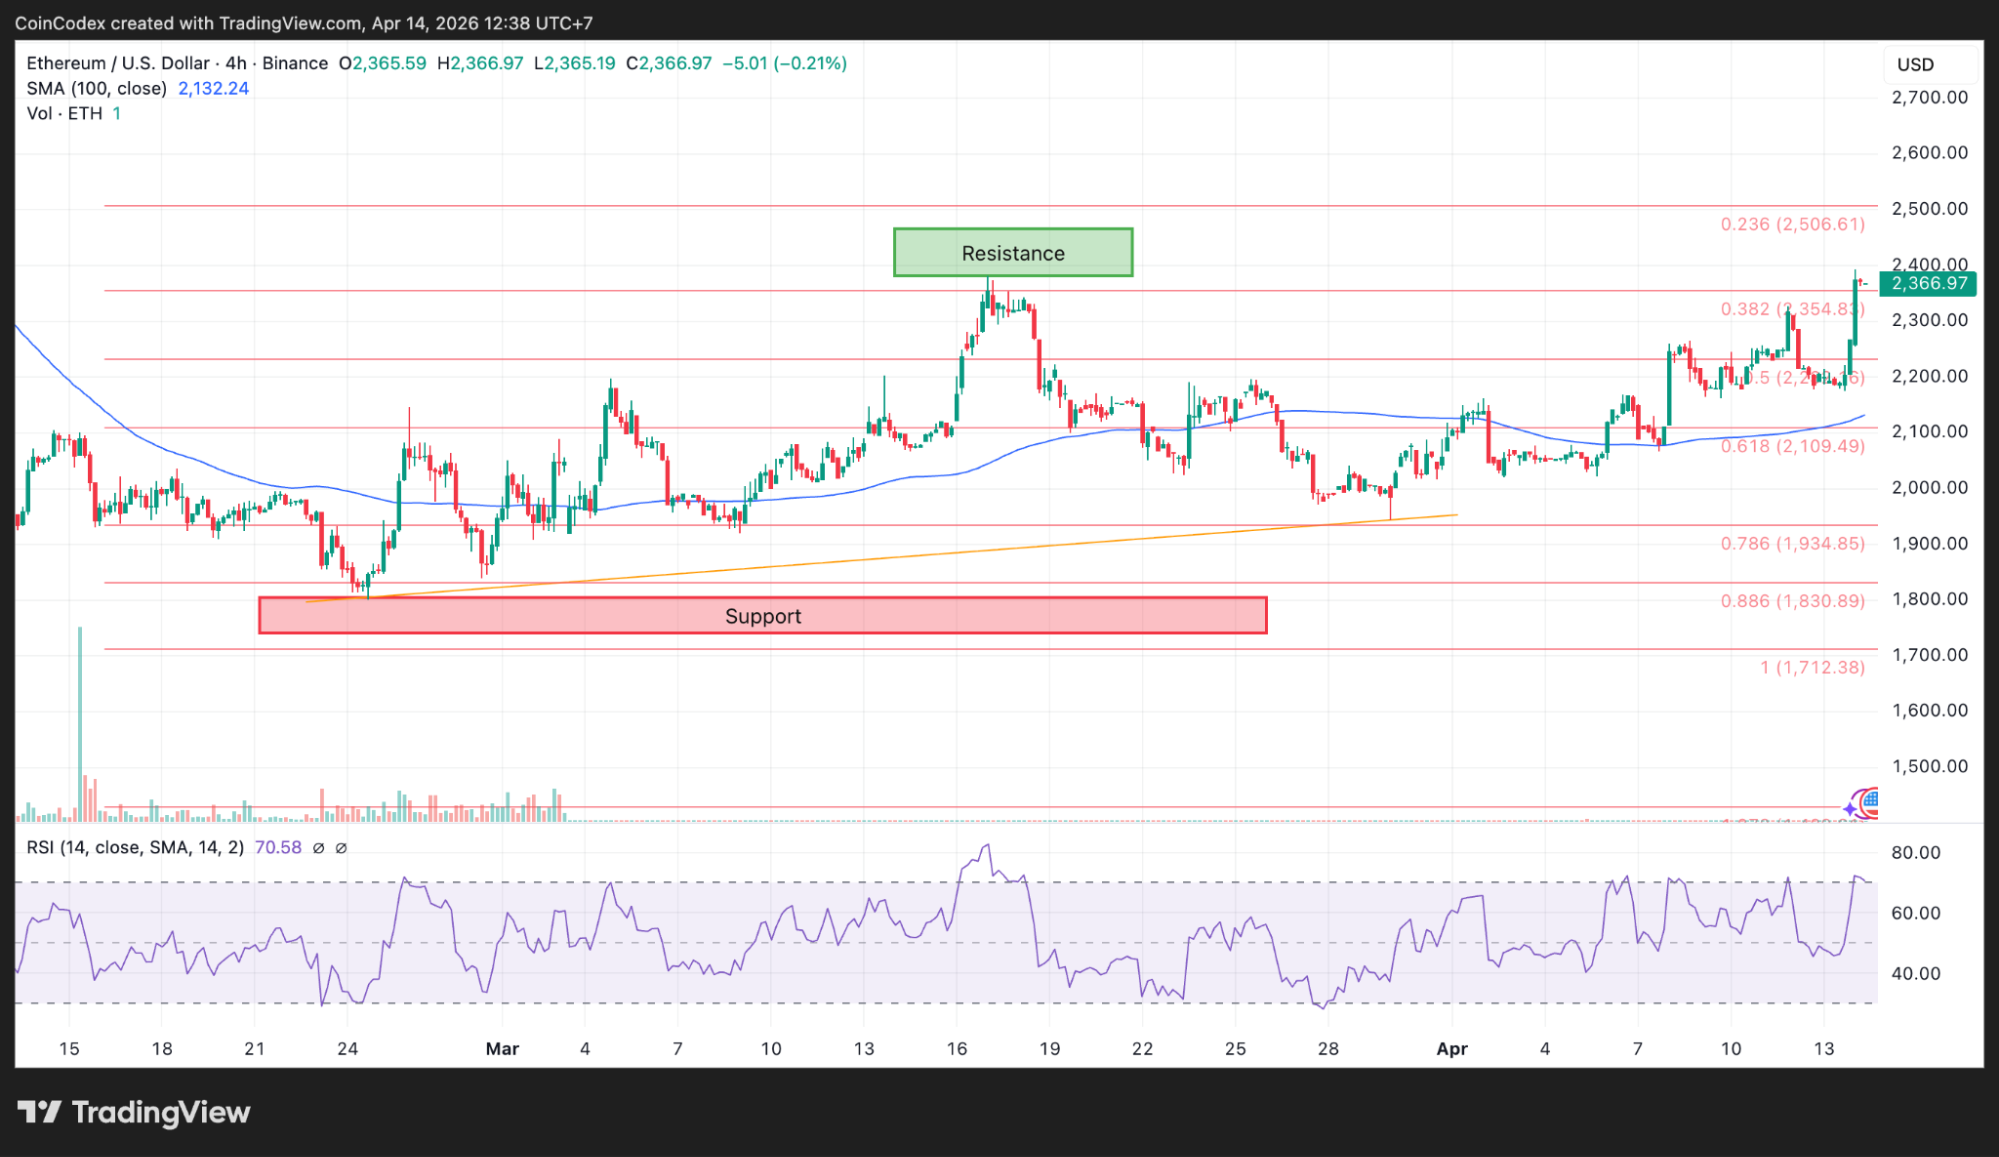
4-hour ETH price chart analysis.
The 4-hour RSI is at 70.58, which is overbought. That is the first yellow flag. When the 4-hour RSI gets above 70, the ETH price is usually due for a pause or a small pullback. It does not mean the rally is over.
It means the short-term move has been fast, and some profit taking is normal. The resistance on the 4-hour chart is stacked above at $2,400, then $2,500, then $2,600. The ETH price is knocking on the door of $2,400 right now.
Where the ETH price goes from here
The immediate level to watch is $2,400. An upward breakout of this level would make it possible for the price to test $2,500 and $2,600. The main obstacle for the price on the daily chart will be the area between $2,600 and $2,700. Overcoming this obstacle will pave the way to $3,000.
The nearest support will be $2,300, $2,200, and the 0.618 Fibonacci level at $2,109. On the 4-hour chart, the value of the RSI at 70.58 indicates a small pullback or consolidation would be healthy. That does not mean the ETH price crashes. It means the rocket needs to refuel.
CoinCodex’s 1-month ETH price prediction places the price at $2,762.90, about 17% above the current level. That forecast lines up with the daily chart’s resistance zone near $2,600 to $2,700. But the ETH price is also showing genuine strength against Bitcoin.
The daily chart is bullish. The 4-hour chart is overbought but trending. The on-chain data is neutral to positive. The ETH price is at a crossroads. It can either cool off and then go higher, or it can keep ripping and risk a sharper correction. Either way, the trend is up. The only question is the path.
Kraken: Best crypto exchange for security & reliability
- Buy, sell, and trade 400+ cryptocurrencies with industry-leading security
- Spot, Futures & Margin trading – leverage up to 5x for advanced traders
- Earn rewards with staking on top cryptocurrencies
- 24/7 customer support and high liquidity for fast trades
- Regulated in the US with strong compliance and security measures
- 13+ million users worldwide
Disclaimer: This content is for informational purposes only and does not constitute financial, investment, or other advice. Nothing on this page is a recommendation or solicitation. Always seek independent professional advice before making investment decisions. Some links may earn us a commission at no extra cost to you.
Source:: Ethereum Price Prediction: ETH Dominates Bitcoin, but Funding Rate Greed Returns