Key highlights:
- The WLFI price just bounced hard from a major support zone, but the bigger downtrend hasn’t disappeared yet.
- Volume exploded during the move, which makes it look more like a speculative rush or short-covering than a clean trend reversal.
- The next Fibonacci resistance levels will be the real test for whether WLFI can keep climbing or stalls out again.
World Liberty Financial is suddenly back in the conversation again. After weeks of sliding lower, the WLFI price has finally put together a real bounce, jumping close to 15% in the last 24 hours and pushing back toward the $0.115 area.
WLFI has managed to break out of that quiet downtrend rhythm and actually wake traders up again. There wasn’t some huge news headline behind it either. No major catalyst. No obvious announcement.
This looks much more like a technical reaction: price hit a level where buyers have stepped in before, volume spiked hard, and shorts may have been forced to back off. Trading volume exploding to over $250 million adds to that picture. That’s usually what happens when a coin goes from “nobody cares” to “everyone’s watching” in a hurry.
The WLFI price finally defended its key support zone
If you zoom out on the daily chart, the setup makes a lot of sense. The WLFI price has been trending lower for most of the month, with sellers basically shutting down every rally attempt. Each bounce got sold off, and price kept slipping into lower territory.
But once WLFI dropped into the $0.10–$0.11 range, things changed. That zone has acted as a major demand area before, and it’s exactly what analyst The Boss pointed out earlier this week.
🔷️ Three days ago, we mentioned that #WLFI ( @worldlibertyfi ) was trading within a key support zone. As anticipated, $WLFI reacted positively from that support area and recorded an approximate 20% increase.
On the chart, the yellow lines represent the resistance levels to… https://t.co/oLldIx77ja pic.twitter.com/vLDECEcNYS
— The Boss (@Crypto_TheBoss) February 18, 2026
The idea was that this is where buying interest has historically shown up, and if the level held again, a rebound was likely. That’s exactly what played out.
The WLFI price snapped higher off support, posting a fast 20% move off the lows. And for the first time in weeks, buyers didn’t just show up, they actually showed up with force. So yes, the bounce is real. Now the harder part begins.
On-chain data shows WLFI isn’t being ignored anymore
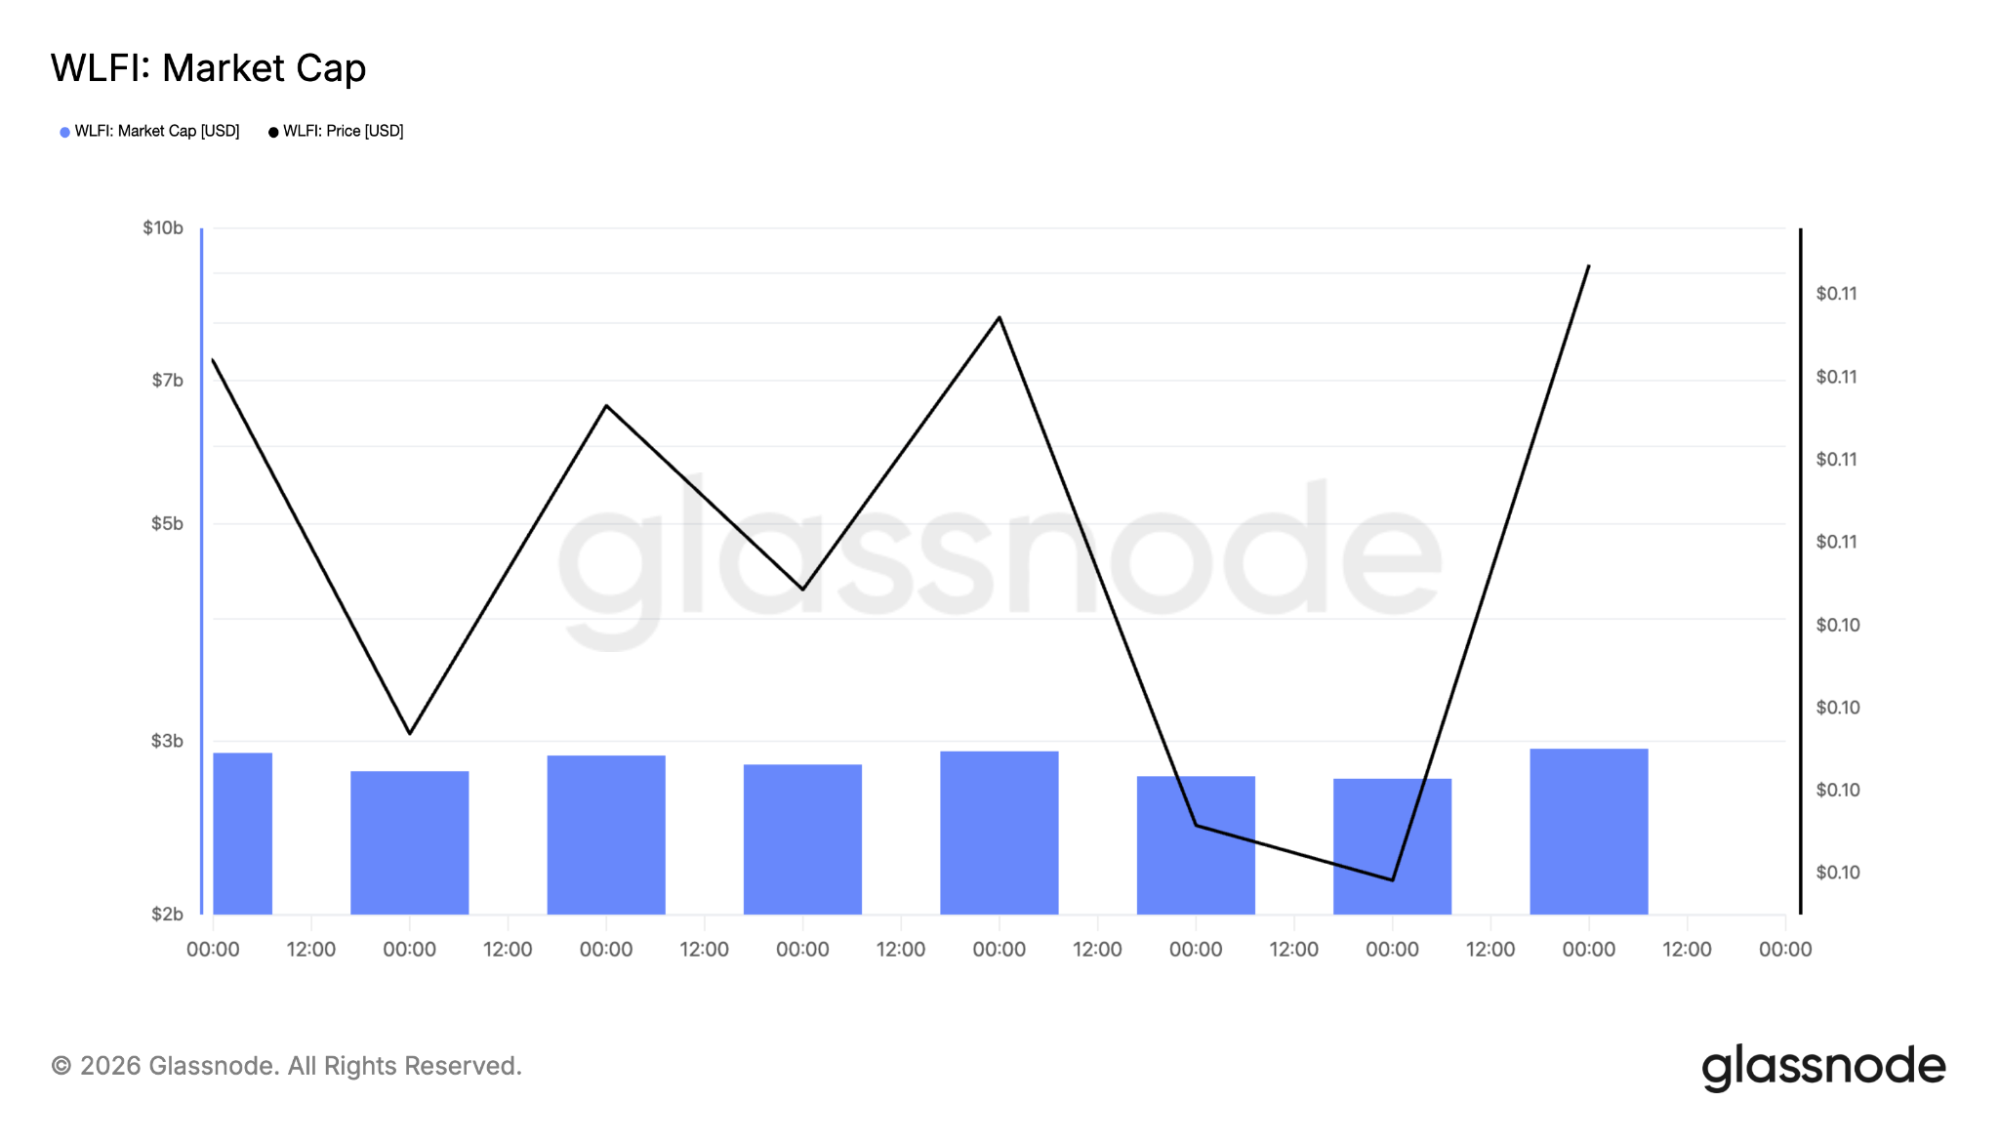
The Glassnode charts add another interesting layer here. This rebound isn’t just happening on the price chart. Market cap has started climbing again after dipping earlier this month, which is usually a sign that fresh participation is returning, not just a random bounce on thin liquidity.
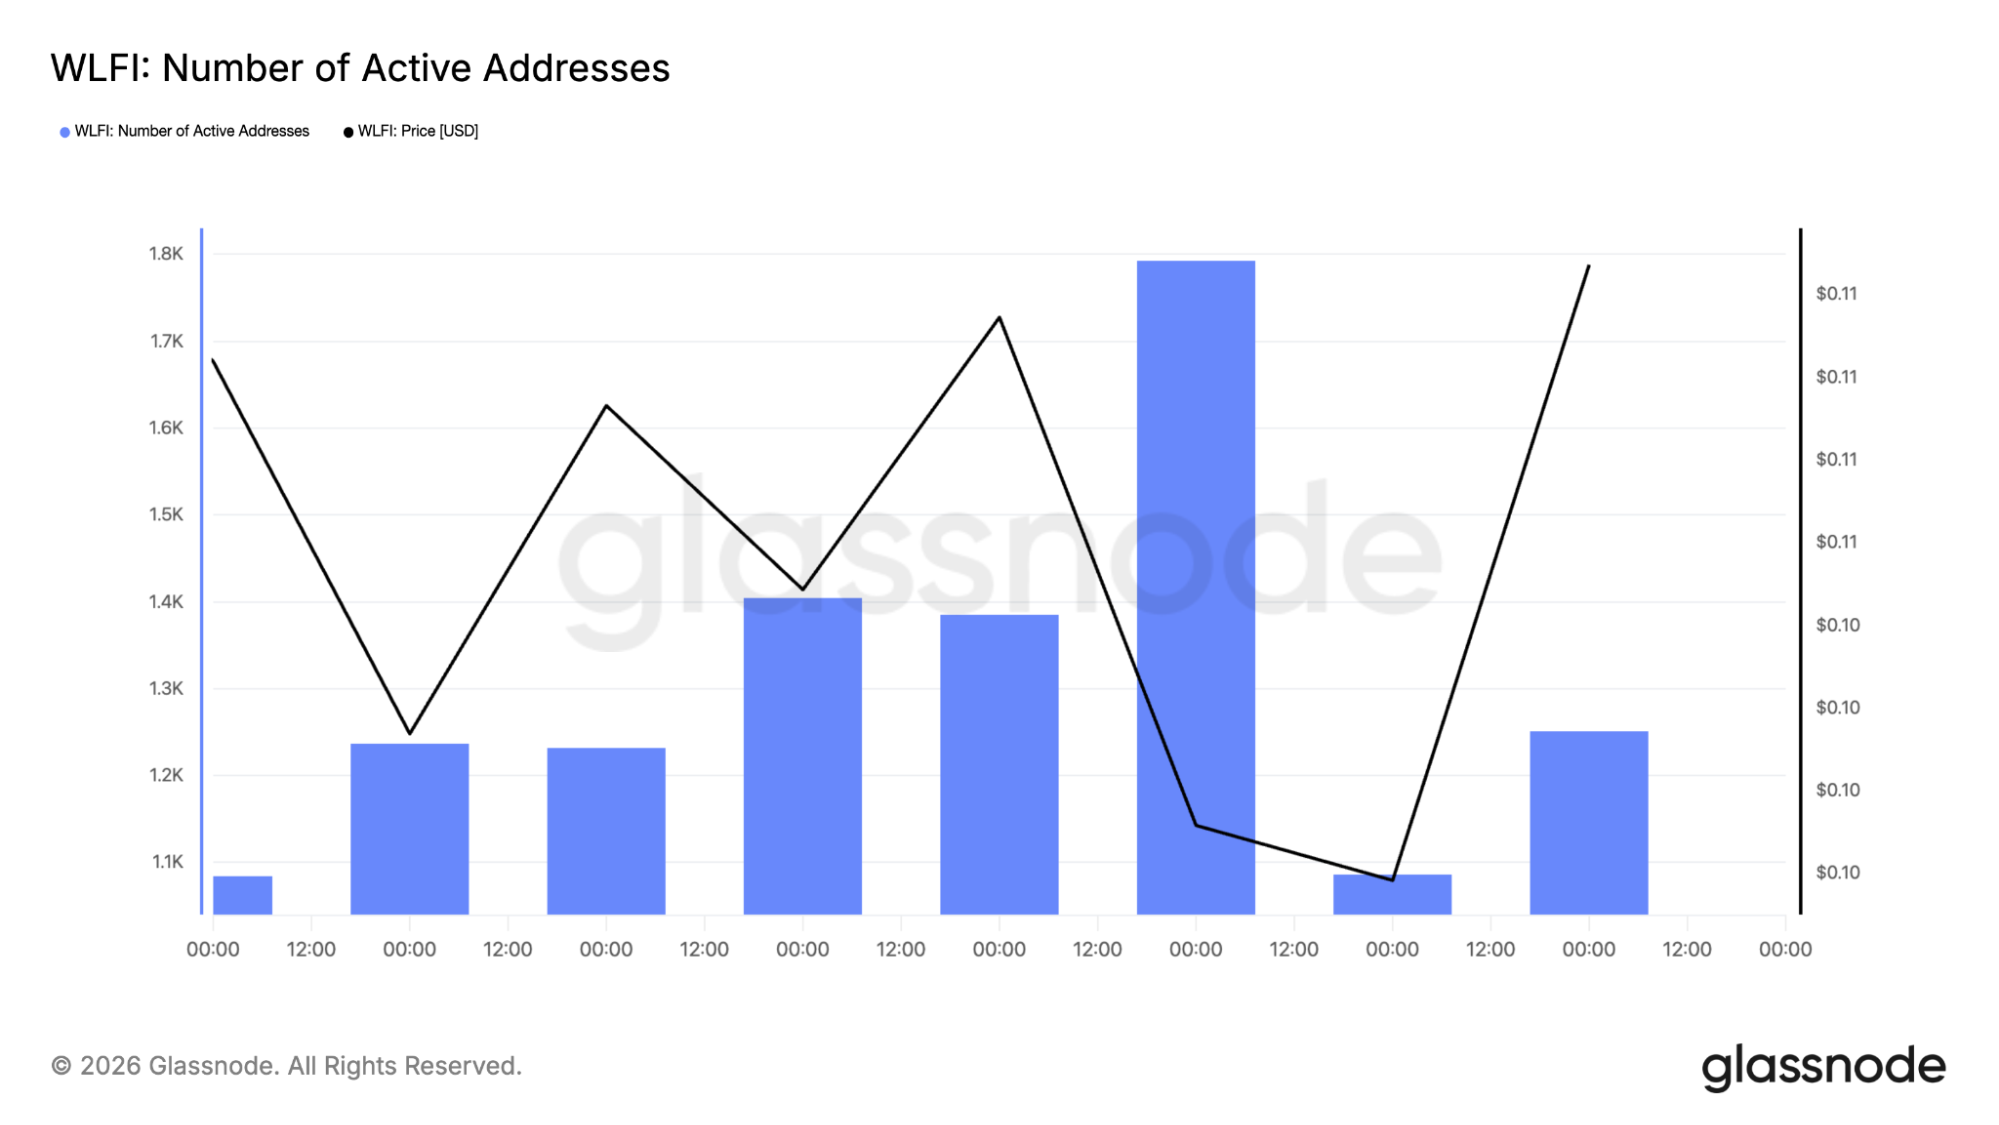
Active addresses also jumped during the move, meaning more wallets are interacting with WLFI again. That’s often one of the first signals that a coin is coming back onto traders’ radar after being quiet for a while.
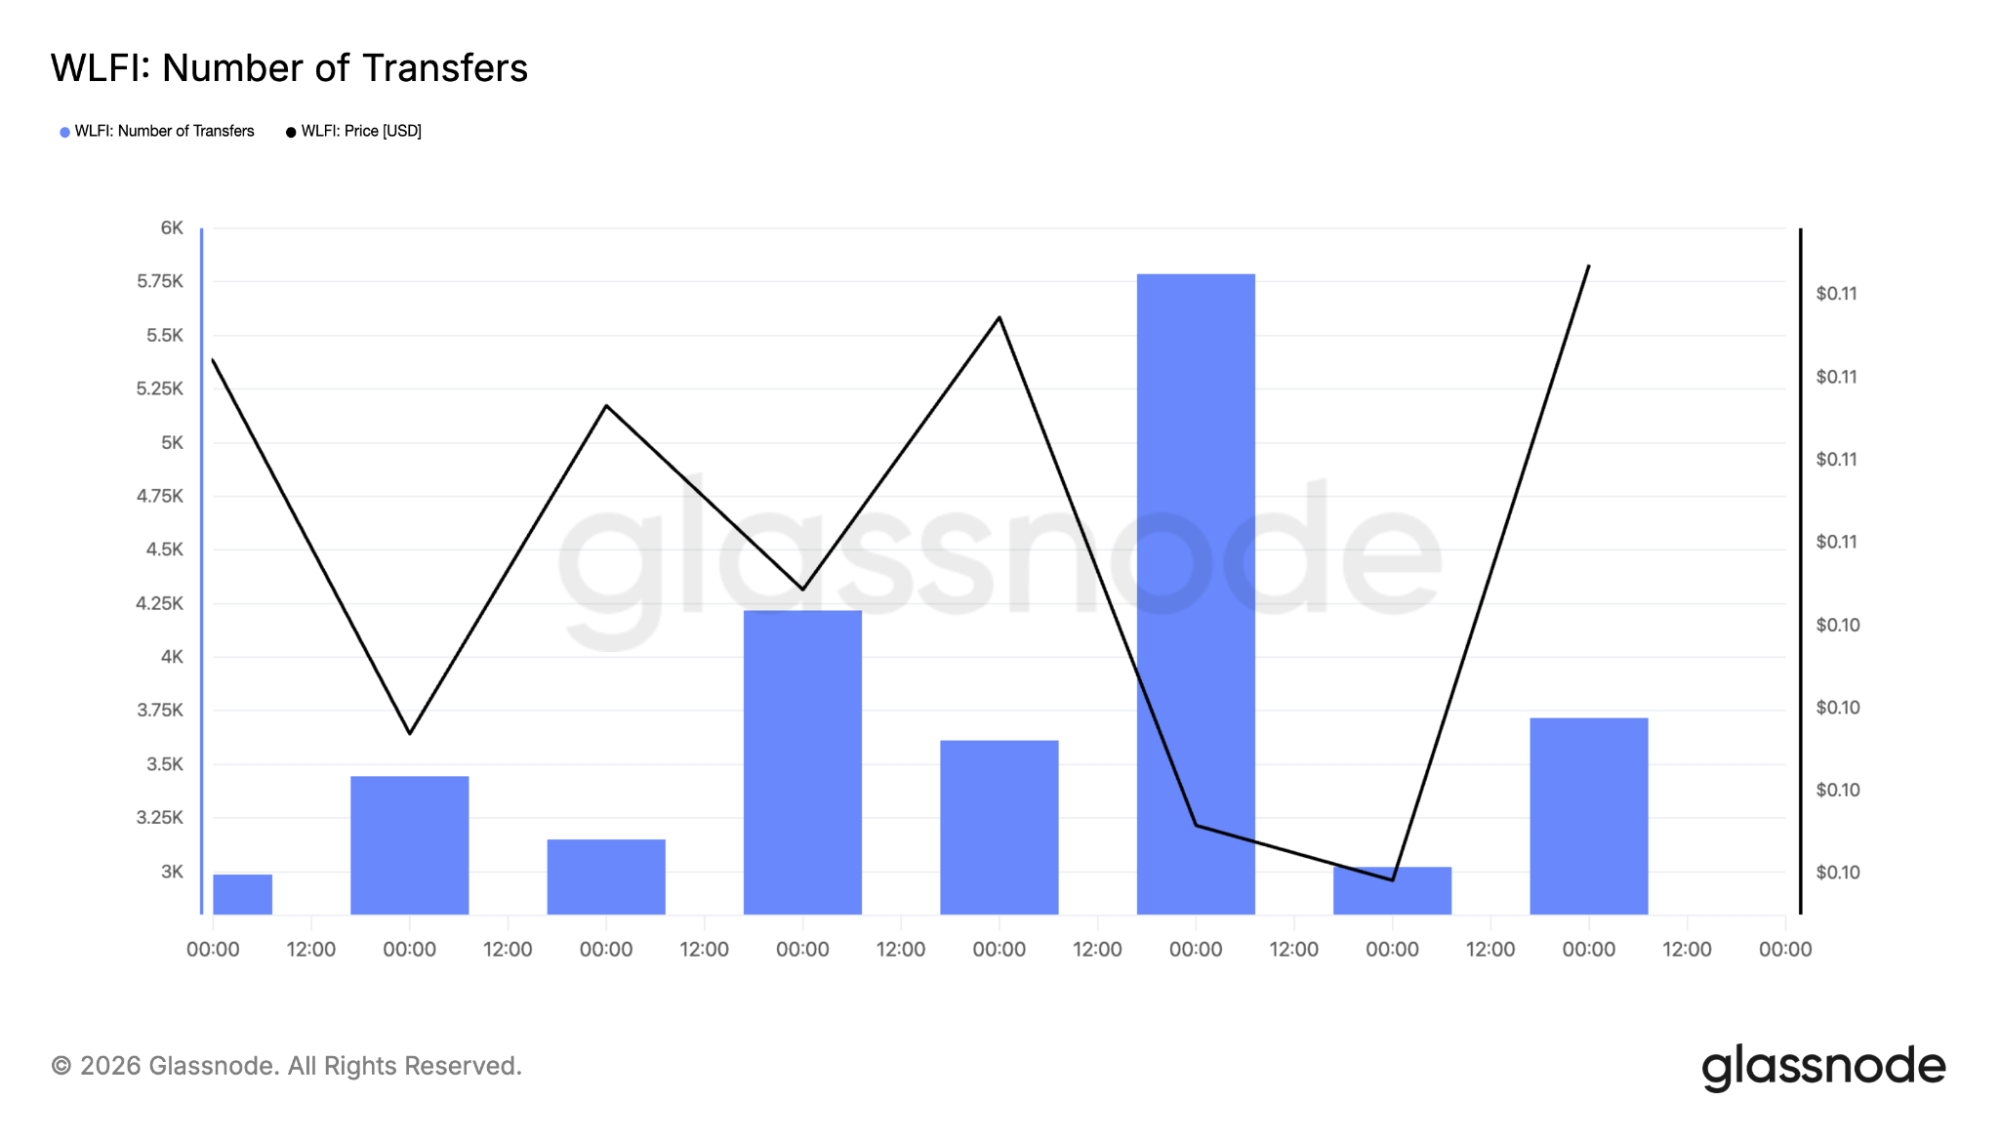
The number of transfers spiked too, which indicates overall activity is picking up across the network. None of this guarantees a breakout, but it does support the idea that WLFI is starting to attract attention again, not just printing a single lucky candle.
Resistance is still the big problem overhead for WLFI
Even with this rebound, WLFI isn’t out of danger yet. The WLFI price is moving higher, but it’s also running straight into heavy resistance zones overhead. The yellow Fibonacci levels on the chart mark the areas where previous rallies have stalled out, and they’re likely to attract sellers again.
The first big level sits around $0.125–$0.126. That’s the next real wall. If WLFI can break through that zone and hold above it, the recovery starts looking much more convincing. That’s when $0.135 becomes the next target traders will focus on.
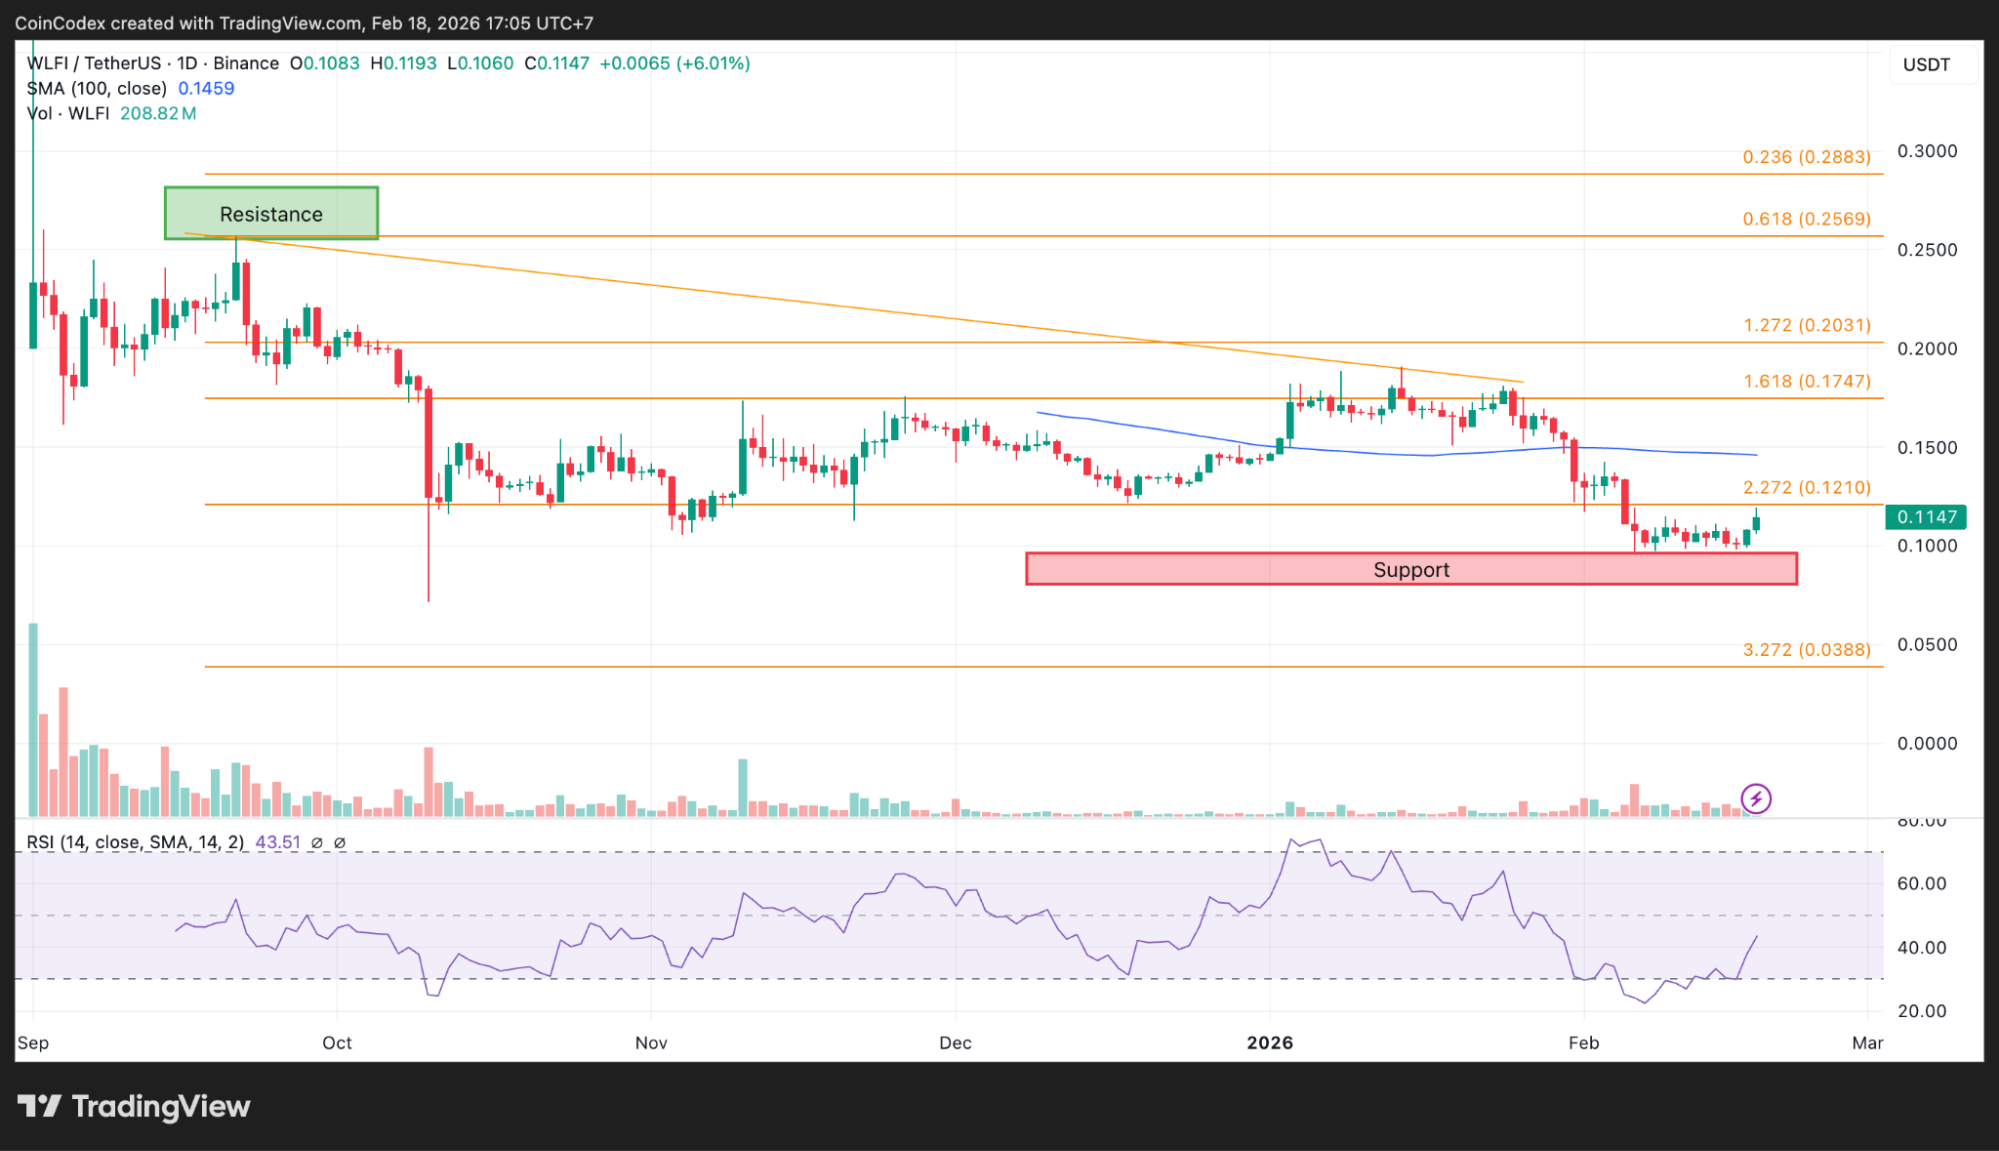
Daily WLFI price chart analysis
Above that, things get even tougher. The $0.166 region is another major resistance level from earlier price action, and further up, the $0.19 area remains the bigger ceiling from the previous range.
So even though WLFI has bounced, it’s still climbing into areas where sellers have been strong before. That’s why this next stretch matters so much.
The WLFI 4-hour chart shows momentum coming back fast
Looking at the 4-hour chart helps explain why traders are suddenly paying attention again. The WLFI price didn’t bounce slowly. It snapped higher with speed, pushing right back into the descending trendline that has capped price action through February.
That trendline is still the main obstacle. RSI on the 4-hour chart has also pushed into the upper 60s, which shows strong short-term momentum returning. That doesn’t automatically mean WLFI is going to keep ripping higher tomorrow, but it does show this isn’t a weak bounce.
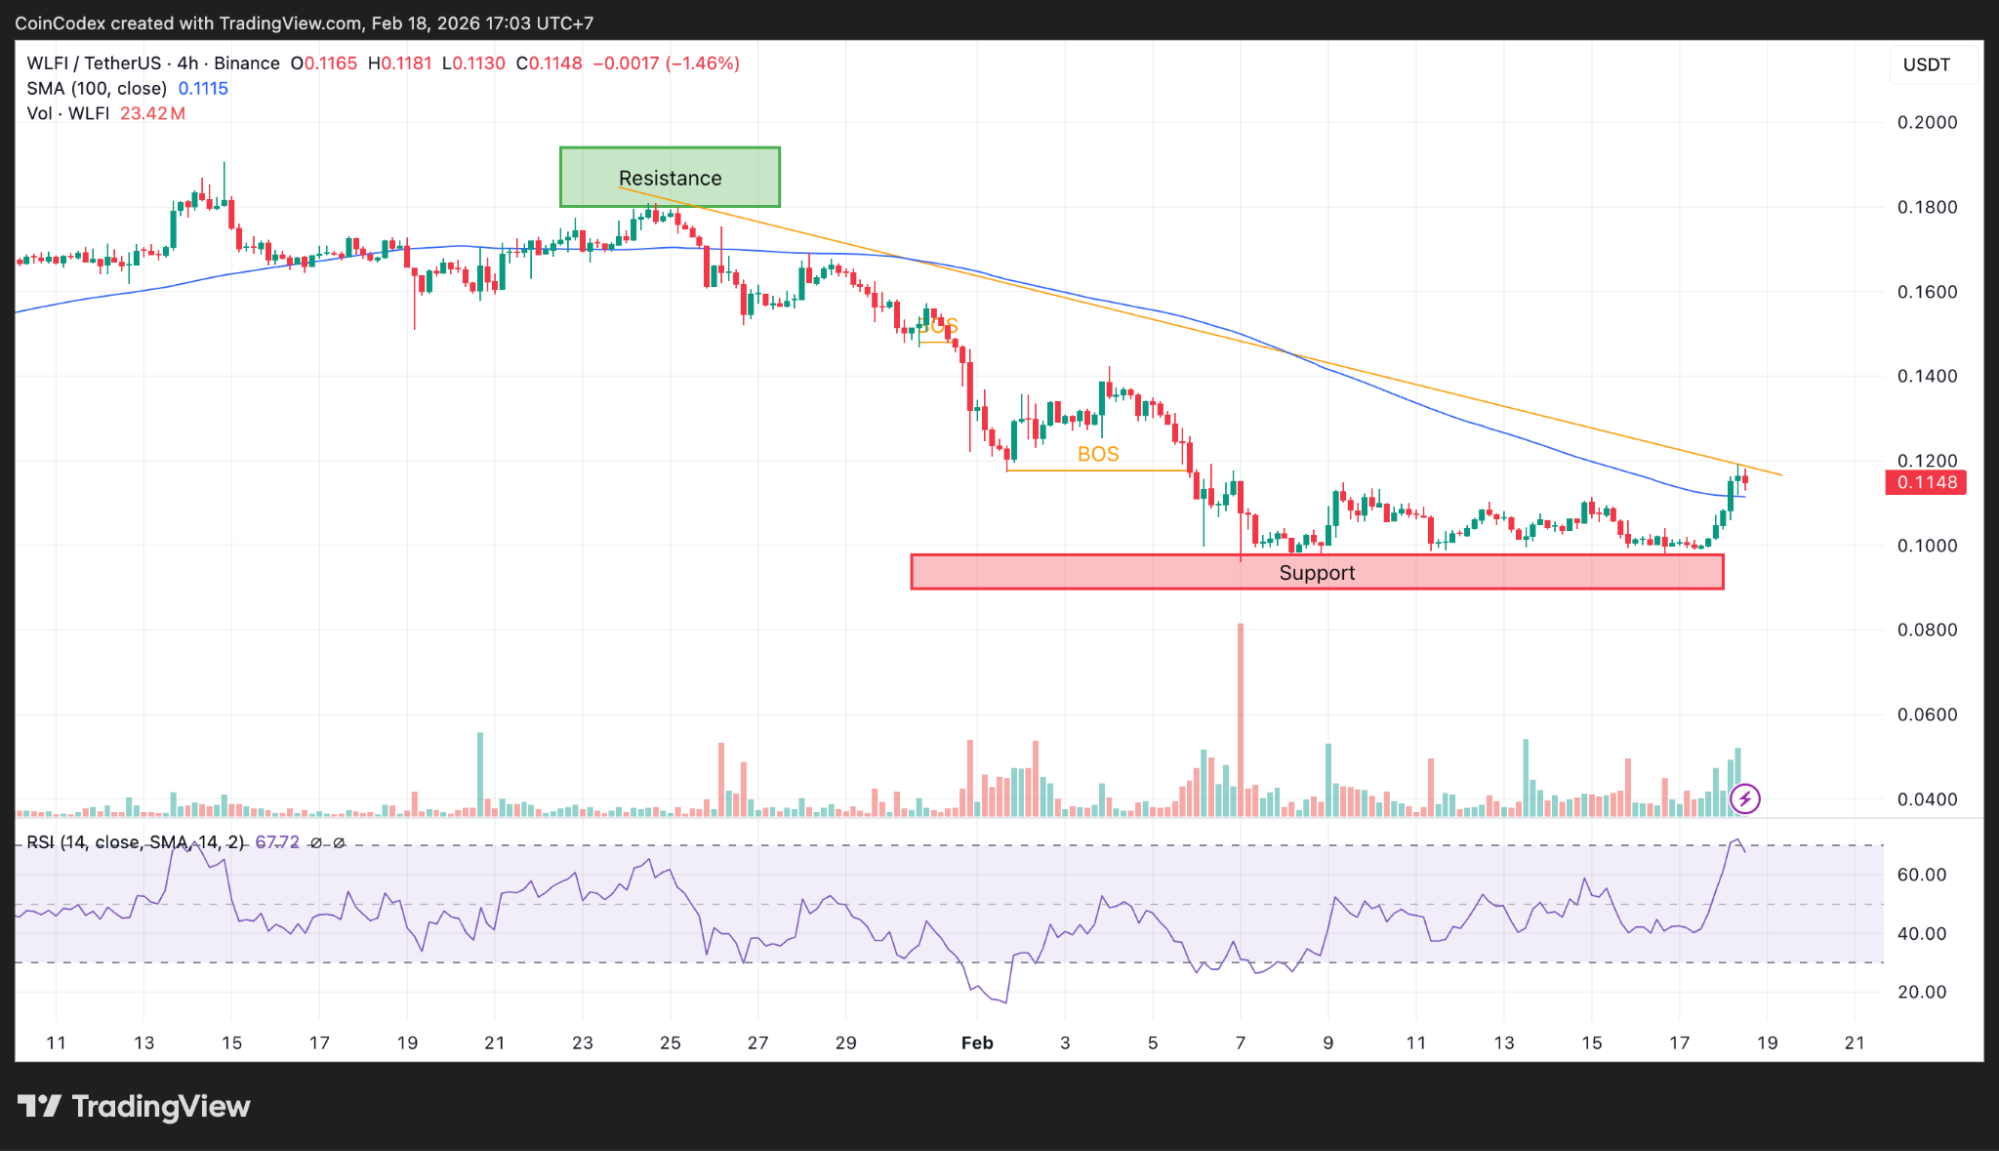
4-hour WLFI price chart analysis
At the same time, moves like this often cool off a bit after the first breakout candle, especially when momentum gets hot quickly. Right now, the key level to watch is $0.115. As long as the WLFI price holds above that breakout area, the bounce stays alive.
Where the WLFI price could head next
From here, the setup is pretty straightforward. If the WLFI price can stay above $0.115 and keep building strength, the next big test is that $0.125–$0.126 resistance zone. A clean breakout there opens the door toward $0.135, and possibly higher resistance levels beyond.
But if WLFI loses $0.115, the bounce could fade quickly, and price risks sliding back toward the $0.10 support floor again. Right now, WLFI has done the first job: defend support and wake up momentum. Now traders are watching to see if this recovery has real follow-through.
CoinCodex’s 1-month WLFI price prediction sees the token moving toward $0.08420 in the near term. That would pull WLFI back closer to its recent support zone, suggesting this bounce may still need more consolidation before any bigger breakout attempt.
Kraken: Best crypto exchange for security & reliability
- Buy, sell, and trade 400+ cryptocurrencies with industry-leading security
- Spot, Futures & Margin trading – leverage up to 5x for advanced traders
- Earn rewards with staking on top cryptocurrencies
- 24/7 customer support and high liquidity for fast trades
- Regulated in the US with strong compliance and security measures
- 13+ million users worldwide
Disclaimer: This content is for informational purposes only and does not constitute financial, investment, or other advice. Nothing on this page is a recommendation or solicitation. Always seek independent professional advice before making investment decisions. Some links may earn us a commission at no extra cost to you.
Source:: World Liberty Financial Price Prediction: WLFI Is Pumping But the Chart Still Isn’t Clear