Key highlights:
- HBAR is still holding above its breakout area; even after pulling back, the price hasn’t fallen apart.
- Shorter timeframes show things settling down, with selling pressure cooling off compared to earlier moves.
- Analysts are still watching the $0.504 level, but getting there depends on whether this quiet stretch turns into real follow-through.
Hedera has slipped into one of those phases that barely gets noticed, but those are often the ones that end up being important later.
The HBAR price already went through its painful reset, and what stands out now isn’t fear or excitement; it’s how calm things have become afterward.
There’s no panic selling anymore, but there’s no rush of buyers either. Price is just holding its ground. That kind of behavior usually shows up after a market has already flushed out weak hands. It’s not exciting, but it’s telling.
Hedera’s larger structure looks tired, not damaged
Looking at the chart shared by Javon Marks, it’s hard to miss the bigger picture. After peaking around $0.45 in 2021, the HBAR price went through a long, grinding decline that stretched well into 2023. It wasn’t dramatic or panic-driven. It was slow, repetitive, and exhausting.
That’s what makes the next phase so important. Eventually, the selling pressure eased, price stopped making lower lows, and HBAR began compressing into a base that lasted for months. When the breakout finally came, it wasn’t explosive or hype-driven, but it was clean. Since then, the HBAR price has stayed above that former base, even through the recent pullback.
$HBAR‘s breakout target at the ~$0.504 level has not changed.
With a key resisting trend breakout holding, we continue to watch for a >420% uphill run to reach this target.
Prices since breaking out remain up over 93%…
(Hedera) https://t.co/GGgcvdx82d pic.twitter.com/vapzoTBdmb
— JAVON⚡️MARKS (@JavonTM1) February 3, 2026
The latest dip doesn’t look like the start of another breakdown. It looks more like the market catching its breath. Price is still holding above prior breakout levels, and the broader structure hasn’t been damaged.
Even after pulling back, HBAR remains up more than 93% from its breakout zone. As long as price holds above that former resistance-turned-support area, the bigger picture stays intact.
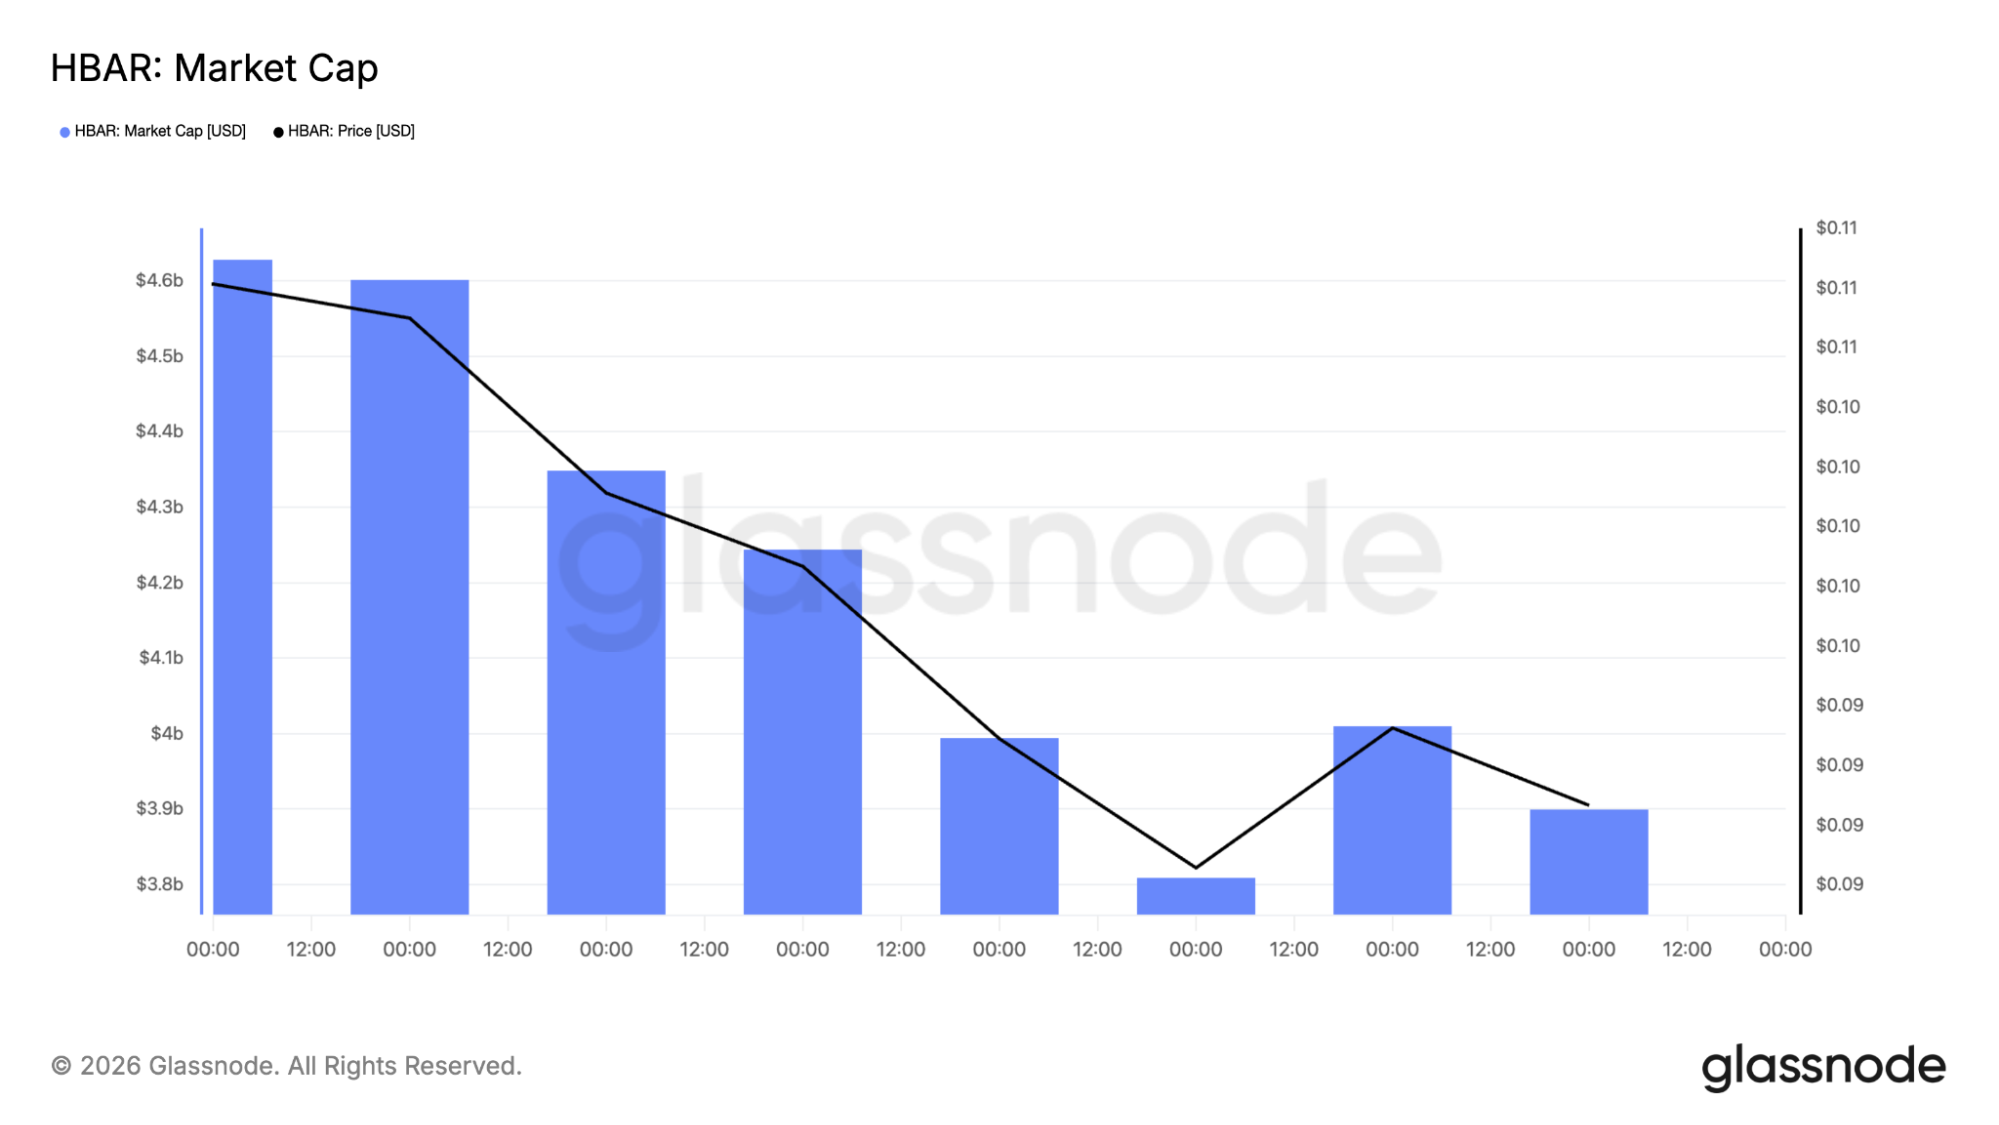
Market cap and drawdown show the heavy lifting is done
When you look at the market cap chart from Glassnode data, the trend makes sense. Capital has slowly drained out over time, sliding from the $4.6B area down toward the $3.8B–$3.9B range. The HBAR price followed that move lower, step by step, without any dramatic collapse.
The drawdown chart helps explain why things feel so quiet now. HBAR is still sitting roughly 80% to 85% below its all-time high. That’s a deep reset, and markets don’t usually stay emotional after moves like that. Most of the forced selling tends to happen earlier.
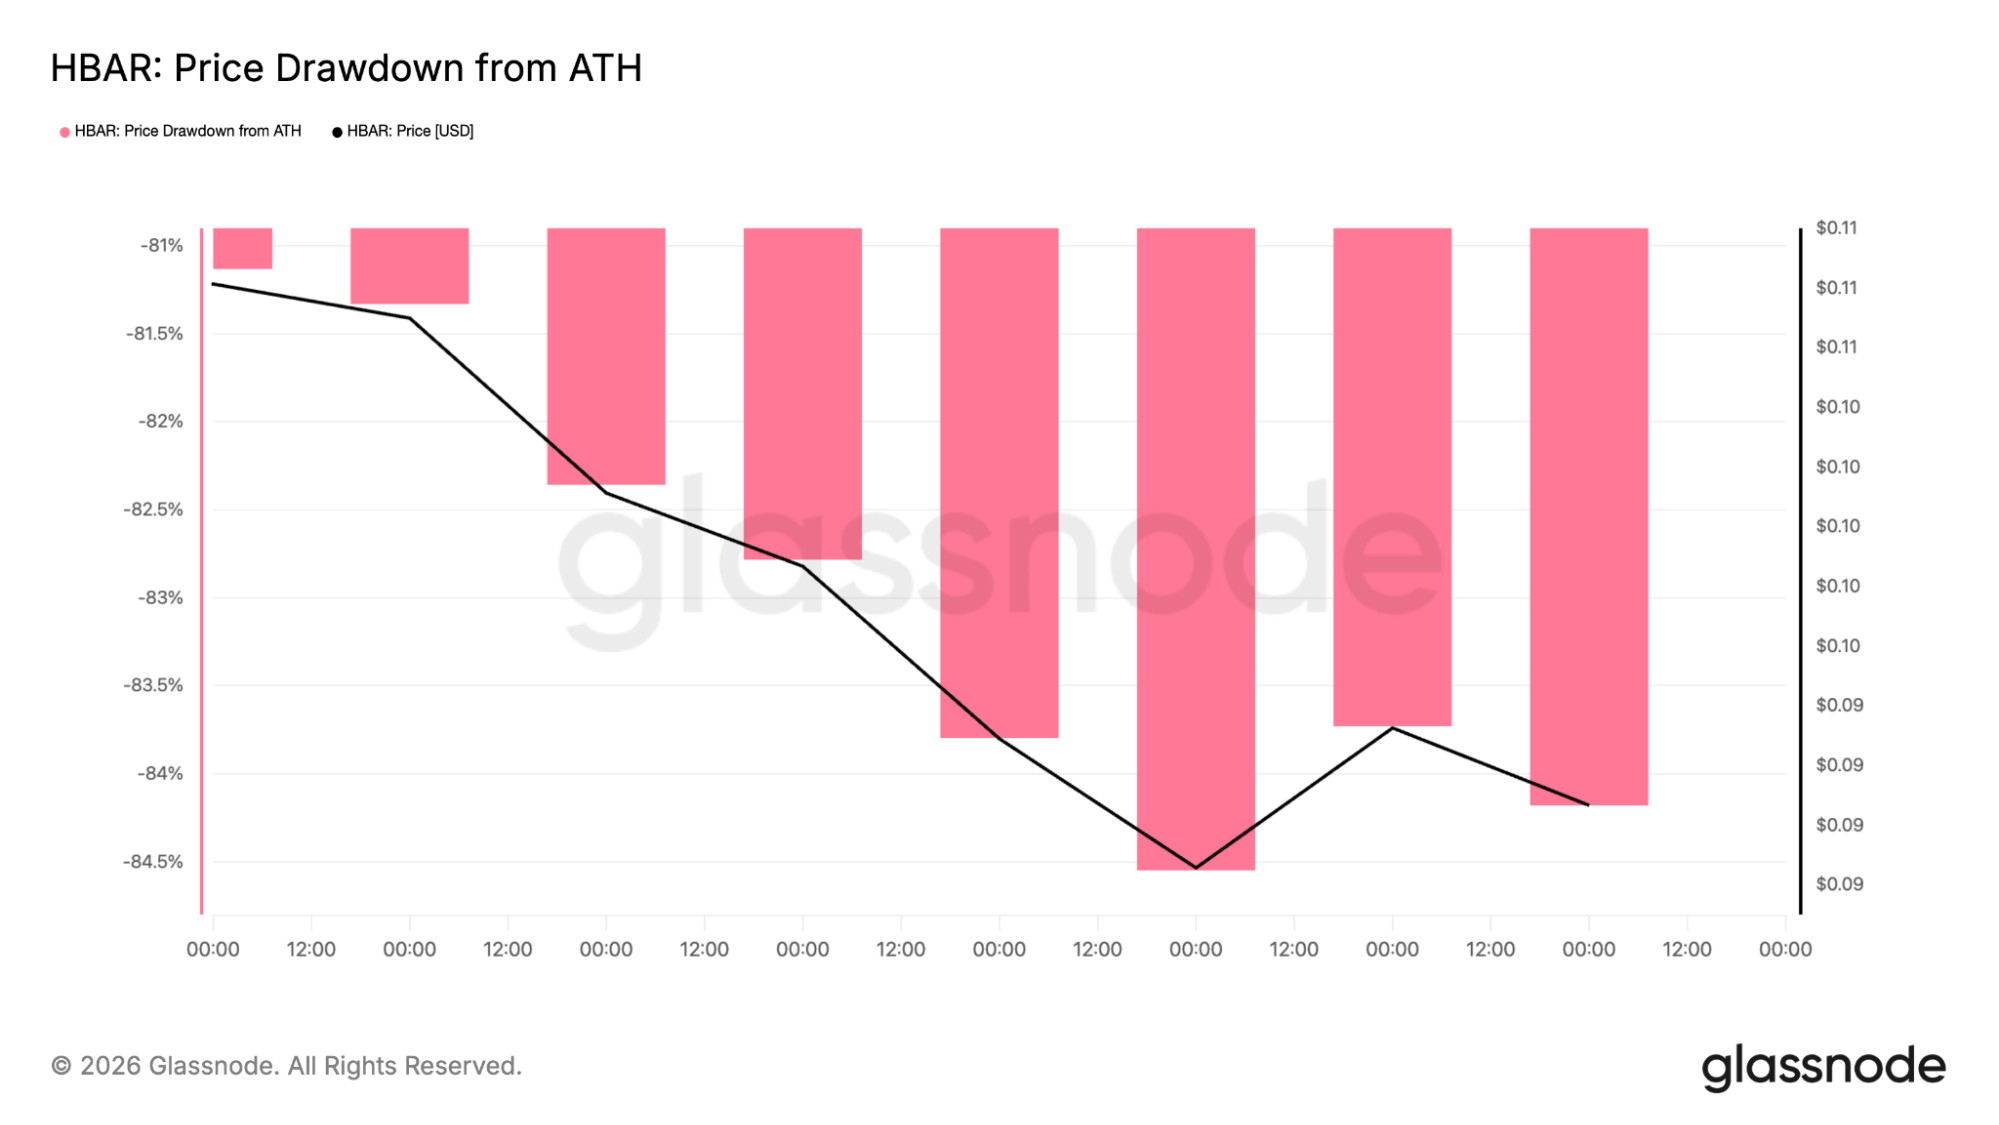
What’s important is that the drawdown has stopped accelerating. Instead of getting worse, it’s flattening out. That usually means selling pressure has already done most of its damage.
The 4-hour support holds as the HBAR daily chart tightens
On the 4-hour chart, the picture is pretty straightforward. The HBAR price keeps finding buyers between roughly $0.085 and $0.090. Every time price dips into that zone, it gets pushed back up.
At the same time, rallies have been capped below the 100-period moving average, which sits near $0.102–$0.105. That level has acted like a ceiling so far, stopping momentum before it can build.
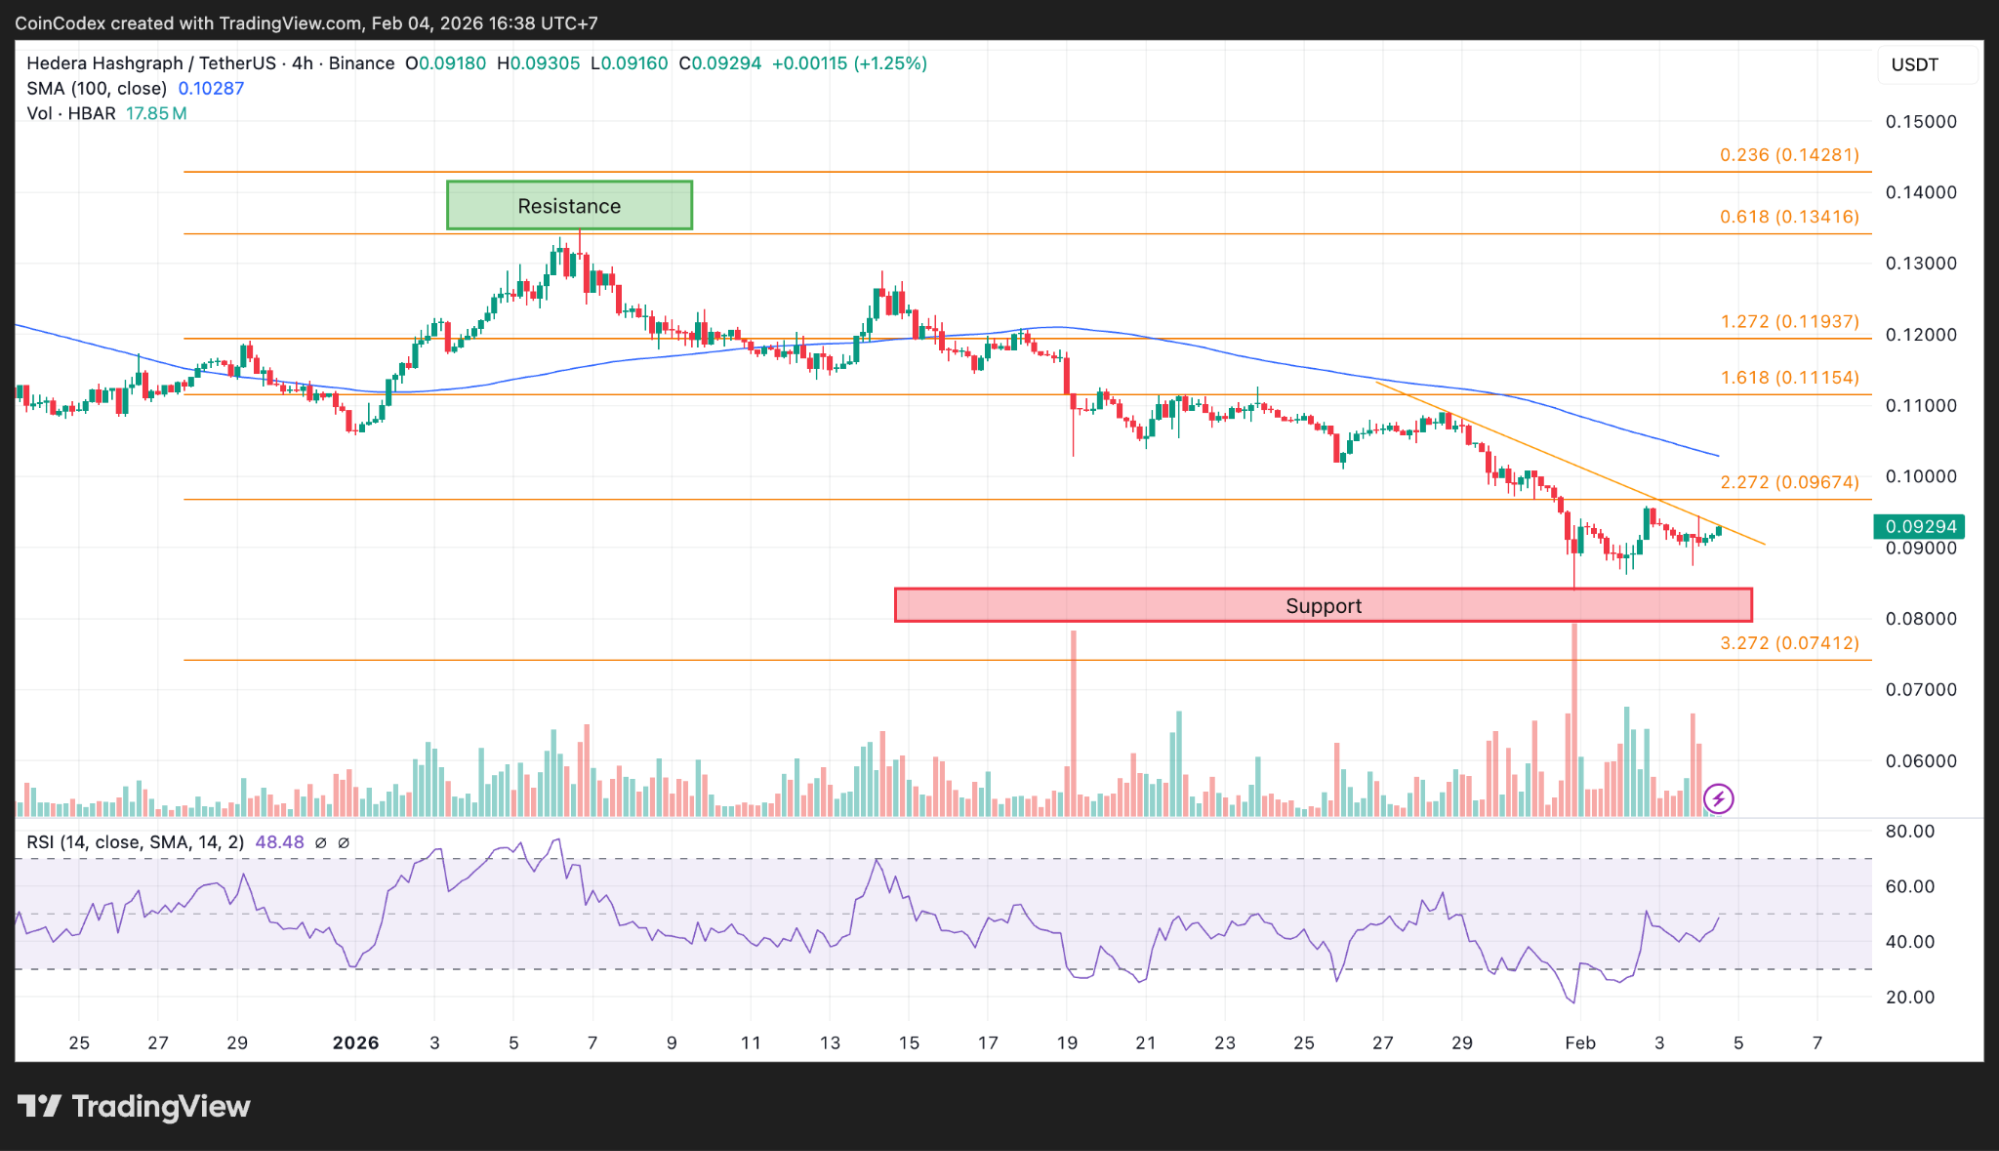
4-hour HBAR price chart analysis
The RSI on this timeframe is sitting around the mid-40s, which fits the theme. Nothing is stretched. Nothing is overheated. The market is paused, not panicked.
On the daily chart, the work still isn’t done. The HBAR price remains below major resistance levels tied to previous breakdowns. The $0.11–$0.12 zone keeps rejecting price, and until that changes, rallies will feel fragile.
Above that, the $0.145–$0.15 area stands out as the next real test. That zone lines up with prior reactions and visible Fibonacci levels, making it a natural place for sellers to show up again.
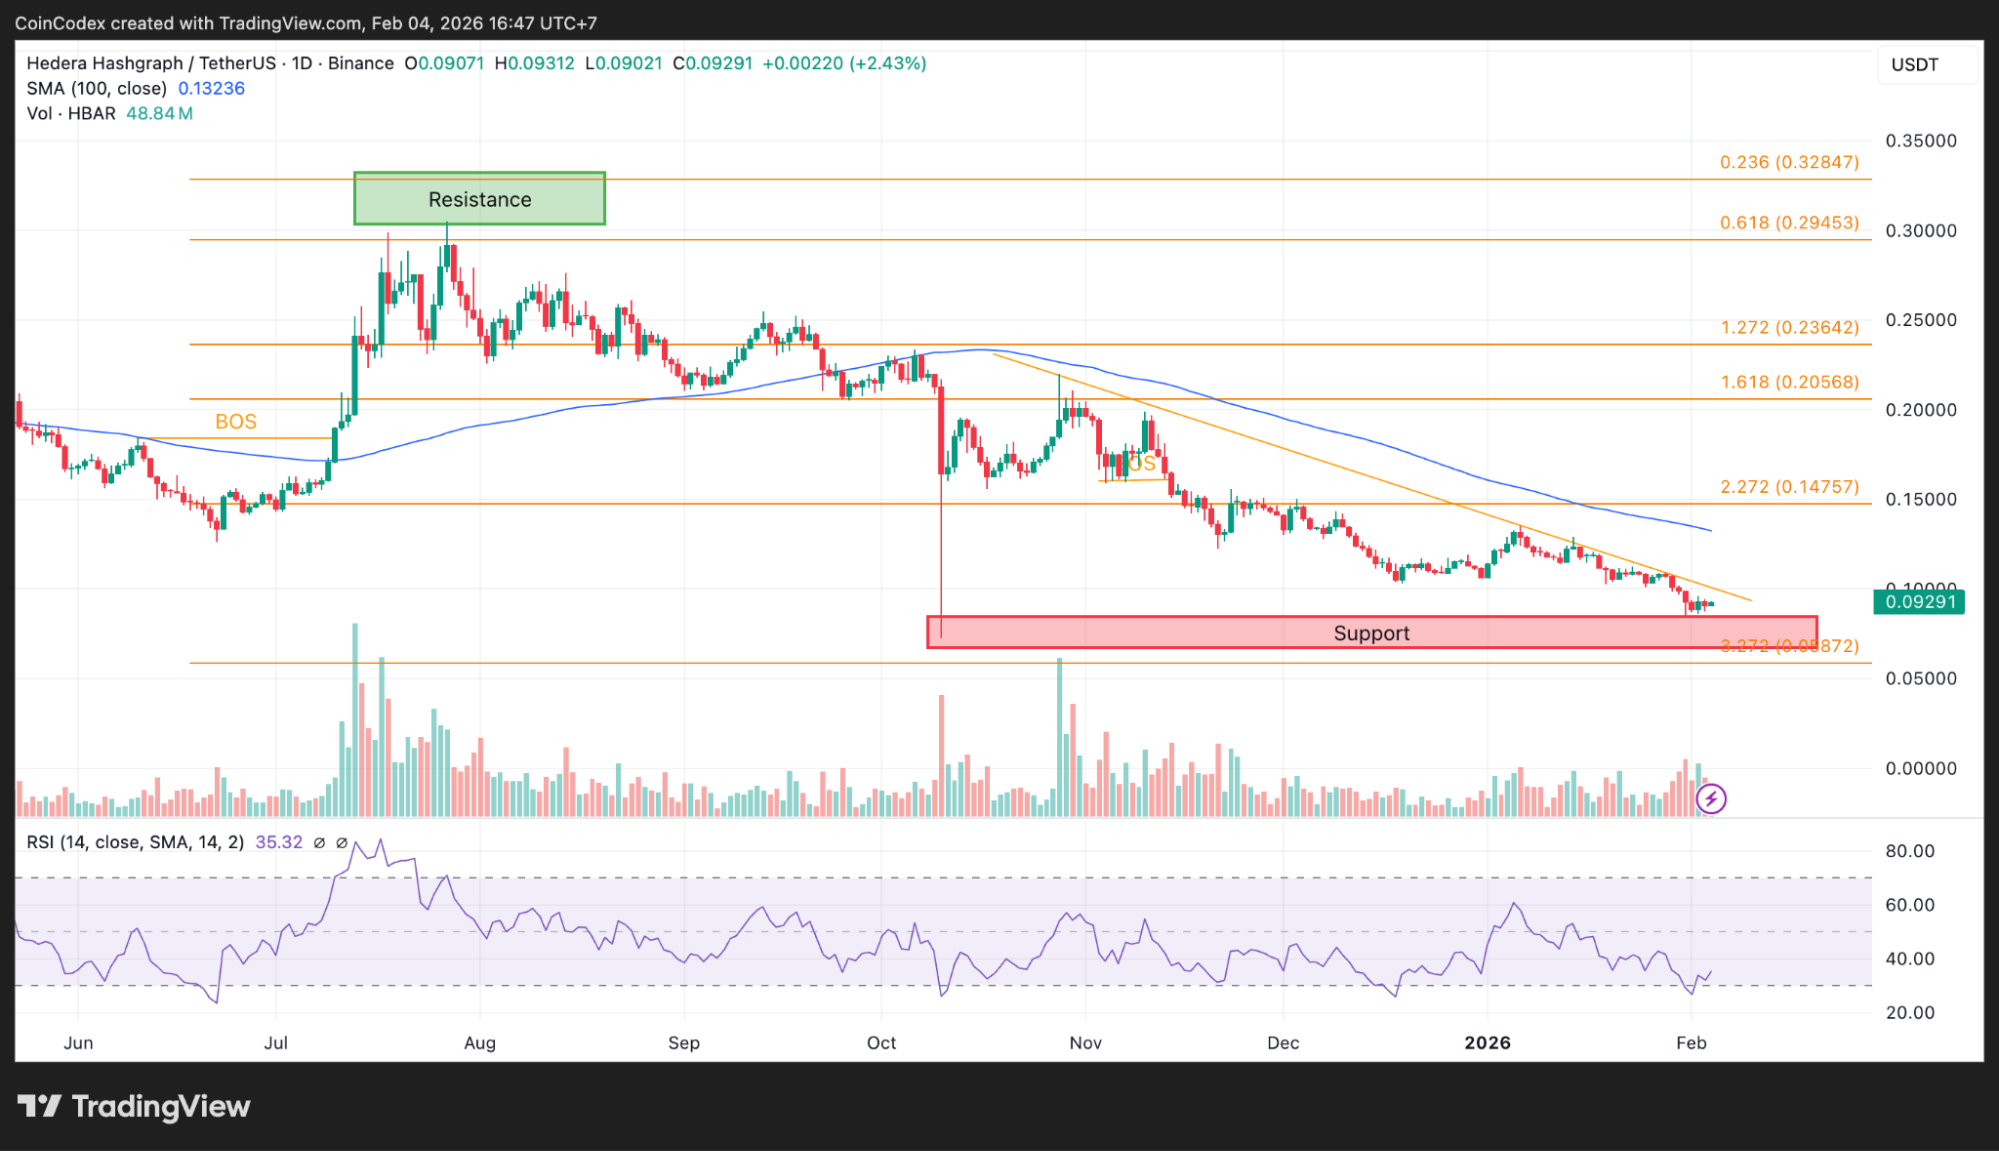
Daily HBAR price chart analysis
The daily RSI remains subdued in the low-to-mid 30s. That usually tells you momentum has cooled off significantly, even if price isn’t collapsing anymore.
Why the $0.504 target keeps staying on the table
This is where the longer-term discussion comes in. Analyst Javon Marks continues to point toward a $0.504 target, and that level hasn’t changed despite all the volatility in between. It lines up with a broader structural move measured from earlier consolidation phases.
From current levels, that would mean a move of more than 400%. That sounds extreme, but context matters. HBAR has already shown it can move sharply once momentum flips, especially after long periods of compression.
What makes this setup interesting is where the price is sitting now. The HBAR price isn’t chasing highs or breaking down. It’s resting near support, with risk clearly defined. If this structure fails, the downside is visible. If it holds and higher levels start to clear, upside opens quickly because overhead supply thins out.
What the market is really deciding right now for Hedera
This phase isn’t about excitement or narratives. It’s about structure. The HBAR price already survived the selloff. What comes next depends on whether stability can turn into follow-through.
As long as price holds above the $0.085–$0.090 base, the setup stays constructive. A clean move above $0.11 would be the first real signal that control may be shifting. From there, the path toward $0.15 and beyond becomes less crowded.
CoinCodex’s one-month HBAR price prediction places the token’s price around $0.1258, which lines up with the idea that price may continue stabilizing before any larger move.
Right now, HBAR feels quiet, compressed, and easy to ignore. Historically, those are often the conditions that show up before bigger moves begin. The chart isn’t promising anything, but it is setting the stage.
Kraken: Best crypto exchange for security & reliability
- Buy, sell, and trade 400+ cryptocurrencies with industry-leading security
- Spot, Futures & Margin trading – leverage up to 5x for advanced traders
- Earn rewards with staking on top cryptocurrencies
- 24/7 customer support and high liquidity for fast trades
- Regulated in the US with strong compliance and security measures
- 13+ million users worldwide
Disclaimer: This content is for informational purposes only and does not constitute financial, investment, or other advice. Nothing on this page is a recommendation or solicitation. Always seek independent professional advice before making investment decisions. Some links may earn us a commission at no extra cost to you.
Source:: Hedera (HBAR) Price to $0.504? Analyst Eyes a Potential 420% Run