Key highlights:
- After a strong run, Gold has begun to stall, and that’s usually when traders start looking around for the next place capital might flow.
- Bitcoin went through a sharp correction earlier, which often lines up with periods where risk assets start to look interesting again.
- With expansion signals back in play, many are watching to see if the familiar rotation from gold into bitcoin begins to show up again.
In the last month, Bitcoin has dropped by 14% as the world’s biggest digital asset has been suffering a persistent downtrend. Meanwhile, the gold price is up 14% in the same time frame, despite seeing a sharp correction that brought the gold price from its historical peak of $5,590 back below $5,000.
Are we about to see a reversal in this trend, with capital from gold flowing into Bitcoin? Gold and Bitcoin price action from 2020 could give us a hint of what to expect next.
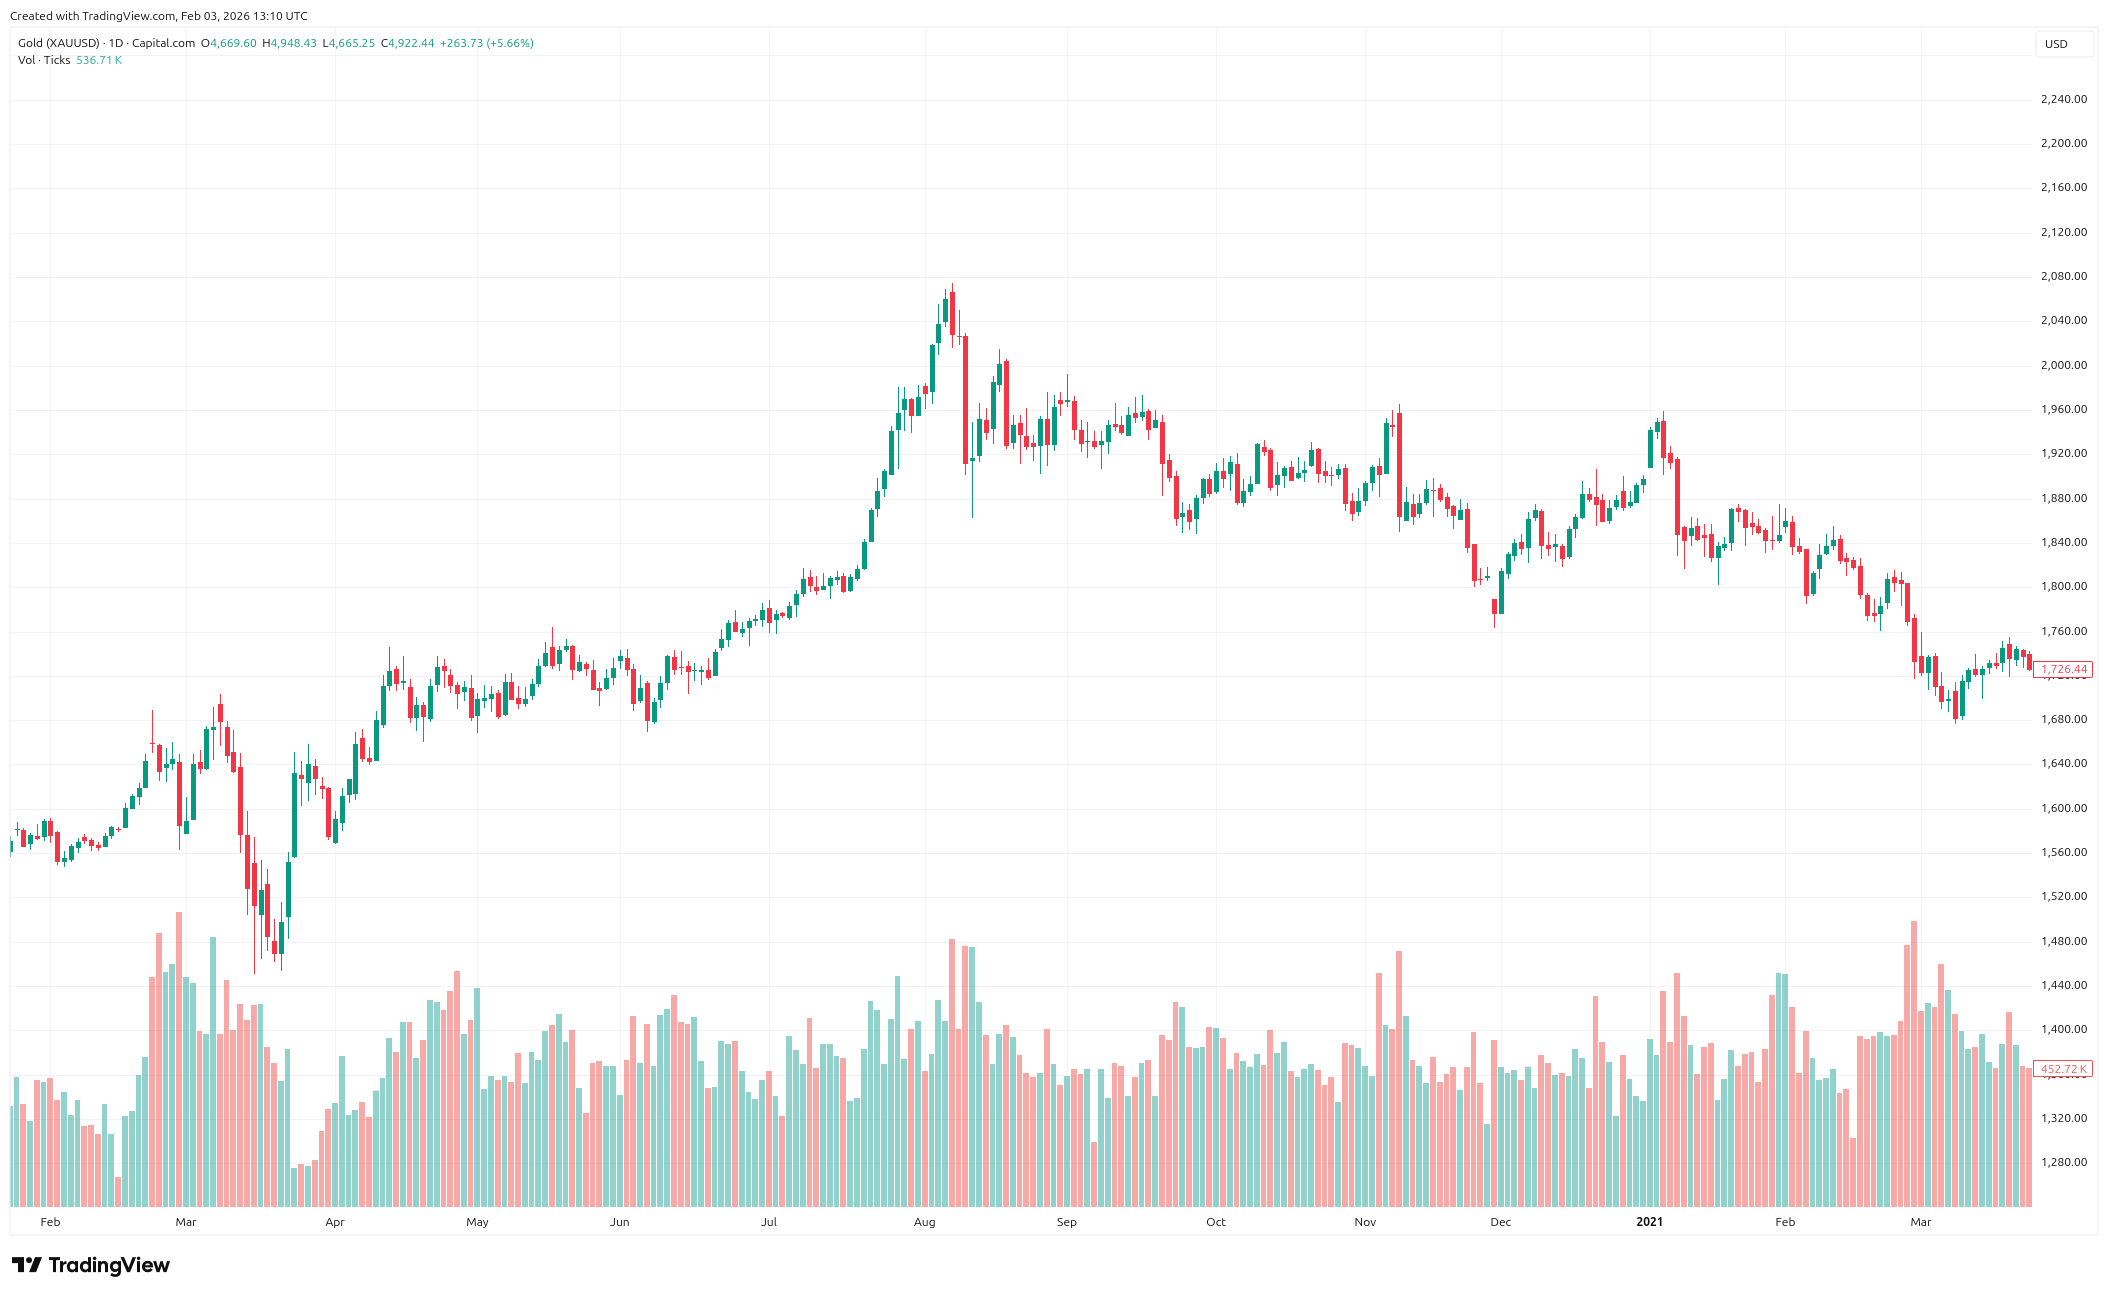
The chart shared by BullTheory lays everything out clearly. The gold price didn’t blow off the top in dramatic fashion back in August 2020. It crept up to around $2,075, hesitated for a bit, and then quietly started losing steam.
The gold price moved lower the next few weeks by about 10% and the loss did not really dissipate. From September 2020 to April 2021, gold fell lower and went 15% below the highs.
The key detail here is how it happened. This wasn’t panic selling. Gold simply stopped being the place everyone wanted to park their money. When that happens, capital usually starts looking for alternatives.
Bitcoin took the first hit during the 2020 pullback
Bitcoin didn’t escape the initial damage. As gold rolled over, the BTC price followed it down. In just a few weeks, Bitcoin dropped from around $12,000 to roughly $9,825, a painful move that wiped out close to 20%. On the chart, it looks like a classic shakeout. Fast drop, confidence shaken, and a lot of people forced out.
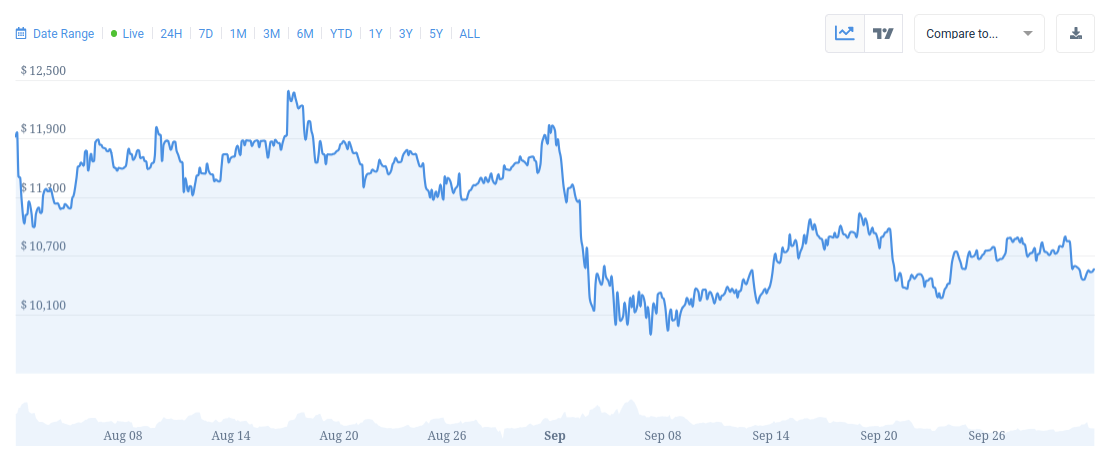
After that flush, things went quiet. The BTC price halted its decline and began moving sideways. It wasn’t flashy, but it mattered. Sellers were losing their grip, although buyers weren’t yet ready to jump in with some real momentum.
DOES MONEY ACTUALLY ROTATES FROM GOLD INTO BITCOIN ONCE GOLD TOPS ?
Yes, this has happened before.
In August 2020, Gold topped at $2,075 and dropped nearly 10% in the next 4 weeks. Bitcoin also followed Gold and crashed nearly 20% from $12,000 to $9,800.
This move scared… pic.twitter.com/EdNWZ61kr0
— Bull Theory (@BullTheoryio) February 2, 2026
When Bitcoin and Gold parted ways
Now, this is where the chart really starts to tell a story. As you can see, after September 2020, the gold price continued to fall further as it was not able to rise back to previous highs. But this was not the case with Bitcoin. After months of chopping around, the BTC price broke higher and started trending up in a big way.
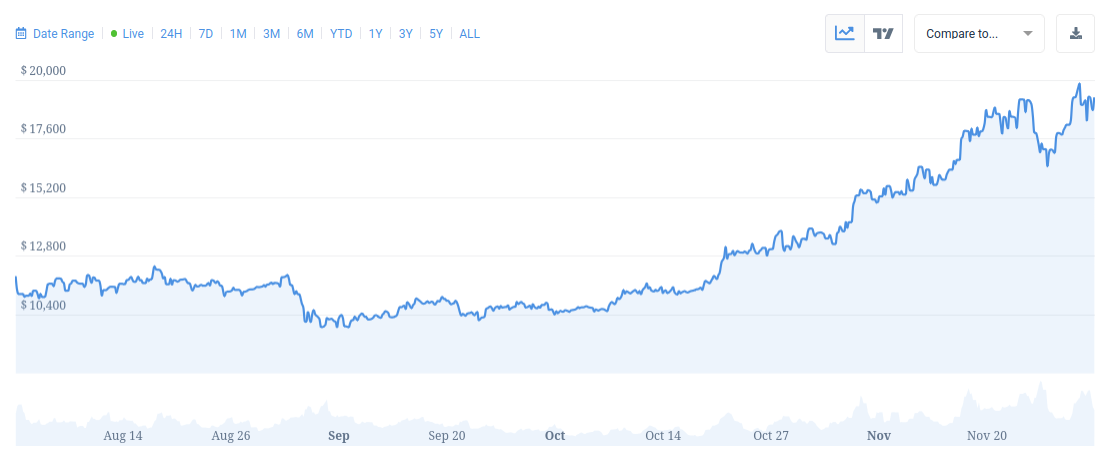
Over the next eight months, Bitcoin gained 559%. It went as high as $64,850 in April 2021. The difference could not have been more striking. Gold went down in a grinding motion. Bitcoin went up in a series of waves. It was not a random price action. It looked like money moving out of safety and into risk as confidence returned.
Why traders still care about this setup
This pattern keeps coming up because the backdrop mattered just as much as the charts. In 2020, broader economic indicators flipped positive right around the time gold topped and Bitcoin finished correcting. That combination helped unlock one of the strongest crypto runs ever.
No two cycles are identical, and nothing is guaranteed to play out the same way. Still, the relationship between Bitcoin and gold offers a useful lens. Bitcoin doesn’t need gold to collapse. It just needs gold to stop leading.
When gold stalls, capital often looks elsewhere. In 2020, Bitcoin was ready when that happened. That’s why traders still study this comparison closely whenever the market starts hinting at a return to risk-on behavior.
CoinCodex’s 1-month BTC price prediction places Bitcoin near $83,416, pointing to a steadier near-term phase after the recent pullback. And the 1-month gold price outlook has Gold hovering around $4,245.45, hinting that momentum may cool rather than accelerate in the short term.
Source:: Gold May Be Cooling Off as Bitcoin Sets Up for the Next Risk-On Rotation