Key highlights:
- Cardano has been trying to consolidate and stabilize as buyers enter the market at a known support level.
- The ADA price is currently encountering a nearby level of resistance that could decide if this is a bounce.
- The setup looks constructive, but ADA still needs follow-through before anything bigger can happen.
Cardano is in a bit of an awkward spot right now. The ADA price has spent weeks under pressure, and that still shows on the chart. At the same time, price has started to settle around a level that’s mattered before, which makes things a little more interesting than a straight-down move.
That’s where the tension comes from. ADA is hovering in an area that can go either way, and the next move likely depends on how price handles the resistance just overhead. If buyers can push through, the mood can shift quickly. If they can’t, the same selling pattern that’s been in control could easily take over again.
ADA price pushes into weak resistance after the recent bounce
After the recent drop, the ADA price finally caught a bid around $0.267, a level that’s stepped in as support before. As noted by MoreCryptoOnline, the price didn’t spend much time there. Buyers showed up fairly quickly and pushed ADA back up into the first area of resistance overhead.
$ADA
The price has reached the $0.267 support level yesterday and is now testing the first micro resistance zone, which I see as weak resistance. Should we see a break above this zone then the next area to watch is located between $0.32 and $0.358. pic.twitter.com/3CaoRb0ygT— More Crypto Online (@Morecryptoonl) February 1, 2026
This zone isn’t a major wall. It formed during the last breakdown and hasn’t been tested much, which is why it’s being viewed as weak resistance. That makes this moment important. If the ADA price can break through and stay above it, the tone shifts from simply stopping the damage to starting a recovery.
If that happens, the next area to watch sits between $0.32 and $0.358. That range lines up with previous reactions on the chart and marked levels traders are paying attention to. Until then, ADA is sitting in a decision zone where price can turn quickly depending on how much follow-through buyers bring.
What the on-chain data is saying
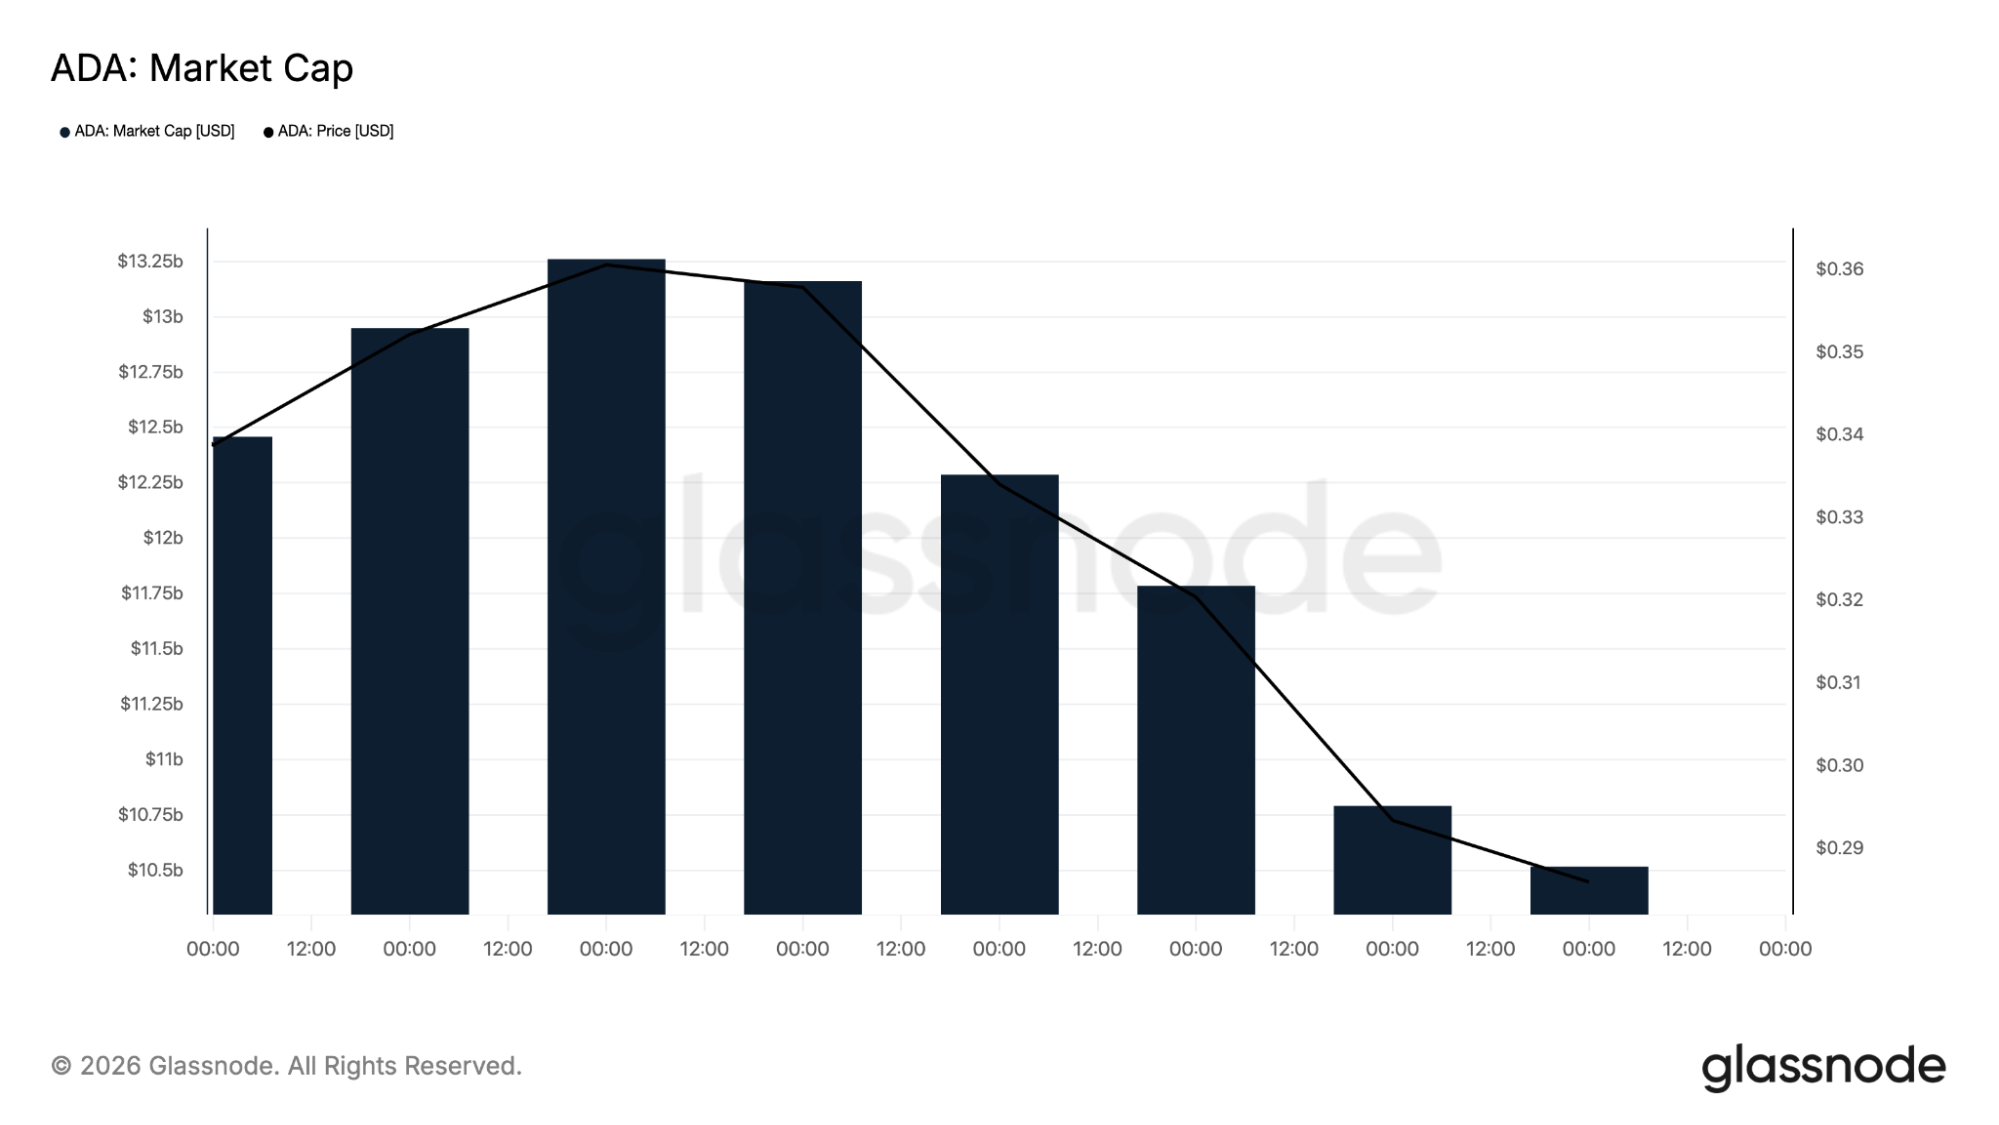
The Glassnode charts add another layer to the picture. Market cap has been drifting lower alongside price, which fits with what traders are feeling. Capital has been leaking out, and strong inflows haven’t returned yet.
The drawdown chart puts things into perspective. ADA is still down close to 90% from its all-time high. That doesn’t mean a bottom is guaranteed, but it does mean the ADA price is sitting in a historically depressed zone.
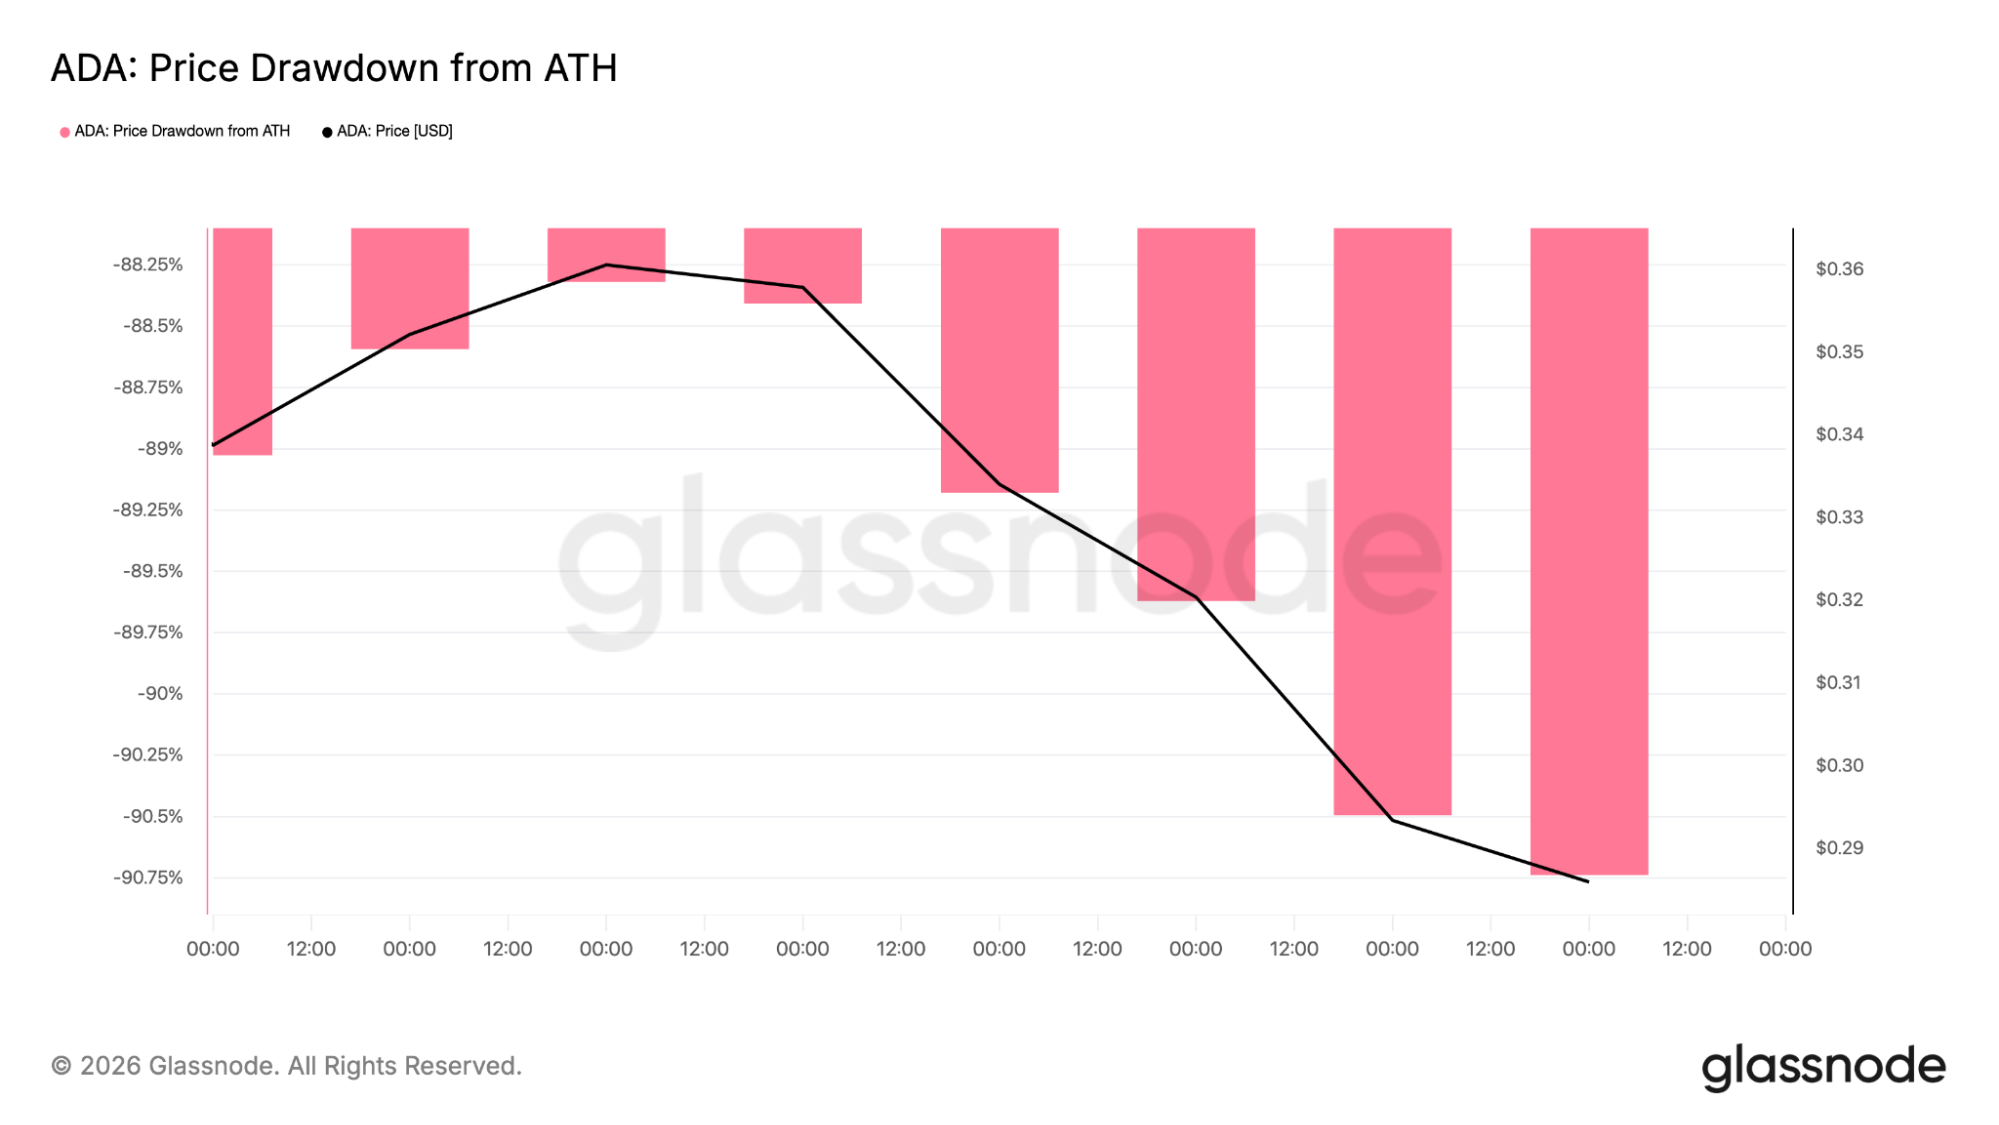
In these conditions, even small catalysts can spark decent reactions, simply because positioning is light and sentiment is already damaged.
Why ADA is being watched closely at this level
On the 4-hour chart, the trend has been pretty clear. The ADA price has been printing lower highs and lower lows, and every bounce has been capped by a falling trendline. That’s the market’s way of saying sellers have stayed in control.
The latest drop found support right around $0.267. Price tagged that level, flushed lower briefly, and then bounced back into a nearby resistance zone. That bounce lines up with what many traders have been watching: a reaction, not a full reversal.
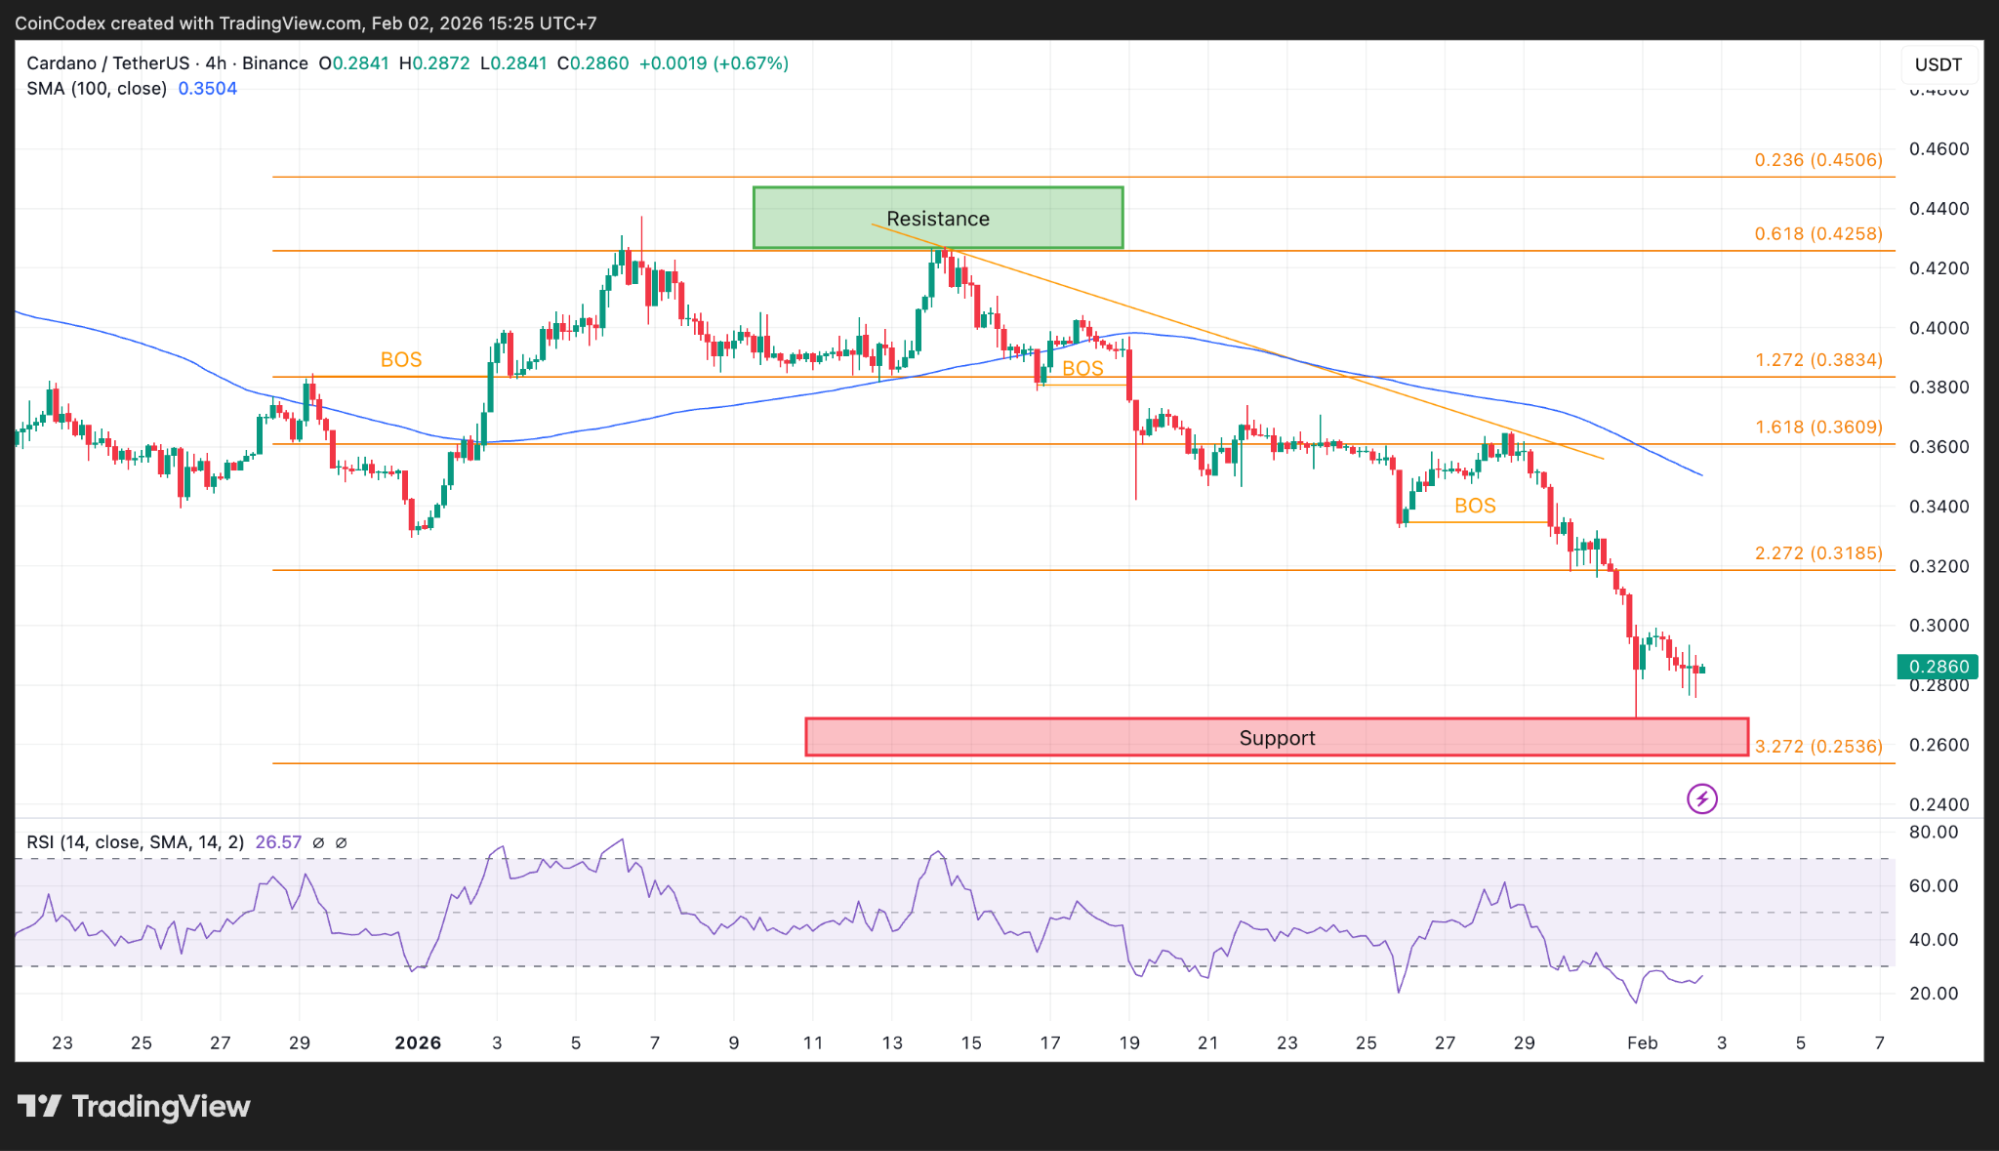
4-hour ADA price chart analysis
RSI on this timeframe is deep in oversold territory, sitting in the mid-20s. That tells you selling has been aggressive. Oversold conditions don’t force price higher, but they often slow the downside and open the door for short-term bounces as sellers start locking in profits.
Price is also well below the 100-period SMA on the 4-hour chart, which sits up in the low-to-mid $0.30s. That moving average is acting like a ceiling for now.
The Cardano daily chart still has work to do
When you move back to the daily chart, the larger issue becomes apparent. ADA is still trapped in a large downtrend and is well below key moving averages. The 100-period simple moving average on the daily chart is in the low $0.40s, and the price is nowhere near getting back to it.
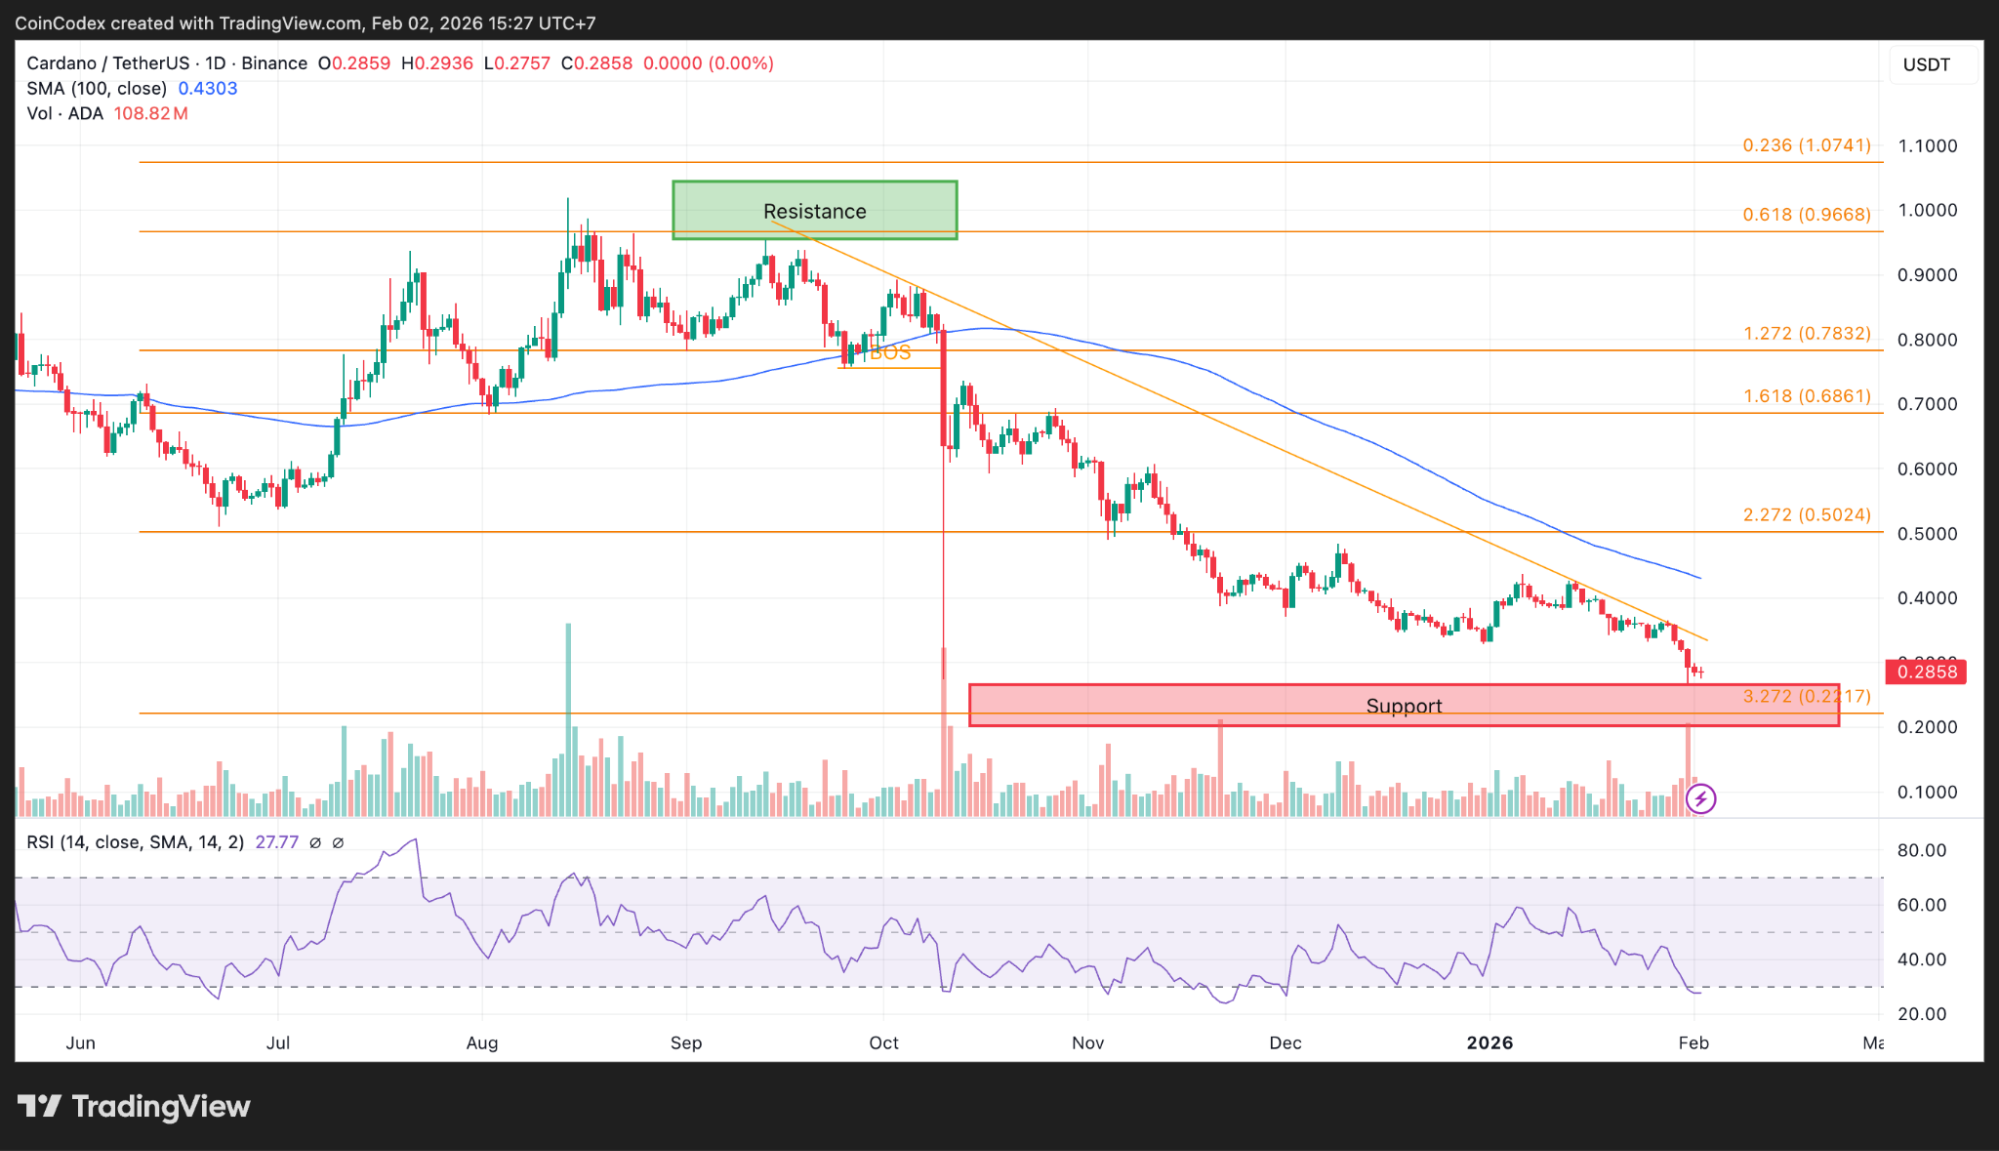
Daily ADA price chart analysis
Daily RSI is hovering in the high-20s, which shows just how much momentum has faded. That kind of reading often shows up near local bottoms, but it also tells you buyers haven’t stepped in with real conviction yet.
The small positive is that the ADA price didn’t slice straight through $0.267 and keep falling. It paused, bounced, and started testing higher levels. That’s usually the first step before anything more meaningful can happen.
The key Cardano levels that decide what happens next
Right now, the first test is the micro resistance zone just above the $0.267 bounce. It’s not a strong ceiling, but it still needs to be cleared cleanly.
If ADA can break and hold above this level, the next resistance zone sits at $0.29–$0.30. A successful push through that area opens the door toward $0.318–$0.32, with the $0.336–$0.358 range acting as the next major upside target.
Above that, things get much harder. The high $0.30s into the low $0.40s are packed with prior resistance, trendlines, and moving averages that sellers have defended before.
On the flip side, if the ADA price goes below $0.267 once again, then the narrative of a bounce starts to unravel. If it goes below that level, then there is support at $0.253–$0.255 and then a drop to the low $0.24s.
The next few sessions should make it clear whether the ADA price can reclaim $0.32 or if this move fades like the others. A one-month ADA price forecast from CoinCodex points to $0.3990, which leans toward a more bullish outlook.
Kraken: Best crypto exchange for security & reliability
- Buy, sell, and trade 400+ cryptocurrencies with industry-leading security
- Spot, Futures & Margin trading – leverage up to 5x for advanced traders
- Earn rewards with staking on top cryptocurrencies
- 24/7 customer support and high liquidity for fast trades
- Regulated in the US with strong compliance and security measures
- 13+ million users worldwide
Disclaimer: This content is for informational purposes only and does not constitute financial, investment, or other advice. Nothing on this page is a recommendation or solicitation. Always seek independent professional advice before making investment decisions. Some links may earn us a commission at no extra cost to you.
Source:: Cardano Price Analysis: ADA Finds Its Footing – Is It Time to Buy?